SlideShare a Scribd company logo
1 of 33
Download to read offline
An edited version of this paper is forthcoming in the Journal of Cleaner Production
The Effect of Local and Global Learning on the Cost of Renewable
Energy in Developing Countries
Joern Huenteler1,2
*, Christian Niebuhr1,3
, Tobias S. Schmidt1,4
1
Department of Management, Technology and Economics, ETH Zurich, Switzerland
2
Belfer Center for Science and International Affairs, John F. Kennedy School of Government, Harvard
University, USA
3
School of Business and Economics, RWTH Aachen University, Germany
4
Precourt Energy Efficiency Center, Stanford University, USA
*corresponding author: jhuenteler@ethz.ch; +41 44 632 97 39; +41 44 632 05 41
Abstract
High upfront costs are a critical barrier for investments in clean infrastructure technologies in
developing countries. This paper uses a case study of Thailand’s electricity sector to create realistic
estimates for the relative contributions of local and global technological learning to reducing these
cost in the future and discusses implications of such learnings for international climate policy. For six
renewable electricity technologies, we derive estimates for the share of locally and globally sourced
goods and services, and analyze the effects of local and global learning during the implementation of
Thailand’s renewable energy targets for 2021. Our results suggest that, in aggregate, the largest
potential for cost reduction lies in local learning. This finding lends quantitative support to the
argument that the conditions enabling local learning, such as a skilled workforce, a stable regulatory
framework, and the establishment of sustainable business models, have a more significant impact on
cost of renewable energy in developing countries than global technology learning curves. The recent
shift of international support under the United Nations Framework Convention on Climate Change
towards country-specific technology support is therefore promising. However, our results also show
that the relative importance of local and global learning differs significantly between technologies,
and is determined by technology and country characteristics. This suggests that international support
need to consider both the global perspective and local context and framework conditions in order to
reap the full benefits of technological learning across the wide range of clean technologies.
Keywords: Climate policy, Technology transfer, Technological capabilities, Technological learning,
Thailand, Renewable energy
1
An edited version of this paper is forthcoming in the Journal of Cleaner Production
Highlights:
• Development of a techno-economic model of Thailand’s Alternative Energy Development
Plan 2012-2021
• Analysis of the impacts of local and global learning effects on mitigation cost
• Demonstration that the importance of global and local learning varies between clean
technologies
• Finding that local learning is significant for wind, PV, biogas and micro hydro, whereas global
learning is important for PV and solar thermal
• Discussion of the future role of the international support for clean technologies
2
An edited version of this paper is forthcoming in the Journal of Cleaner Production
1. Introduction
The global climate policy regime needs to significantly accelerate the diffusion of clean technologies
to avoid dangerous impacts from climate change (UNFCCC, 2012). In addition to actions taken by the
developed world, developing countries are expected to assume greater responsibility by
implementing domestic policies that contribute to both domestic economic development and
climate change mitigation (Kanie et al., 2010). Indeed many developing countries are already
implementing domestic climate legislation, despite the gridlock in international negotiations
(Nachmany et al., 2014; REN21, 2013; Townshend et al., 2013). However, high upfront costs remain a
critical barrier for large-scale investments in clean technologies, especially in developing countries
(IPCC, 2012; Schmidt, 2014). How to accelerate the development and transfer of clean technologies is,
therefore, emerging as a central issue in the international climate policy negotiations (Ockwell and
Mallett, 2012; Pueyo et al., 2012).
Experience in the industrialized world has shown that cost reductions and performance
improvements of new technologies are often closely linked to policies aimed at increased production
and deployment (Jänicke, 2012), driven by mechanisms collectively referred to as technological
learning (Junginger et al., 2010). If successful, the increasing number of mitigation actions taken now
by developing countries holds the promise to stimulate innovations and future cost reductions there
as well. But technological learning encapsulates a diverse array of purposeful processes that some
countries, sectors and organizations manage better than others (Bell and Figueiredo, 2012; van Hoof,
2014). Besides creating financial incentives for investment, one of the key challenges for
international climate policy is therefore to actively promote technological capabilities in developing
countries and to enable countries to reap the full learning benefits from mitigation investments they
make and attract (Benioff et al., 2010; Bhasin, 2013; de Coninck et al., 2008; Ockwell and Mallett,
2012).
Technological learning in developing countries, especially outside the largest emerging economies,
follows distinct dynamics (Pueyo et al., 2011). The industries producing clean technologies are
increasingly globalized (Gallagher, 2014; Lewis, 2012; Nahm and Steinfeld, 2014). Therefore, in a
typical investment project, local firms in developing countries provide only part of the products and
services. Learning in this share of the industry value chain is local in nature and driven by local
market developments and policies – we will refer to it as local technological learning (Morrison et al.,
2008; Mytelka, 2000). However, because a substantial share of components is typically sourced from
abroad, the economics of local investments are also impacted by technological learning processes in
other countries. For example, technological progress by Chinese solar cell producers improves the
economics of solar investments around the world. This form of learning is driven more by global
markets than by policies in individual countries (Peters et al., 2012). Future investment conditions for
clean technologies in developing countries thus depend on a combination of global and local learning
processes, which, in turn, depend on domestic and international regulatory, institutional and
industrial contexts. Better understanding of the relative importance of the two can improve both
domestic and international policy decisions.
Using a quantitative case study, this paper estimates the effect of local and global technological
learning on the cost reductions of renewable electricity generation in Thailand. We employ a techno-
economic model of the country’s electricity sector to project the cost of implementing the country’s
renewable energy targets for 2021 (Kamolpanus, 2013). We derive estimates for the share of locally
3
An edited version of this paper is forthcoming in the Journal of Cleaner Production
and globally sourced goods and services for six renewable electricity technologies and analyze, in
different scenarios, the impact of local and global learning effects on the investment cost. Based on
the results, we explore implications for the design of international low carbon technology support
mechanisms.
The paper makes three main contributions. First, our case study informs the academic debate as well
as international negotiations on the post-Kyoto climate policy regime of the United Nations
Framework Convention on Climate Change (UNFCCC). In its support for technology development and
transfer, the international climate policy regime has recently shifted its attention toward national
policies and local technological learning. The analysis presented in this paper enhances the
understanding of the merits of this shift, and informs the design and functional specification of the
new international technology support mechanisms. Our quantitative approach and the focus on
mitigation cost complements existing conceptual and qualitative work on the topic (Benioff et al.,
2010; Bhasin, 2013; de Coninck et al., 2008; Ockwell and Mallett, 2012). Furthermore, it contributes
to the growing body of literature on the economics of clean energy technology investments in
developing countries (e.g., IRENA, 2012a; Schmidt et al., 2012). Finally, our paper is among the first
to investigate the impact of local and global learning separately for a specific developing country case.
The next section will introduce the key theoretical constructs used in the analysis (Section 2). Section
3 introduces the case, before section 4 presents the model, the data sources, and the methodology.
The results of the case study are presented in Section 5, and their policy implications discussed in
Section 6.
2. Local and Global Technological Learning
2.1. Technological Learning in Developing Countries
Technological learning is understood here broadly as the accumulation of technological knowledge
and experience, often also referred to as technological capabilities, in individuals and organizations
(Bell and Figueiredo, 2012). Research on innovation processes has shown that the technological
capabilities held by firms comprises not only information codified in capital goods or documents
(patents, manuals, etc.), but also includes the tacit knowledge embodied in individual skills and firm
routines (Dosi, 1988; Senker, 1995). These elements of knowledge are costly to transfer and
therefore highly organization-specific (von Hippel, 1994). This means that removing trade barriers
and providing developing countries with intellectual property rights (IPR) and resources for
technology imports is not sufficient to enable countries to catch up to the technological frontier (Bell
and Pavitt, 1996; Ockwell et al., 2010). Rather, catching up requires building local technological
capabilities through the cumulative, costly and time-consuming process of technological learning
(Bell, 2010).
Technological capabilities and learning are increasingly being recognized as significant drivers of low
carbon development (Byrne et al., 2011; Lema and Lema, 2013; Phillips et al., 2013). The
international climate negotiations, too, are taking notice (Ockwell and Mallett, 2012). Improved
technological capabilities hold the promise of removing barriers to the diffusion of clean technologies,
thereby facilitating further emission reductions in the future (Sandén and Azar, 2005). Besides its
effect on mitigation cost, the local build-up of technological capabilities is crucial for local industrial
4
An edited version of this paper is forthcoming in the Journal of Cleaner Production
capacity, poverty reduction and economic growth. For many developing countries, investing in
climate change mitigation is, for now, only desirable if the government can create opportunities for
the local private sector to participate in the value chain of mitigation investments. However, in order
to participate in the development and manufacturing of clean technologies, local firms in developing
countries need to create the capacity to continuously absorb, adapt and improve new technologies
(Bell and Pavitt, 1996).
Climate models increasingly incorporate learning as an endogenous process driven by mitigation
investments (Kahouli-Brahmi, 2008; van der Zwaan et al., 2002), but technological learning is not an
automatic by-product of investments (Bell and Figueiredo, 2012). Rather, in the analysis of the
development of mitigation policies and estimation of future mitigation cost, it is better understood
as an opportunity that can be only adequately seized when both governments and firms create the
necessary conditions. Organizations need to pursue conscious efforts to create the ability, in the
form of a skilled workforce and organizational processes, to absorb the new knowledge and
experience that they generate (Cohen and Levinthal, 1989). Furthermore, organizations innovate and
learn through their interaction with users, suppliers, competitors, universities or regulators in
systems of innovation (Fagerberg et al., 2007; Lundvall et al., 2009). The existence of formal and
informal networks, as well as public funding for science and technology, are therefore critical drivers
of technological learning. And, last but not least, learned capabilities degenerate rapidly if
organizations have a rapid workforce turnover, face an instable regulatory framework, or pursue
unsustainable business models.
2.2. Local and Global Learning Effects in Value Chains
Most clean technologies are technological systems consisting of hundreds, or even thousands, of
materials, components, and intermediate goods. Furthermore, mitigation investments involve
numerous legal, financial, and regulatory services. The collective of technology suppliers and service
providers that deliver the materials, components, products and services to deploy technologies we
call the technologies’ industry value chain.
Modern industry value chains are disintegrated and geographically distributed production and
service networks. As markets for clean technologies have grown, their supplying industries have also
globalized in recent years (e.g., Gallagher, 2014; Lewis, 2012; Nahm and Steinfeld, 2014). Globally
traded components and products are often those that can be transported at relatively low cost and
have standardized interfaces. (On the extreme end of this spectrum are commodities.) Globally
traded services often require highly specialized technological expertise that only very few firms
possess. In the wind turbine industry, for example, gearboxes, hubs, generators and bearings are
components for which the know-how necessary for design and manufacturing is concentrated in only
a few key firms globally. Further, the consulting services needed to make a complex product
bankable, or a difficult geography accessible, are often provided by experienced, globally operating
firms.
For technological learning in globally traded goods and services, global market conditions matter
more than where their products are finally deployed. If uncertainty about the product’s performance
is very large, as in the case of carbon capture and storage technology, any demonstration will add to
the global knowledge pool (de Coninck et al., 2009). In the case of smaller components, materials, or
intermediate goods, producers seldom even interact with end-users, if they know them at all. In the
5
An edited version of this paper is forthcoming in the Journal of Cleaner Production
case of services, the global applicability of their experience is the key reason why globally operating
producers are selected in the first place. The accumulation of capabilities in firms and industries is
therefore more dependent on global, aggregate market trends than on country-specific context
factors. We define learning in these goods and services as global technological learning, because, in a
simplified learning model or experience curve, it would best be predicted by the size of the global
market.
But value chains are not entirely globalized. To stimulate local private sector participation, many
climate-related laws in developing countries contain some form of provision to create a certain level
of domestic content. This gives local firms economic advantages over global suppliers. But even
without legislative requirements, often local firms provide many steps. This may include large and
heavy components that are costly to transport, or factors which are cheaper to make at home; but it
is important to note that the drivers underlying these patterns are not affected only by input or
transportation cost. The drivers for localization may include the expertise required to deal with
idiosyncratic geography, context-specific or fast-changing regulations, or local infrastructure and
climate conditions. In a wind power project, for example, towers, blades, and foundations are
typically sourced from suppliers not far from the project site, and domestic firms often provide
project development, installation, operation, and maintenance services. In developing countries, it is
reasonable to assume that local firms are mostly active in their home markets. We will therefore
assume that their learning is predominantly local, and refer to technological learning in this part of
the value chain as local technological learning.
The geographical dispersion of value chains leads to cost and cost trends that differ significantly
between components (e.g., Lindman and Söderholm, 2011). Cost trends and learning curves are
global whenever global markets exists, while for the locally sourced components trends differ
substantially between regions (e.g., Seel et al., 2014). For the latter, local economic, political, and
regulatory conditions determine whether or not investments lead to the accumulation of
technological capabilities, which in turn are essential to reduce local investment cost. To stimulate
progress in this part of the value chain, domestic and international policymakers should focus on
strengthening the domestic innovation system. For the global part of the value chain, however,
which also affects domestic investment economics, national innovation systems are not very
important. Here, policymakers need to work toward international knowledge sharing and
standardization activities to strengthen the sectoral innovation system in order to advance low-
carbon technologies (de Coninck et al., 2009). They should also strive for the global markets to
remain open and try to minimize protectionism to reap the benefits of global technological learning
(Lewis, 2014).
3. The Case of Thailand’s Electricity Sector
3.1. Case Selection
This paper presents a quantitative case study of Thailand’s Alternative Energy Development Plan
(DEDE, 2012) for the electricity sector in order to explore the relative importance of local and global
learning in developing countries’ mitigation efforts. We chose a case study of the electricity sector
because it lies at the heart of the climate change challenge as the single largest source of CO2
emissions among the primary sectors of the world economy (Bazilian et al., 2008). Indeed, the
6
An edited version of this paper is forthcoming in the Journal of Cleaner Production
majority of national mitigation policies in developing countries target energy production and
consumption in the industrial, energy supply, buildings, and transport sectors (van Tilburg et al.,
2013). At the same time, the diversity of technologies in the electricity sector and their globally
operating technology providers allows us to model both local and global learning processes.
We chose Thailand as case study for three reasons. First, the country has clear, broad and ambitious
targets for renewable energy diffusion which allow us to study the impact of different learning
conditions on the cost of an existing policy. Second, the country’s government publishes detailed
data on energy production and consumption that allow us to model the electricity sector on a single-
plant level. Third, the country faces economic and political challenges that make the framework
conditions for its energy policy decisions representative of a large number of other middle-income
countries. A country of 66.9 million with a GDP per capita at USD 5,210, Thailand has managed to
provide its population with almost universal access to electricity (The World Bank, 2014). Like many
other middle-income countries, it now faces the challenge of rapidly growing energy consumption,
accompanied by growing carbon emissions, import dependency, national security concerns and local
resistance to fossil and nuclear power plants. How to assist emerging economies in managing these
challenges while simultaneously reducing carbon emissions will be one of the most important
questions for international climate policy in the coming decades.
3.2. Trends and Challenges
Primary energy consumption in Thailand has almost tripled from 1990 to 2011, making it the second-
largest energy consumer in the Association of Southeast Asian Nations (ASEAN), while subsequently
its greenhouse gas (GHG) emissions grew by 177.5% (see Figure 1). The power sector is the largest
carbon source, with a share in national emissions that grew from 33% in 1990 to 42% in 2011. By
2035, energy consumption and GHG emissions are expected to roughly double yet again (IEA, 2013a).
Thailand is already a net importer of oil, gas and coal, and is projected to become the most energy
import-dependent country among the ASEAN by 2035, with imports estimated to increase to about
90% of consumed oil and gas (IEA, 2013a). Nakawiro et al (2008) estimate that gas and coal import
costs will grow from 0.92% of the country’s GDP in 2011 to 2.19-2.69% in 2025, depending on the
development of fuel prices in the region. The main domestic sources are not without challenges, too,
in light of strong local opposition to nuclear power and new coal plants (Greacen and Bijoor, 2007;
Pongsoi and Wongwises, 2013).1
1
The first nuclear plant was originally scheduled to come online in 2020, but was postponed to 2026 after the
nuclear incidence in Fukushima, Japan, in 2011.
7
An edited version of this paper is forthcoming in the Journal of Cleaner Production
Figure 1: Thailand’s carbon emissions by sector (a) and future projections for emissions from the country’s power sector
(b).
1
CO2 emissions from power sector do not contain imports. Data from EPPO (2013, 2012a).
As of 2011, the electricity sector is dominated by natural gas (67%), with lignite and hard coal
providing together about 20% as well (Figure 2). Besides large hydropower (5%), renewable energy
constitutes only a very small part of the electricity mix, mostly in the form of biomass (1.4%) (EPPO,
2012b). The remaining demand is covered by direct electricity imports (6.6%). Electricity generation
reached 162 TWh in 2011 and is projected to increase by more than 4% annually (EPPO, 2012b,
2012c). Besides domestic capacity investments, the government plans to meet demand by increasing
the share of direct electricity imports from neighboring Malaysia and Laos to 13% in 2030 (Figure 2).
Figure 2: Development of the fuel mix in Thailand’s power sector from 1987 to 2030.
1
The renewables wedge contains
hydropower after 2011; the share of renewables after 2012 reflects relatively conservative projections of the Power
Development Plan. Data from EPPO (2013, 2012a).
3.3. Targets and Support for Renewable Energy
In recent years, electricity sector planning initiatives have begun to consider renewable energy as a
potential remedy for some of the problems the country faces. Thailand has no official renewable
energy law at this point but several comprehensive long-term energy plans (Tongsopit and Greacen,
2013). The two most important are the Power Development Plan by the Energy Policy and Planning
250
200
150
100
50
0
201020052000199519901987
0
50
100
150
200
250
203020252015 20202011
Other Power GenerationTransportIndustry CO2-eq emissions
from power generation1
Power generationGDP
b) Projections, 2011=100
Carbon emissions in Thailand
a) Historic emissions [in million tons CO2-eq]
5%
67%
8%
Lignite 12%
Natural gas
1%
Imported
7%
Fuel oil & diesel
1%
Coal
2011 (total :162.3 TWh)
350
300
250
200
150
100
50
0
201020001990 20302020
LigniteRenewables1Imported electricity Fuel oil & diesel Coal Natural gasHydro
Estimates
Renewables
Hydro
Planned fuel mix of the electricity sector in Thailand 1987-2030
Electricity production by source, TWh
8
An edited version of this paper is forthcoming in the Journal of Cleaner Production
Office (EPPO, 2012c) and the Alternative Energy Development Plan (AEDP) by the Department of
Alternative Energy Development and Efficiency (DEDE, 2012; Kamolpanus, 2013), both under the
Ministry of Energy. The AEDP, updated in 2013, is aiming to increase the renewable energy in the
power sector to 14 GW by 2021, or 24% of the total capacity (compare with Figure 2). As shown in
Figure 3, the largest part of this capacity is projected to come from biomass (4.8 GW), followed by
biogas (3.6 GW), solar power (3 GW), wind power (1.8 GW) and micro hydro (324 MW).2
The largest
relative increase is targeted for biogas (17-fold) and wind energy (15-fold). It is notable that large
hydro is not part of the AEDP. For simplification, we therefore use the term ‘renewable electricity’ in
this paper to refer to non-large-hydro renewable electricity technologies.
Figure 3: Targets for renewable electricity under Thailand‘s Alternative Energy Development Plan (DEDE, 2012). Data for
2012 are from DEDE (2013); updated targets for 2021 from Kamolpanus (2013).
In addition to public research, tax incentives, venture capital and investment grants, the primary
government policy to induce renewable energy investments is currently a feed-in tariff premium
scheme, referred to as ‘FIT adder’ (DEDE, 2012; Tongsopit and Greacen, 2013). The FIT adder
program provides a purchase guarantee under which fixed premiums, which differ by technology,
capacity and project location, are paid on top of a base tariff that is determined by the utility’s
avoided cost. Originally implemented in 2007, the official objectives of the FIT adder policy included
enhanced levels of renewable energy generation; private sector involvement; economic growth and
rural development; diversification of the fuel mix; local pollution reduction and utilizing agricultural
wastes; as well as local equipment manufacturing and thus reduced international equipment imports
(Tongsopit and Greacen, 2013). In 2010, Thailand’s government announced plans to transform the
FIT adder into a fixed FIT, but has done it so far only for rooftop solar PV (Kamolpanus, 2013). There
is no local content requirement in Thailand’s renewable electricity support policies, but import duties
create incentives to source locally (Beerepoot et al., 2013).3
2
The targets include another 400 MW of municipal waste incineration plants.
3
These import duties were not considered in our analysis.
10243112377193 324400
1,800
3,000
3,600
MSWPVBiogasBiomass
4,800 MW
1,960 MW
+1,761%
+697%
+145%
+836%
Wind
+1,511%
Micro
Hydro
+218%
Targets for 2021Status end of 2012
2,786 MW
+400%
Total
renewables
(excluding
large hydro)
13,924 MW
Targets for renewable energy development in Thailand in 2012-2021
Electric power generation capacity by source, MW
9
An edited version of this paper is forthcoming in the Journal of Cleaner Production
3.4. Local and Global Learning in Renewable Energy in Thailand
As developed in Section 2, modern clean technology value chains feature significant local and global
value creation. To illustrate how the local and global aspects of the value chain play out in Thailand,
the value chain of a typical project in the electricity sector in Thailand is shown in Figure 4. Displayed
is a value chain of a solar PV project, including the primary value chain, from material and
component suppliers, up to the grid operator, and secondary activities such as universities,
consultancies or legal services. For one specific project, a 9.5 MW solar PV project in Mae Chan in
Chiang Rai province developed in 2013, we identified the most likely countries of origin for each
value chain step. In the depicted case the project operator, the grid operator, the construction
company, one of the two project developers, (probably) legal and financial services, and the
regulator are local, while no core hardware components were manufactured in Thailand. The
modules are manufactured by a Norwegian company in Singapore, while the inverters are made by a
Swiss-Swedish company, most likely in Estonia. The leading production equipment suppliers, material
suppliers and research institutes are located in Europe, the United States and Australia, thus it is
almost certain that all these countries/continents are also represented in the value chain. The
economics of the final project are determined by progress by all these actors in a concurrence of
local and global learning effects, which calls for policy support that strengthens learning conditions
locally and globally to facilitate overall technological progress.
Figure 4: Value chain for an exemplary solar PV project in Thailand. Country codes as defined by UN Statistics Division; EU
stands for European Union. Company identification from news sources.
Consulting, legal
advice, financial
services
Cell/Module
manufacturers
Production
equipment
Logistics and
installation services
Materials suppliers
R&D, certification &
testing services
University research
and education
EPC, project
development
Component
suppliers
Power producers,
O&M
Regulators
Grid operator
Supportive activities
Primary value chain
THA
THA
THA
THA THA
NLD
ESPCHE SWE
NOR SGP
CHE USA DEU
USA
NOR
EU
EU EUUSA
AUS USA SGP
EU
Flow of goods and services Origin of actor Origin estimated
THA
EST
Local and global value chain for a solar PV power project in Thailand
Origin of actors in value chain of Sonnedix‘s 9.5 MW project in Mae Chan, Chiang Rai
10
An edited version of this paper is forthcoming in the Journal of Cleaner Production
4. Materials and Methods
4.1. General model framework
We developed a model of Thailand’s electricity sector and used different scenarios to estimate the
effects of technological learning on the cost of achieving the Alternative Energy Development Plan
(AEDP) targets. We chose a bottom-up, techno-economic model (Berglund and Söderholm, 2006)
because it allows us to study the effects of cost dynamics on the technology-level on the aggregate
cost of renewable energy policies (Kahouli-Brahmi, 2008). To model the effects of learning on the
cost of technologies, we chose the learning curve approach because it enables us to treat local and
global effects separately (Hayward and Graham, 2013). We focused on six renewable energy
technologies under the AEDP: biomass, biogas, micro hydro, on-shore wind, solar PV, and
concentrating solar power (CSP).
Figure 5: Relationships between key input and output metrics in the techno-economic model; the upper half of the
graphic shows variables calculated on the technology-level; the lower half shows variables calculated for the entire
electricity sector/policy.
The overall structure of the model with its key variables and relationships is depicted in Figure 5.
Calculating the cost of renewable electricity is a well-established process in renewable energy policy
analysis (Burtraw et al., 2012). The cost of the avoided electricity, however, even though at least
equally important, are often neglected (Schmidt et al., 2012). To obtain the cost of avoided electricity
and the avoided greenhouse gas emissions, we compared different scenarios for diffusion of
renewable energy with a hypothetical scenario without any renewables diffusion. Based on this
comparison, the model provides two main outcome metrics, shown in dark grey in Figure 5, to assess
the policy support needed to achieve Thailand’s renewable electricity targets: the incremental policy
cost and the mitigation cost, both stated as net present value.4
The former is a proxy for marginal
4
The incremental costs and the mitigation costs are discounted to the year 2012 with the yield of 40-year Thai
government bonds, which reflects the refinancing cost of the Thai government over the period of the assumed
feed-in Tariff payments.
Technology level
Sector level
LCOE (i, t)
Cost of generation
by source (i, t)
Carbon credits
(i,t)*
Cost of avoided
generation (t)
Total cost of
generation (t)
Incremental cost of
policy (t)
Capital and O&M
cost (i, t)
Fuel Cost (i, t)
Debt & equity rates
(i)
Fossil plant pipeline
(t)
Globally installed
capacity (i, t)
Learning rates (i)
Locally installed
capacity (i, t)
Resource potential
/ full-load hours (i, t)
Tax and
depreciation rules
Carbon emissions
(t)
Fuel mix (t)
Mitigation cost of
policy (t)
Input / assumptions
Intermediate outputs
Output metrics
Model structure
Key relationships between input and output variables (function of technology i, year t)
11
An edited version of this paper is forthcoming in the Journal of Cleaner Production
social cost (Palmer and Burtraw, 2005), while the latter allows comparisons between different
mitigation measures and carbon prices.
How the scenarios deviate from the non-renewables scenario is calculated on the sectoral level. The
incremental costs represent the difference between the total cost of renewable electricity and the
total cost of avoided electricity (Schmidt et al., 2012). The mitigation costs are calculated based on
the total carbon emission reductions from the AEDP and the incremental cost:
(𝑖) 𝐼𝑛𝑐𝑟𝑒𝑚𝑒𝑛𝑡𝑎𝑙 𝑝𝑜𝑙𝑖𝑐𝑦 𝑐𝑜𝑠𝑡 = 𝐶𝑜𝑠𝑡 𝑜𝑓 𝑟𝑒𝑛𝑒𝑤𝑎𝑏𝑙𝑒 𝑒𝑙𝑒𝑐𝑡𝑟𝑖𝑐𝑖𝑡𝑦 − 𝐶𝑜𝑠𝑡 𝑜𝑓 𝑎𝑣𝑜𝑖𝑑𝑒𝑑 𝑒𝑙𝑒𝑐𝑡𝑟𝑖𝑐𝑖𝑡𝑦 [𝑖𝑛 𝑈𝑆𝐷 𝑜𝑟
𝑈𝑆𝐷
𝑀𝑊ℎ
]
(𝑖𝑖) 𝑀𝑖𝑡𝑖𝑔𝑎𝑡𝑖𝑜𝑛 𝑐𝑜𝑠𝑡 =
𝐼𝑛𝑐𝑟𝑒𝑚𝑒𝑛𝑡𝑎𝑙 𝑐𝑜𝑠𝑡
𝐴𝑣𝑜𝑖𝑑𝑒𝑑 𝑔𝑟𝑒𝑒𝑛ℎ𝑜𝑢𝑠𝑒 𝑔𝑎𝑠 𝑒𝑚𝑖𝑠𝑠𝑖𝑜𝑛𝑠
[
𝑈𝑆𝐷
𝑡𝐶𝑂 2
]
For each of the renewable and fossil technologies in the sector we calculated the cost of electricity
generation for each year of the considered period. The cost of renewable electricity and the cost of
avoided electricity were then aggregated from the technology-level calculations. The cost of
renewable electricity was aggregated over the renewable technologies under the AEDP in 2013-2021
(details in Section 4.2). The cost of avoided electricity was aggregated over the 9 main fossil
technologies from 2013, when the electricity is displaced, to 2040, when the last renewable plant
goes offline. How we calculated the avoided cost and avoided emissions is explained in detail in
Appendix A.
4.2. Cost of Renewable Electricity Generation
4.2.1. Generated Electricity
The electricity generated by each source of renewable electricity is a function of the diffusion path
and the plant utilization. Since the AEDP does not contain interim targets, we modeled the diffusion
of the six considered technologies as a linear increase in installed capacity. The split between PV and
CSP in the (undifferentiated) total solar target is assumed as a relation of 9 (PV) to 1 (CSP). All
renewable electricity is assumed to be fed into the grid (no curtailment), so the plant utilization is a
mere function of the resource potential. In the case of micro hydro, biogas and biomass, for which
significant domestic experience exists, we took the capacity values from domestic academic sources
(Delivand et al., 2011; Pattanapongchai and Limmeechokchai, 2011a; Promjiraprawat and
Limmeechokchai, 2012). For wind, solar PV and CSP we estimated the capacity factors based on
resource information from the IRENA global atlas (3Tier layer; IRENA, 2014).
4.2.2. Cost Per Unit of Generated Electricity
To model the cost of electricity, we assumed that the government supports each technology with an
inflation-adjusted, fixed feed-in tariff (FIT). A 20-year lifetime for all investments in 2013-2021
implies FIT payments in the period 2012-2040. The FIT rates for each technology are assumed to
exactly reflect, at any point in time, the technology’s levelized cost of electricity (LCOE) (Waissbein et
al., 2013):
12
An edited version of this paper is forthcoming in the Journal of Cleaner Production
𝐿𝐶𝑂𝐸𝑖,𝑡 =
𝑆𝐸 ∗ 𝐼𝑁𝑉𝑖 + ∑
𝑂𝑃𝐸𝑋𝑖,𝑡 + 𝐶𝐷𝑖,𝑡 − 𝑇𝑅 ∗ �𝑂𝑃𝐸𝑋𝑖,𝑡 + 𝐼𝐸𝑖,𝑡 + 𝐷𝑃𝑖,𝑡�
(1 + 𝑅𝑂𝐸) 𝜏
𝑇
𝜏=0
(1 − 𝑇𝑅) ∗ ∑
𝑃𝑖,𝑡 ∗ 𝐶𝐹𝑖,𝑡 ∗ 8760ℎ
(1 + 𝑅𝑂𝐸) 𝜏
𝑇
𝜏=0
An equity investor perspective was adopted by modeling the cash flows generated for every
technology on a single plant basis (Dinica, 2006). The determinants of the LCOE of a technology i in
year t are thus the share of equity (SE), the total investment cost (INV), the operational expenses
(OPEX), including operation, maintenance and fuel cost, and the cost of debt (CD), which includes the
interest expenses and capital payments of the debt-financed investment share in a fixed-rate, 10-
year loan. A fixed corporate tax rate (TR) was assumed to apply to all income minus OPEX, interest
expenses (IE) and annual depreciation (DP). The annual revenues from electricity generation are
determined from the net electric capacity (P) and the time- and technology-specific capacity factor
(CF; see below). ROE is the after-tax return on equity that an investor requires taking into account
the risk-free rate as well as political, market and technology risks in the designated location. For
system integration cost of variable renewable energy technologies (PV, CSP and wind), we
considered an additional average of 0.0115 USD/kWh to account for balancing and grid integration
cost (IEA, 2008). Table 3 and Table 6 in the appendix provide an overview over the input parameters
for renewable energy technologies and key sector-wide assumptions used in our model.
4.2.3. Local and Global Learning
The cost of renewable electricity is assumed to decrease over time as technological capabilities
accumulate in the industry (compare Section 2). In particular, the initial investment cost and the fixed
O&M cost of technology I were modeled as a function of local and global cumulative installations
(Ylocal and Yglobal), learning rates and diffusion over time:
(𝑖𝑖𝑖) 𝐼𝑁𝑉𝑖,𝑡 = 𝛼𝑖,𝑙𝑜𝑐𝑎𝑙 ∗ 𝐼𝑁𝑉𝑖,𝑡−1 ∗ �
𝑌𝑖,𝑙𝑜𝑐𝑎𝑙,𝑡−1
𝑌𝑖,𝑙𝑜𝑐𝑎𝑙,𝑡−2
�
𝑙𝑛(1−𝐿𝑅𝑖,𝑙𝑜𝑐𝑎𝑙)
ln 2
+ 𝛼𝑖,𝑔𝑙𝑜𝑏𝑎𝑙 ∗ 𝐼𝑁𝑉𝑖,𝑡−1 ∗ �
𝑌𝑖,𝑔𝑙𝑜𝑏𝑎𝑙,𝑡−1
𝑌𝑖,𝑔𝑙𝑜𝑏𝑎𝑙,𝑡−2
�
𝑙𝑛(1−𝐿𝑅𝑖,𝑔𝑙𝑜𝑏𝑎𝑙)
ln 2
[
𝑈𝑆𝐷
𝑘𝑊
]
(𝑖𝑣) 𝑂&𝑀 𝑐𝑜𝑠𝑡𝑖,𝑡 = 𝛽𝑖 ∗ 𝐼𝑁𝑉𝑖,𝑡 [
𝑈𝑆𝐷
𝑘𝑊ℎ
]
To separate the effects of local and global technological learning, we split up the investment cost into
locally and globally sourced components (αi,local and αi,global). The learning rate LR, too, is
differentiated for local and global learning (LR,local and LR,global) (Hayward and Graham, 2013).
The cost structures of different renewable technologies were taken from the literature (sources
listed in Table 1). The estimates for the share and type of locally sourced components are based on a
survey of news reports on renewable energy projects implemented in Thailand and interviews with
local renewable energy investors. In the news report analysis, we coded the companies and main
components involved renewable projects in Thailand (such as the Mae Chan PV project shown in
Figure 4) according to the type of service or component they provided and the location of business
(domestic / international)5
. The interviews were used to verify the findings about the general
patterns of locally sourced components. The information on typical sourcing strategies was then
linked to the technology-specific cost structure data to obtain estimates of local and foreign cost
shares, to which we applied local and global learning rates obtained from the literature (see Table 1).
5
We considered local manufacturing as local sourcing, even when it is the result of foreign direct investment.
13
An edited version of this paper is forthcoming in the Journal of Cleaner Production
In the initial specification, our model used high but realistic estimates for the local share, as
presented in Table 1. For all six considered renewable technologies, we assumed that grid connection,
EPC (engineering, procurement and construction) and heavy, bulky components are sourced locally,
while the core of the electro-mechanical conversion system is sourced globally. This rule leads to
very different local shares: from 43% in the case of PV up to 87% for micro hydro. To assess the
sensitivity to these assumptions, a second set of model specifications (see section 4.3) uses more
pessimistic estimates for local private sector participation (values given in Table 5 in the appendix). A
third set of model specifications assumes a cost markup of 20% for all local components in wind,
solar PV and CSP, which are relatively new technologies in Thailand.
Table 1: Split between locally and globally sourced components by technology
Technology Locally sourced parts Globally sourced parts
Cost split
local/global
Learning rate
local/global)
Wind
Grid connection; engineering; procurement
& construction; foundation; rotor blades;
tower
Nacelle (including electrical
machinery, power electronics &
control system)
67%/33%a
11.3/4.3e
PV
Grid connection; engineering; procurement
& construction; balance of system excluding
inverter
PV modules; inverter 43%/57%b
17/20e
CSP
(solar tower)f
Grid connection; engineering; procurement
& construction; solar field
Power block; heat transfer fluid
cycle
67%/33%b
14.6/14.6e
Biomass
(anaerobic
digestion)f
Grid connection; engineering, procurement
& construction; fuel shredder; boiler; heat
exchanger; piping
Steam turbine and electric
generator (prime mover); flue
gas and water treatment
75%/25%c
5/5d
Biogas
Grid connection; engineering, procurement
& construction; fuel handling; balance of
system; 75% of converter system
Gas engine (prime mover); 25%
of converter system
78%/22%d
5/5d
Micro hydro
Grid connection; engineering, procurement
& construction; 50% of electro-mechanical
equipment
50% of electro-mechanical
equipment
87%/13%c
5/5d
a
IRENA (2012b); b
NREL (2012); c
Delivand et al. (2011); d
Mott McDonald (2011); e
Hayward & Graham (2013); f
For both CSP and biomass a
range of technological options exists, of which we chose one each to simplify the model; we chose anaerobic digestion because it is the
dominant technology in Thailand (JIE, 2008), and solar tower because it represents 43% of the global near-term project pipeline (Hering,
2012).
4.3. Model Specification and Scenarios
Different model specifications were created to evaluate the learning effects, to gauge the impact of
key assumptions, and to compare learning effects to other policy priority areas (see Table 2). Models
A-L were specified to investigate the impacts of local and global learning. The first four, A-D, assume
the local shares estimated in Table 1 and only differ by the learning rates. Model A assumes no
learning at all (learning rates set to zero) and serves as base-case scenario, while model B and C
estimate the separate effects of local and global learning, respectively, and model D estimates the
full joint effect of local and global learning. Models E, F, G and H follow the specifications of models
A-D, but use a more conservative estimate of the share of local components (values are given in
Table 5 in the Appendix). The models I, J, K and L, too, mirror models A-D, but account for the
uncertainty about the initial cost of locally produced components by assuming a markup of 20%6
on
all local components in wind, solar PV and concentrating solar power. Finally, model GL assumes that
no components are locally sourced and global learning opportunities are fully exploited.
6
The mark-up of 20% is within the range of mark-ups implicitly assumed in policies such as Turkey’s Renewable
Energy Law 2010 (IEA and IRENA, 2013).
14
An edited version of this paper is forthcoming in the Journal of Cleaner Production
The last two models, CARBON and FINANCE, were specified to allow a comparison of the magnitude
of learning effects to those of other suggested policy priority areas for international support. In
model CARBON, we assumed a global carbon price of USD 15 to reflect a reinvigorated global carbon
market from which renewables projects can raise additional financing. Model FINANCE assumes that
both debt and equity cost are reduced by one percentage point to estimate the impact of improving
financing conditions through policies that reduce investor risks.
Table 2: Model description and specification; all models assume local diffusion of renewable technologies according to
AEDP targets and global diffusion according to predictions in IEA (2013b)
a
.
Model Description Implementation Purpose
A or base-
case
AEDP targets implemented, but
neither local nor global diffusion
leads to learning
Learning rates LRlocal and LRglobal set to 0 Estimate cost without learning
B Same as A, but local industry
realizes learning opportunities
from diffusion
LRlocal >0; LRglobal =0 Estimate effects of local learning
C Same as A, but global industry
realizes learning opportunities
from diffusion
LRlocal =0; LRglobal >0 Estimate effects of global learning
D Same as A, both local and global
industries realize learning
opportunities from diffusion
LRlocal and LRglobal>0 Estimate full effects of learning
E, F, G, H Same as A-D, but lower share of
local components
Reduced local share; values in Table 5 in the
Appendix
Estimate sensitivity to share of
local cost; account for variance
between projects
I, J, K, L Same as A-D, but cost markup for
local components technologies
that are new to Thailand
20% cost markup for local components in wind,
PV, CSP
Estimate sensitivity to initial local
component cost; account for
uncertainty about initial cost
GL Same as C, but no local content No local content; LRglobal >0 Evaluate value of local
component sourcing
CARBON Same as A, but renewables projects
benefit from carbon credit sales
LRlocal =0; LRglobal =0; carbon price USD 15 for 10
years; credits generated according to
methodology of Clean Development Mechanism
Compare learning effects to
impact of a functioning global
carbon market
FINANCE Same as A, but renewables projects
benefit reduced financing cost
LRlocal =0; LRglobal =0; the investor’s expected rate
of return and the lending rate for renewables are
reduced by 1%-point
Compare learning effects to
impact of derisking activities
a
Local installation data for 2012 from DEDE (2013); global installations in 2011 for solar, CSP and wind from IEA (2013b); for biomass and
biogas from IRENA (2012c); and for micro hydro from IRENA (2012d).
5. Results
5.1. Impact on the Electricity Mix
Our model predicts that, if the AEDP targets are achieved, Thailand will increase its share of non-
large-hydro renewables in the electricity sector from 6 to 24%, as shown in Figure 6. Biomass (47%)
and biogas (36%) are responsible for most of this increase, given their high capacity increases and
high plant utilization. Solar PV and wind contribute 8% and 7%, respectively, while CSP and micro
hydro each produce 1%.
Increasing by a total of over 11 GW, the diffusion of renewable energy reduces the pressure to install
new conventional power plants. The construction of some coal power plants will be delayed – the
capacity in 2021 is 800 MW lower with the AEDP targets implemented – but the most significant
effect is on natural gas. In 2021, the installed capacity is 3,600 MW lower than in the case without
additional renewable capacity; this leads to a drop of natural gas in the fuel mix from 59 to 46% (see
Figure 6b). If all construction delays caused by the diffusion of renewables in the modeled period
15
An edited version of this paper is forthcoming in the Journal of Cleaner Production
2013-2040 are aggregated and stated in MW-years (MWa), natural gas power plants are delayed by
62,250 MWa; coal power plants by 8,850 MWa; nuclear by 8,000 MWa and diesel plants by 1,250
MWa. In terms of displaced electricity, too, natural gas is affected most (654 TWh in 2013-2040),
followed by coal (145 TWh), nuclear (90 TWh), lignite (61 TWh) and diesel (5 TWh). In total, our
model estimates that the AEDP targets avoid a total of 956 TWh of conventional electricity and 455.7
million tons of CO2.
Figure 6: Impact of the AEDP targets on the fuel mix in the electricity sector in 2021
5.2. Incremental Policy Cost and Effects of Learning
Since we are assuming fixed feed-in tariff payments over a 20-year lifetime for each installation, the
cost of the increase in renewable electricity is spread over the period 2013-2040. The annual
payments increase linearly with the capacity additions in 2013-2021 to a maximum of almost USD
5bn per year, staying flat until the first added plants retire in 2032 and then dropping to zero (as
shown in Figure 7). The savings from avoided conventional electricity production follow a similar path,
with small variations between years caused by the delay of large fossil plants.
6%
59%
Other
0%
Renewables
Hydro
3%
Imported
13%
Coal
12%
Lignite
6%
Natural gas
2021: Fuel mix for base case
(total: 255.6 TWh)
2021: Fuel mix with AEDP targets
(total: 255.6 TWh)
a) b)
24%
46%
3%
Imported
13%
Coal
8%Lignite
6%
Other
0%
Hydro
2021: Fuel mix within renewables share
(total: 62.0 TWh)
c)
47%
8%
Biogas
36%
Biomass
Micro hydro
1%
Wind
7%
CSP
1%
Solar PV
Renewables
Fuel mix in 2021 with and without AEDP targets
Electricity production by source, TWh
16
An edited version of this paper is forthcoming in the Journal of Cleaner Production
Figure 7: Payments for renewable electricity under the AEDP and avoided fossil electricity over time
The total cost of reaching the AEDP targets as well as the model’s two main outcome metrics, the
(discounted) incremental policy cost and the carbon mitigation cost, are depicted in Figure 8 for the
different learning scenarios. For the base case, the FIT payments supporting the renewable energy
installations add up to a total of USD $74.75bn in 2013-2040, while the cost of the avoided
conventional electricity reach an aggregate of $61.43bn over the same period. The remaining,
incremental policy cost is thus $13.3bn, which corresponds to a mitigation cost of $29.2 per ton of
CO2.7
By exploiting the local and global learning effects, this incremental policy cost can be reduced
significantly. If both learning effects are fully exploited in the standard specification of the model
(model D), the incremental policy cost drops by about 80% to $2.6bn. If most components are
sourced globally (model H), the effect is less strong, but the cost is still reduced by $8.8bn (66%) to
$4.5bn. Through learning, the incremental cost falls below the original base-case cost to $4bn, even if
initial cost is assumed to include a 20% markup for local components. The models CARBON and
FINANCE, not shown in Figure 8, help put the learning effects in perspective: A $15 carbon price
would reduce incremental cost from $13.3bn to $7.52bn, while a reduction of one percentage point
in the weighted cost of capital would reduce it to $9.88bn.
Across all models, the effect of local learning outweighs that of global learning. Figure 8 shows the
results for incremental and mitigation cost of all 12 different learning scenarios. If a high share of
local sourcing is assumed (models B-D), local learning can reduce the incremental cost by $6.7bn,
while global learning can further decrease them by $3bn. This strong effect of local learning is robust
across all considered model specifications. In the models that assume a low local component share
(E-H), local and global learning reduces the incremental cost by 36% and 31%, or $4.7bn and $4.1bn,
respectively. When a mark-up of 20% is considered (models I-L), local learning shaves 47% ($8.5bn)
off the incremental cost, while local learning reduces them by 19% ($3bn).
7
If distributed as a surcharge on the electricity bill, these incremental cost would peak at about c$0.3 per kWh
in 2020, or about 3% of the average retail electricity price (Ruangrong, 2012).
5
4
3
2
1
0
-2
-3
-4
-5
204020352030202520202015
Incremental costCost of FIT payments Avoided cost
Cost of AEDP targets over time
Total payments for FIT and total avoided cost [in billion USD2012, discounted]
17
An edited version of this paper is forthcoming in the Journal of Cleaner Production
Figure 8: Total cost of supporting the AEDP targets in 2021 in different learning scenarios
Another important finding is that strong local private sector participation, represented in the models
by a high share of local components, can reduce mitigation cost beyond the reductions possible
under a purely global value chain. This can be seen when comparing model GL with models D, H and
L – the incremental cost in all three models are significantly lower than in GL. Indeed, the effect of
local learning alone exceeds the total learning effect in GL in all but model F, the model with a low
share of local content.
5.2.1. Differences Between Technologies
The effects seen on the global level are more nuanced when looking at the effects by technology.
Figure 9 shows the LCOE of all technologies in 2021 for different scenarios. It can be seen that,
overall, the learning effect is strongest for CSP (-54%) and PV (-43%) and weakest for micro hydro (-
8%) and biomass (-3%). Similar differences are visible for the relative importance of local and global
learning. The effect of local learning is much stronger for CSP, with 41% and 13% reduction,
respectively, whereas global learning is more relevant for PV (25% compared to 18%). Local learning
also outweighs global learning for wind, biogas and micro hydro. However, in biomass, both are not
very significant.
Cost of AEDP targets in different models
a) Total feed-in tariff payments for renewable electricity 2013-2040 [in billion USD 2012, discounted]
0
20
40
60
80
100
Avoided cost
USD 61.43bn
Avoided
cost
GLLKJIHGFEDCBA
High share of
local content
4.0
15.6
4.5
9.210.3
5.6
0
5
10
15
20
IHGF
8.6
E
13.3
D
2.6
CBA
13.3
GL
6.9
LK
12.6
J
7.1
8.99.8
20.218.9
29.229.2
0
10
20
30
40
GL
15.2
LK
27.6
J
15.5
IHGFED
5.6
C
22.5
B
12.3
A
Low share of
local content
20% markup for
local content
No local
content
No learning Local learning Global learning Local and global learning
b) Incremental cost [in billion USD2012 ]
c) Mitigation cost [in USD2012 per ton of CO2-eq ]
34.2
18
An edited version of this paper is forthcoming in the Journal of Cleaner Production
Figure 9: Effect of technological learning on the levelized cost of different renewable energy technologies in 2021. *The
presented cost for fossil fuel electricity represents marginal cost of newly built power plants; the fuel cost reflect import
prices of coal, diesel and natural gas (see Table 4 in the attachment).
6. Discussion
6.1. How to Tap Local Learning Potentials?
The climate policy regime that emerges for the post-2020 period foresees that developing countries
will pursue domestic policies that deliver on both climate and development objectives. In the view of
national governments, local private sector participation in the value chains of low carbon
investments holds the promise of creating employment and growth opportunities. At the same time,
as our model results suggest, it can help to reduce the long-term cost of emissions mitigation. The
process linking these two objectives is local technological learning. Our calculations imply that local
learning can reduce the cost of renewable electricity to the point where they are very close to
competitiveness with fossil fuels. But how can developing countries realize the learning opportunities
that our model predicts are possible? And how can the international institutional framework assist
developing countries in this agenda?
Our case study of Thailand’s electricity sector highlights that the cost reduction opportunities from
local learning depend on three interlinked factors: the (cumulative) local installations at the
beginning of the analyzed period, which can be understood as proxy for the maturity of the domestic
industry; the average share of locally sourced components; and the rate of local learning in the
different technologies.
First and foremost, the potential for future cost reductions from technological learning is determined
by the (cumulative) size of the existing domestic market. The projected learning potentials in our
model are highest for technologies that are new to Thailand, such as solar PV and CSP, while mature
industries, such as biomass, exhibit limited opportunities to radically alter the cost structure of future
investments.
0
5
10
15
20
25
30
35
IGCClignite
Nuclear
Gasturbine
CCGTgas
IGCC
Subcriticalcoal
Subcriticallignite
Supercriticalcoal
Wind Solar PV CSP Biomass Biogas Micro hydro
No learning (model A) Local learning (B) Global learning (C) Local and global learning (D)
Marginal cost of
displaced electricity*
Levelized cost of renewable electricity in 2021 in different models
LCOE for [in cUSD2012 per kWh]
19
An edited version of this paper is forthcoming in the Journal of Cleaner Production
The share of local components, the second factor, depends crucially on the availability of local
components, which in turn depends on the amount of prior local investment in building up
production capacity by firms along the industry chain. Any such investment will hinge on a credible,
long-term market perspective (Pueyo et al., 2011). But besides their availability, the share of locally
sourced components also depends on their competitiveness. Research has presented ample evidence
that the competitiveness of local firms is the result not only of factor cost, or hardware imports, but
also their stock of technological capabilities (Bell and Figueiredo, 2012). Without the necessary
capabilities – i.e., if the initial markup is too high – local firms might never be able to enter the
virtuous cycle of learning and new investments. Even if the investment comes from foreign firms, it
will require complementary local capabilities to be “absorbed” effectively (Bell, 2010). Local
technological capabilities depend on domestic private and public investments, in the form of a skilled
workforce, local science and technology infrastructure, as well as firm networks and coordinating
actors. International factors, such as the conditions for access to state-of-the-art technology, also
play an important role for the local private sector to produce competitive products and services.
Lastly, the third and most important factor in our model that determines the potential for learning to
reduce cost compared to the base case is the rate of learning. If the learning opportunities are not
seized, a large share of locally sourced components does not yield any benefit in terms of mitigation
cost. Indeed, if there is a positive markup, it might actually be counterproductive, at least from a cost
perspective. The extent to which industries can reap the benefits of learning is determined by the
opportunities to create new knowledge from experience, but also by the processes that govern the
dissemination, utilization and retention of the created knowledge (Bell and Albu, 1999). These
processes can be shaped and enhanced by domestic governments and international support
mechanisms.
6.2. Implications for Domestic Policy
Our results suggest that the governments of developing countries should pursue any investments in
low carbon infrastructure with the explicit target of seizing the opportunity to build up local
technological capabilities. First and foremost, whether low carbon investments can promote learning
is determined by the nature of the policies that attract this investment. Experience in developed
countries has shown that technological capabilities can best be created under stable and predictable
market conditions (IRENA, 2013). Developing countries can create such conditions domestically
through long-term targets and stable regulatory frameworks, as well as a clear allocation of
responsibilities in the public sector. Options to promote industry-wide learning through efforts
targeted at the dissemination, utilization and retention of created knowledge include investments in
collaborative research programs that accompany and monitor infrastructure technology; public
institutions for testing and certifying technology; requirements for beneficiaries of government
support to publish non-sensitive information on cost and performance of the technologies; and the
creation of government-led platforms for knowledge exchange.
Apart from the need for efforts targeted at learning, the case study also suggests that policies to
subsidize early local private sector participation can be a good investment. By lowering entry barriers
in the beginning, public support can create conditions that enable learning, which, in the long term,
lowers overall cost beyond what would have been possible with purely foreign suppliers. But such a
policy needs to be designed with a clear target and procedure to review and eventually phase out
support. Furthermore, direct subsidies for local sourcing of specific components carry the risk of
20
An edited version of this paper is forthcoming in the Journal of Cleaner Production
wasting public resources on subsidizing the production of components that are too costly, or too
complex, to yield any local learning effects. Nevertheless, if they are focused on technologies and
components for which technical expertise is available (or attainable), and if they are linked to efforts
to build technological capabilities, our model suggests that local content policies can deliver on both
development and cost reduction objectives (see also Johnson, 2013).
6.3. Implications for International Technology Support Mechanisms
In its support for technology development and transfer, the international climate policy regime has
recently shifted attention from global agreements toward country-specific support, and from the
transfer of hardware to the build-up of local technological capabilities. Most notably, the Technology
Mechanism (TM) was created under the UNFCCC in 2011 to determine “technology needs […] based
on national circumstances and priorities”, and to “accelerate action consistent with international
obligations, at different stages of the technology cycle, including research and development,
demonstration, deployment, diffusion and transfer of technology in support of action on mitigation
and adaptation” (UNFCCC, 2011, p. 18-19). By emphasizing local and global aspects of technology
development, innovation, and knowledge networks, the TM’s functions clearly go beyond the ‘one-
size-fits-all’ approach of the mechanisms under the Kyoto Protocol, but also beyond the purely
country-centered practice of technology needs assessments supported by the United Nations.
However, given the range of initiatives that institutions such as the TM could potentially support
means that there is a need for analysis to inform the design and priority setting of these institutions.
The analysis presented in this paper provides implications for the allocation of resources between
global and local support.
Our results suggest technology characteristics, such as novelty and the share of simple, heavy and
country-specific components, determine the relevance of local learning in concert with country
characteristics, such as the existence of domestic industry in similar sectors and the size of the
already existing market for the considered technology. These case-specific differences suggest that
the TM should ideally integrate global and local perspectives. In cases where local learning is crucial,
the TM should assist countries by strengthening the local innovation system, e.g., by identifying
technology needs and priorities; by supporting the design of policies and regulations; by providing
training and capacity building; through efforts to provide developing countries with access to IPR; or
through the creation of local actor networks. In cases where global learning is very important, the TM
should strengthen the global, sectoral innovation systems through the creation of global technology
roadmaps; the promotion of global technology standards; the coordination of policies across
countries and regions; the creation of global, technology-centered networks; or the coordination of
institutional linkages between the TM and other global and regional institutions (such as the World
Trade Organization, the Green Climate Fund, or the Global Environmental Facility). Overall, our case
study suggests that the recent emphasis on local capabilities is promising. However, since resources
are necessarily limited, the TM should pursue these different activities with priorities reflecting
country characteristics and technology-specific value chain structures.
6.4. Limitations
A quantitative case study such as the one presented in this paper has a number of inherent
limitations that constrain the validity and applicability of our findings. We see three main factors that
need to be highlighted here. First, we are not aware of any other attempt to differentiate local and
21
An edited version of this paper is forthcoming in the Journal of Cleaner Production
global learning in a techno-economic model for a developing country. Our projections for the
potential of local learning are therefore limited by the availability of empirically grounded, cross-
industry estimates for local component shares, cost mark-ups and local learning rates.8
To obtain
more accurate estimates than those presented here, further research is needed to better understand
the cost structure and cost dynamics of renewable energy projects in developing countries. A second
limitation concerns the model’s output metrics. Government decisions should be made based on
cost-benefit calculations. Our paper provided only estimates for possible cost reductions – the
benefits side – while neglecting the cost of policies to realize and support local learning processes.
Public research programs, testing and certification institutions, and international support for policy
design and capacity building all come at a cost. In order to provide estimates for the leverage of
these public investments, i.e., how many cost reductions can be realized at what cost, further data
and analysis is necessary. This is particularly important when comparing different policy options.
Lastly, by modeling technological capabilities as production cost, and modeling technological learning
as cost reductions through a logarithmic function of only installations, our model grossly simplified
what is, in reality, a set of extremely complex and distributed processes with multiple qualitative and
quantitative dimensions. It can thus only function as a small piece in the broader set of analyses on
technological learning that aims to support the design of domestic and international climate policy.
7. Conclusion
This paper presented a case study of Thailand’s electricity sector in order to estimate the effects of
local and global technological learning on the cost of renewable energy technologies in developing
countries. Our model results suggest (i) that technological learning can, in the near future, reduce the
cost of renewable electricity in emerging economies to a level that is close to competitiveness with
fossil fuels; (ii) the major potential for cost reductions through learning lies in the build-up of local
technological capabilities; and (iii) the relative importance of local and global learning, while clear in
aggregate terms, differs significantly between technologies. This finding lends quantitative support to
the argument that the conditions enabling local learning, such as a skilled workforce, a stable
regulatory framework, and the establishment of sustainable business models, have a more significant
impact on the cost of renewable energy in developing countries than global technology learning
curves. The recent shift of international support under the UNFCCC toward the strengthening of local
innovation systems is therefore promising. However, our results also suggests that international
support must not disregard the global innovation system perspective in order to reap the full
benefits of technological learning across the wide range of clean technologies. These insights are
particularly relevant for the ongoing design and functional specification of mechanisms for
technology support under the post-Kyoto climate policy regime of the UNFCCC. Here, our
quantitative approach and the focus on mitigation cost complements existing qualitative and
conceptual work on the topic. Further qualitative research should explore in more detail the
economics of renewable energy projects in developing countries, and the effectiveness of different
policy options to promote technological learning in and across the developed world. Additional
quantitative research should investigate the leverage of different policy options, in particular the
relative merit of options targeted at learning, de-risking and global pricing of carbon emissions.
8
For example, we were only able to obtain differentiated estimates for local and global learning rates for wind
and solar PV, and for both cases the numbers are from developed country analyses.
22
An edited version of this paper is forthcoming in the Journal of Cleaner Production
Acknowledgements
The authors would like to thank the participants of the workshop on “Governance Architecture
towards Low-Carbon Society: Technology and Actor Configuration” at the United Nations University
in Yokohama and the “Sustainability Innovation Seminar” at the University of Tokyo, as well as Volker
Hoffmann, Fabien Richard, Ingo Puhl, Pimkarn Kattiyavong, Suzanne Greene, Tillmann Lang, Joern
Hoppmann, Kavita Surana and two anonymous reviewers for their valuable inputs. All errors remain
our own.
23
An edited version of this paper is forthcoming in the Journal of Cleaner Production
References
Bazilian, M., Coninck, H. De, Radka, M., 2008. Considering technology within the UN climate change
negotiations. Energy Centre of The Netherlands (ECN), Amsterdam, The Netherlands.
Beerepoot, M., Laosiripojana, N., Sujjakulnukij, B., Tippichai, A., Kamsamrong, J., 2013. Incentives for
Renewable Energy in Southeast Asia: Case study of Thailand. The International Institute for
Sustainable Development (IISD), Winnipeg, Canada.
Bell, M., 2010. Innovation Capabilities and Directions of Development. STEPS Centre Working Paper
33, Brighton, UK.
Bell, M., Albu, M., 1999. Knowledge Systems and Technological Dynamism in Industrial Clusters in
Developing Countries. World Dev. 27, 1715–1734.
Bell, M., Figueiredo, P., 2012. Innovation capability building and learning mechanisms in latecomer
firms: recent empirical contributions and implications for research. Can. J. Dev. 37–41.
Bell, M., Pavitt, K., 1996. The Development of Technological Capabilities, in: Haque, I., Bell, M.,
Dahlman, C., Lall, S., Pavitt, K. (Eds.), Trade, Technology, and International Competitiveness. The
World Bank, Washington, DC.
Benioff, R., de Coninck, H., Dhar, S., Hansen, U., McLaren, J., Painuly, J., 2010. Strengthening Clean
Energy Technology Cooperation under the UNFCCC: Steps toward Implementation. National
Renewable Energy Laboratory (NREL), NREL/TP-6A0-48596, Boulder, Colorado.
Berglund, C., Söderholm, P., 2006. Modeling technical change in energy system analysis: analyzing
the introduction of learning-by-doing in bottom-up energy models. Energy Policy 34, 1344–
1356.
Bhasin, S., 2013. International Technology Cooperation: Lessons for the Upcoming Technology
Mechanism of the United Nations Framework Convention on Climate Change. German
Development Institute (DIE), Bonn, Germany.
Burtraw, D., Krupnick, A., Sampson, G., 2012. The True Cost of Electric Power An Inventory of
Methodologies to Support Future Decisionmaking in Comparing the Cost and Competitiveness
of Electricity Generation Technologies. Resources for the Future (RFF), Washington, DC.
Byrne, R., Smith, A., Watson, J., Ockwell, D., 2011. Energy pathways in low-carbon development:
From technology transfer to socio-technical transformation. STEPS Centre Working Paper 46,
STEPS Centre and Sussex Energy Group, SPRU, University of Sussex, Brighton, UK.
Cohen, W.M., Levinthal, D.A., 1989. Innovation and learning: the two faces of R&D. Econ. J. 99, 569–
596.
De Coninck, H., Fischer, C., Newell, R.G., Ueno, T., 2008. International technology-oriented
agreements to address climate change. Energy Policy 36, 335–356.
De Coninck, H., Stephens, J.C., Metz, B., 2009. Global learning on carbon capture and storage: A call
for strong international cooperation on CCS demonstration. Energy Policy 37, 2161–2165.
24
An edited version of this paper is forthcoming in the Journal of Cleaner Production
DEDE, 2012. The Renewable and Alternative Energy Development Plan for 25 Percent in 10 Years
(AEDP 2012-2021).
DEDE, 2013. Energy in Thailand: Facts and Figures 2012. Ministry of Energy - Department of
Alternative Energy Development and Efficiency (DEDE), Bangkok, Thailand.
Delivand, M.K., Barz, M., Gheewala, S.H., Sajjakulnukit, B., 2011. Economic feasibility assessment of
rice straw utilization for electricity generating through combustion in Thailand. Appl. Energy 88,
3651–3658.
Dinica, V., 2006. Support systems for the diffusion of renewable energy technologies—an investor
perspective. Energy Policy 34, 461–480.
DOE/EIA, 2013. Electricity Market Module of the National Energy Modeling System. US Department
of Energy (DOE) and Energy Information Adminstration (EIA), Washington, DC.
Dosi, G., 1988. Sources, procedures, and microeconomic effects of innovation. J. Econ. Lit. 26, 1120–
1171.
EPPO, 2012a. Summary of Thailand Power Development Plan 2012-2030 (Revision 3). Ministry of
Energy - Energy Policy and Planning Office (EPPO), Bangkok, Thailand.
EPPO, 2012b. Energy Database Statistics, Available at:
http://www.eppo.go.th/info/5electricity_stat.htm [Accessed August 30, 2012]. Ministry of
Energy - Energy Policy and Planning Office (EPPO), Bangkok, Thailand.
EPPO, 2012c. Power Development Plan 2010, Revision 3 (June 2012). Ministry of Energy - Energy
Policy and Planning Office (EPPO), Bangkok, Thailand.
EPPO, 2012d. Thailand’s Automatic Tariff Adjustment Formula. Ministry of Energy - Energy Policy and
Planning Office (EPPO), Bangkok, Thailand.
EPPO, 2013. Energy Statistics of Thailand 2012. Ministry of Energy - Energy Policy and Planning Office
(EPPO), Bangkok, Thailand.
Fagerberg, J., Srholec, M., Knell, M., 2007. The Competitiveness of Nations: Why Some Countries
Prosper While Others Fall Behind. World Dev. 35, 1595–1620.
Gallagher, K.S., 2014. The Globalization of Clean Energy Technology. MIT Press, Cambridge, MA.
Greacen, C., Bijoor, S., 2007. Decentralized energy in Thailand: An emerging light. World Rivers Rev. 6,
4–5.
Hayward, J.A., Graham, P.W., 2013. A global and local endogenous experience curve model for
projecting future uptake and cost of electricity generation technologies. Energy Econ. 40, 537–
548.
Hering, G., 2012. Losing steam? Phot. Int. 15, 74–87.
IEA, 2008. World Energy Outlook 2008, Electronics and Power. International Energy Agency (IEA) /
Organisation for Economic Cooperation and Development (OECD), Paris, France.
25
An edited version of this paper is forthcoming in the Journal of Cleaner Production
IEA, 2013a. Southeast Asia Energy Outlook. International Energy Agency (IEA) / Organisation for
Economic Cooperation and Development (OECD), Paris, France.
IEA, 2013b. Renewable Energy - Medium-Term Market Report 2013. International Energy Agency (IEA)
/ Organisation for Economic Cooperation and Development (OECD), Paris, France.
IEA, 2013c. World Energy Outlook 2013. International Energy Agency (IEA) / Organisation for
Economic Cooperation and Development (OECD), Paris, France.
IEA, IRENA, 2013. Global Renewable Energy Policies and Measures Database, availabe at
http://www.iea.org/policiesandmeasures/renewableenergy/. available at
http://www.iea.org/policiesandmeasures/renewableenergy/.
IPCC, 2012. Special Report of the Intergovernmental Panel on Climate Change on Renewable Energy
Sources and Climate Change Mitigation. Cambridge University Press, Cambridge, UK.
IRENA, 2012a. Renewable Power Generation Costs in 2012: An Overview. International Renewable
Energy Agency (IRENA), Abu Dhabi, UAE.
IRENA, 2012b. Wind Power, Renewable Energy Technologies: Cost Analysis Series. International
Renewable Energy Agency (IRENA) - Renewable Energy Technologies: Cost Analysis Series 5/5,
Abu Dhabi, UAE.
IRENA, 2012c. Biomass for Power Generation, Renewable Energy Technologies: Cost Analysis Series.
International Renewable Energy Agency (IRENA) - Renewable Energy Technologies: Cost
Analysis Series 2/5, Abu Dhabi, UAE.
IRENA, 2012d. Hydropower. International Renewable Energy Agency (IRENA) - Renewable Energy
Technologies: Cost Analysis Series 3/5, Abu Dhabi.
IRENA, 2012e. Renewable Energy Technologies: Cost Analysis Wind Power. International Renewable
Energy Agency (IRENA), Abu Dhabi, UAE.
IRENA, 2013. 30 Years of Policies for Wind Energy. International Renewable Energy Agency (IRENA),
Abu Dhabi, UAE.
IRENA, 2014. Global Atlas. International Renewable Energy Agency (IRENA), Abu Dhabi, UAE.
Jänicke, M., 2012. Dynamic governance of clean-energy markets: how technical innovation could
accelerate climate policies. J. Clean. Prod. 1, 50–59.
JIE, 2008. The Asian Biomass Handbook. The Japan Institute of Energy (JIE), Tokyo, Japan.
Johnson, O., 2013. Exploring the Effectiveness of Local Content Requirements in Promoting Solar PV
Manufacturing in India. German Development Institute (DIE), Bonn, Germany.
Junginger, H.M., Sark, W., Faaij, A., 2010. Technological Learning in the Energy Sector: Lessons for
Policy, Industry and Science. Edward Elgar, Cheltenham, UK.
Kahouli-Brahmi, S., 2008. Technological learning in energy-environment-economy modelling: A
survey. Energy Policy 36, 138–162.
26
An edited version of this paper is forthcoming in the Journal of Cleaner Production
Kamolpanus, S., 2013. Thailand’s Renewable Power - Current Status, Challenges, and Future Trend.
AORC-CIGRE Tech. Meet. Sept. 3rd, 2013, Guangzhou China.
Kanie, N., Nishimoto, H., Hijioka, Y., Kameyama, Y., 2010. Allocation and architecture in climate
governance beyond Kyoto: lessons from interdisciplinary research on target setting. Int. Environ.
Agreements Polit. Law Econ. 10, 299–315.
Lema, A., Lema, R., 2013. Technology transfer in the clean development mechanism: Insights from
wind power. Glob. Environ. Chang. 1, 301–313.
Lewis, J., 2012. Green innovation in China: China’s wind power industry and the global transition to a
low-carbon economy. Columbia University Press, New York, NY.
Lewis, J.I., 2014. The Rise of Renewable Energy Protectionism: Emerging Trade Conflicts and
Implications for Low Carbon Development Joanna. Glob. Environ. Polit. 14.
Lindman, Å., Söderholm, P., 2011. Wind power learning rates: A conceptual review and meta-analysis.
Energy Econ. 34, 754–761.
Lundvall, B.Å., Joseph, K.J., Chaminade, C., 2009. Handbook on Innovation Systems and Developing
Countries: Building Domestic Capabilities in a Global Context. Edward Elgar Publishing,
Cheltenham, UK and Northampton, MA.
Morrison, A., Pietrobelli, C., Rabellotti, R., 2008. Global Value Chains and Technological Capabilities: A
Framework to Study Learning and Innovation in Developing Countries. Oxford Dev. Stud. 36,
39–58.
Mott McDonald, 2011. Costs of low-carbon generation technologies. UK Committee on Climate
Change, London, UK.
Muncharoen, C., Limmeechokchai, B., Yoohoon, A., Kumpeera, K., Buakhiew, C., Kunanopparat, S.,
Sangdow, S., Kniniman, N., Chawanapong, A., Theeraleekul, A., Bunchaidee, R., 2010. The study
of emission factor for an electricity system in Thailand in Year 2010. Thailand Greenhouse Gas
Management Organization, Bangkok, Thailand.
Mytelka, L.K., 2000. Local Systems of Innovation in a Globalized World Economy. Ind. Innov. 7, 15–32.
Nachmany, M., Fankhauser, S., Townshend, T., Collins, M., Landesman, T., Matthews, A., Pavese, C.,
Rietig, K., Schleifer, P., Setzer, J., 2014. The GLOBE Climate Legislation Study: A Review of
Climate Change Legislation in 66 Countries. Fourth Edition. GLOBE International and the
Grantham Research Institute, London School of Economics, London, UK.
Nahm, J., Steinfeld, E.S., 2014. Scale-up Nation: China’s Specialization in Innovative Manufacturing.
World Dev. 54, 288–300.
Nakawiro, T., Bhattacharyya, S., Limmeechokchai, B., 2008. Electricity capacity expansion in Thailand:
An analysis of gas dependence and fuel import reliance. Energy 33, 712–723.
Naksrisuk, C., Audomvongseree, K., 2013. Dependable capacity evaluation of wind power and solar
power generation systems. 2013 10th Int. Conf. Electr. Eng. Comput. Telecommun. Inf. Technol.
27
An edited version of this paper is forthcoming in the Journal of Cleaner Production
NREL, 2012. Cost and performance data for power generation technologies. National Renewable
Energy Laboratory (NREL), Boulder, Colorado.
Ockwell, D., Haum, R., Mallett, A., Watson, J., 2010. Intellectual property rights and low carbon
technology transfer: Conflicting discourses of diffusion and development. Glob. Environ. Chang.
20, 729–738.
Ockwell, D., Mallett, A., 2012. Low-carbon technology transfer: From rhetoric to reality. Rourledge,
New York, NY.
Ondraczek, J., Komendantova, N., Patt, A., 2013. WACC the Dog: The Effect of Financing Costs on the
Levelized Cost of Solar PV Power. Working Paper FNU-201, Hamburg, Germany.
Palmer, K., Burtraw, D., 2005. Cost-effectiveness of renewable electricity policies. Energy Econ. 27,
873–894.
Pattanapongchai, A., Limmeechokchai, B., 2011a. Least cost energy planning in Thailand: A case of
biogas upgrading in palm oil industry. Songklanakarin J. Sci. Technol. 33, 705–715.
Pattanapongchai, A., Limmeechokchai, B., 2011b. Least cost energy planning in Thailand : A case of
biogas upgrading in palm oil industry. Renew. Energy 33, 705–715.
Peters, M., Schneider, M., Griesshaber, T., Hoffmann, V.H., 2012. The impact of technology-push and
demand-pull policies on technical change – Does the locus of policies matter? Res. Policy 41,
1296–1308.
Phillips, J., Das, K., Newell, P., 2013. Governance and technology transfer in the Clean Development
Mechanism in India. Glob. Environ. Chang. 6, 1594–1604.
Pongsoi, P., Wongwises, S., 2013. A review on nuclear power plant scenario in Thailand. Renew.
Sustain. Energy Rev. 24, 586–592.
Promjiraprawat, K., Limmeechokchai, B., 2012. Assessment of Thailand’s Energy Policies and CO2
Emissions: Analyses of Energy Efficiency Measures and Renewable Power Generation. Energies
5, 3074–3093.
PTIT, 2012. Facts about Natural Gas in Thailand. Petroleum Institute of Thailand (PTIT), Bangkok,
Thailand.
Pueyo, A., García, R., Mendiluce, M., Morales, D., 2011. The role of technology transfer for the
development of a local wind component industry in Chile. Energy Policy 39, 4274–4283.
Pueyo, A., Mendiluce, M., Naranjo, M.S., Lumbreras, J., 2012. How to increase technology transfers
to developing countries: a synthesis of the evidence. Clim. Policy 12, 320–340.
REN21, 2013. Renewables 2013: Global Status Report. Renewable Energy Policy Network for the 21st
Century (REN21), Paris, France.
Ruangrong, P., 2012. Power Tariff Structure in Thailand Energy Regulatory Commission of Thailand.
Energy Regulatory Commission of Thailand, Bangkok, Thailand.
28
An edited version of this paper is forthcoming in the Journal of Cleaner Production
Sandén, B.A., Azar, C., 2005. Near-term technology policies for long-term climate targets? Economy-
wide versus technology specific approaches. Energy Policy 33, 1557–1576.
Sangarasri-Greacen, C., Greacen, C., 2012. Proposed Power Development Plan 2012 and a
Framework for Improving Accountability and Performance of Power Sector Planning. Bangkok,
Thailand.
Schmidt, T., Born, R., Schneider, M., 2012. Assessing the costs of photovoltaic and wind power in six
developing countries. Nat. Clim. Chang. 2, 548–553.
Schmidt, T.S., 2014. Low-carbon investment risks and de-risking. Nat. Clim. Chang. 4, 237–239.
Seel, J., Barbose, G., Wiser, R., 2014. An analysis of residential PV system price differences between
the United States and Germany. Energy Policy in press.
Senker, J., 1995. Tacit Knowledge and Models of Innovation. Ind. Corp. Chang. 4, 425–447.
The World Bank, 2014. Databank. The World Bank, Washington, DC.
Tongsopit, S., Greacen, C., 2013. An assessment of Thailand’s feed-in tariff program. Renew. Energy
60, 1–24.
Townshend, T., Fankhauser, S., Aybar, R., Collins, M., Landesman, T., Nachmany, M., Pavese, C., 2013.
How national legislation can help to solve climate change. Nat. Clim. Chang. 3, 430–432.
UNFCCC, 2010. Guidelines on the Assessment of Investment Analysis. United Nations Framework
Convention on Climate Change (UNFCCC), Bonn, Germany.
UNFCCC, 2011. Report of the Conference of the Parties on its sixteenth session. United Nations
Framework Convention on Climate Change (UNFCCC), Cancun, Mexico.
UNFCCC, 2012. Establishment of an Ad Hoc Working Group on the Durban Platform for Enhanced
Action (Proposal by the President). United Nations Framework Convention on Climate Change
(UNFCCC), Durban, South Africa.
Van der Zwaan, B.C.C., Gerlagh, R., Zwaan, B.C.C. Van Der, Klaassen, G., 2002. Endogenous
technological change in climate change modelling. Energy Econ. 24, 1–19.
Van Hoof, B., 2014. Organizational learning in cleaner production among Mexican supply networks. J.
Clean. Prod. 64, 115–124.
Van Tilburg, X., Bristow, S., Röser, F., Escalante, D., Fekete, H., 2013. Status Report on Nationally
Appropriate Mitigation Actions (NAMAs) - Mid-year update June 2013. Energy Centre of The
Netherlands (ECN) and Ecofys, Amsterdam, the Netherlands.
Von Hippel, E., 1994. “Sticky information” and the locus of problem solving: Implications for
innovation. Manage. Sci. 40, 429–439.
Waissbein, O., Glemarec, Y., Bayraktar, H., Schmidt, T.S., 2013. Derisking Renewable Energy
Investment. A Framework to Support Policymakers in Selecting Public Instruments to Promote
Renewable Energy Investment in Developing Countries. United Nations Development
Programme (UNDP), New York, NY.
29
An edited version of this paper is forthcoming in the Journal of Cleaner Production
Wisuttisak, P., 2012. Regulation and competition issues in Thai electricity sector. Energy Policy 44,
185–198.
30
An edited version of this paper is forthcoming in the Journal of Cleaner Production
Appendix A: Cost of Avoided Electricity
Fuel Mix in the Electricity Sector
Thailand’s electricity sector is partly vertically integrated and dominated by state-owned enterprises
(Wisuttisak, 2012). The Electricity Generation Authority of Thailand (EGAT) is the transmission system
operator and directly operates around 50% of the generation assets and, as their largest shareholder,
controls the two largest independent power producers. Furthermore, the wholesale market is not
liberalized. Decisions over new power plant investments are therefore still made based on long-term
integrated plans, rather than purely based on market signals, and plant utilization is based on long-
term allocations rather than marginal cost of generation.
Our model of the fuel mix aims to reflect this decision-making process. We took the power plant
pipeline from the Power Development Plan from June 2012 (EPPO, 2012a) and assumed that all
hydropower, combined-heat-and-power, and contracted import capacity comes online as planned.
Additional power plants were assumed to be built, in the sequence determined by the plan,
whenever dependable capacity exceeds peak demand by less than 15%, or total expected demand
exceeds expected generation, based on historic capacity factors, exceeds more than 5%. This
approach is similar to the one adopted by domestic researchers (Sangarasri-Greacen and Greacen,
2012). The dependable capacity equals the total capacity adjusted by factors that aim to reflect the
fact that not all build capacity can be expected to be available in the moment of peak demand,
because of maintenance, failures, or intermittent generation.9
The fuel mix was then calculated, on a
yearly basis, from historic capacity factors, marginally adjusted for the dispatchable plant fleet to
exactly meet yearly demand. “Dispatchable” refers here to the plants that are ramped up and down
to balance demand, i.e., the full fleet excluding renewables, contracted import capacity (lignite and
hydro), municipal solid waste and (heat-led) cogeneration.
Avoided Electricity
To model the effect of renewable energy diffusion on conventional electricity generation, we
compared the hypothetical scenario without renewable energy diffusion to the case of full
implementation of the AEDP targets. The total avoided electricity we then calculated by aggregating
the differences between total generation in 2012-2041 with and without AEDP targets for each of the
dispatchable technologies (generation from non-dispatachable technologies is not affected by the
AEDP).
Modeling the marginal cost of avoided electricity required one more step of differentiation. The
impact of renewable capacity installations can be twofold: plant utilization of dispatchable power
plants can be reduced or the construction of new power plants postponed. Our model accounted for
these two effects by dividing the total avoided electricity into build and operating margins. For all
displaced electricity the cost of electricity was calculated based on the LCOE approach presented in
section 4.2.2. However, in the case of reduced plant utilization, the operating margin, we assumed
the marginal cost of electricity to contain only the variable cost (O&M and fuel). The displaced
9
The factors are taken from Sangarasri-Greacen and Greacen (2012) and listed in Table 3.
31
An edited version of this paper is forthcoming in the Journal of Cleaner Production
electricity from postponed power plants, the build margin, contains all fixed and variable cost.10
Table 4 summarizes the input assumptions for all conventional technologies.
Appendix B: Model Input Assumptions
Table 3: Input assumptions for renewable energy technologies (values for 2012; $=USD2012)
Size
(MW)
Lifetime
[a]
Investment
[$/kW]
O&M
fix
[$/kWa]
O&M
variable
[$/MWh]
Fuel cost
[$/MWh]
Efficiency
[%]
Capacity
factor
[%]
Dependable
capacity
[%]
Carbon
credits*
[kCO2e/MWh]
Wind 10 20 1,980a
60a
0a
- - 31.8e
9f
555.4h
PV 10 20 2,830a
50a
0a
- - 19.8e
20f
555.4h
CSP 5 20 4,910a
50a
0a
- - 21.5e
70g
555.4h
Biomass 10 20 2,157b
0b
10.4b
41.2b
19.8%b
69b
55g
511.3h
Biogas 1 20 2,554c
116c
0c
10c
31%c
70c
21g
511.3h
Micro
hydro 1 20 2,800d
112d
0d
- - 29i
40g
511.3h
a
NREL (2012); b
Delivand et al. (2011); c
Pattanapongchai and Limmeechokchai (2011); d
IRENA (2012e); e
calculated based on data from the
IRENA Global Atlas (3Tier; 2014); f
Naksrisuk and Audomvongseree (2013); g
Sangarasri-Greacen and Greacen (2012); h
Munchareon et al.
(2010); i
Promjiraprawat and Limmeechokchai (2012) other data are own assumptions and calculations; *used for calculation of generated
carbon credits; data from the Thailand Greenhouse Gas Management Organization (Muncharoen et al., 2010), which calculates the avoided
carbon emissions of renewable projects in Thailand based on CDM methodology. The CDM methodology distinguishes between
intermittent (solar and wind) and non-intermittent technologies (biomass, biogas and micro-hydro)- Because they need back-up power,
intermittent sources are assumed to not much affect the decision about new fossil-fuelled power plants. The electricity they avoid
therefore comes mostly from existing power plants (75% to 25%), while non-intermittent sources are assumed to avoid a larger amount of
newly built fossil-fuelled power capacity (50% to 50%). Since the new power plants have lower emissions than the existing plant fleet, the
intermittent sources end up avoiding slightly more carbon emissions than the non-intermittent sources.
Table 4: Input assumptions for dispatchable fossil fuel technologies (values for 2012; $=USD2012)
10
This procedure was also employed by Schmidt et al. (2012) and is related to the rules employed to calculate
avoided carbon emissions in the Clean Development Mechanisms under the UNFCCC.
Lifetime [a]
Investment
[$/kW]
O&M fixed
[$/kWa]
O&M
variable
[$/MWh]
Fuel
efficiency [%]
Fuel cost*
[$/kWh]
Capacity
factor [%]
Carbon emissions
[tCO2e/MWh]
Subcritic. lignite 30 1,125a
38.91b
11.02b
35b
0.005d
90 1,159b
IGCC lignite 30 2,830c
50c
7.9c
46c
0.005d
90 882
Adv. nuclear 40 5,429c
91.65c
2.1c
33c
0.003d
90 21b
Gas turbine ** ** 7.21c
15.28c
31.4c
0.052e
30 631b
CCGT 30 1,006c
15.1c
3.21c
54c
0.052e
60 404b
Subcritic. coal ** ** 38b
0.04b
36b
0.015f
90 973b
Supercrit. coal 30 2,934c
31.18d
4.7d
39c
0.015f
90 782b
IGCC coal 30 3,784c
51.39c
8.45c
39c
0.015f
90 782b
Diesel turbine ** ** 12a
28.6a
22a
0.061d
30 808b
CCGT: combined cycle gas turbine; IGCC: integrated gasification combined cycle; a
Pattanapongchai and Limmeechokchai(2011); b
Promjiraprawat
and Limmeechokchai (2012); c
DOE/EIA (2013); d
EPPO (2012d);e
price for natural gas is for imports from Myanmar, from PTIT (2012) f
IEA (2013c);
*Fuel price trends from IEA (2013c); **Not needed because no new power plants in the pipeline
32
An edited version of this paper is forthcoming in the Journal of Cleaner Production
Table 5: Split between locally and globally sourced components by technology in models E-H, representing a low share of
local components
Technology Locally sourced parts Globally sourced parts
Cost split
local/global
Learning rate
local/global
Wind
Grid connection; engineering; procurement
& construction
Nacelle (including electrical
machinery, power electronics
& control system); foundation;
rotor blades; tower
36/64a
11.3/4.3d
PV
Grid connection; engineering; procurement
& construction
PV modules; inverter; balance
of system
36/64b
17/20d
CSP
Grid connection; engineering; procurement
& construction
Power block; heat transfer
fluid cycle; solar field
23/77b
14.6/14.6d
Biomass
Grid connection; engineering, procurement
& construction; fuel shredder; piping
Steam turbine and electric
generator (prime mover); flue
gas and water treatment;
boiler; heat exchanger
37/63c
5/5c
Biogas
Grid connection; engineering, procurement
& construction; fuel handling
Gas engine (prime mover);
converter system; electrical
system
48/52c
5/5c
Micro hydro
Grid connection; engineering, procurement
& construction
Electro-mechanical equipment 77/23c
5/5c
a
IRENA (2012c); b
NREL (2012); c
Mott McDonald (2011); d
Hayward & Graham (2013)
Table 6: Sectoral assumptions in the model
Factor Assumption Source
Currency USD 2012 in real terms ---
Exchange rate 1 USD = 31.5 Thai Baht The World Bank
Inflation 2.5% Bank of Thailand
Equity/debt spilt 30/70 Current practice
Return on equity 11.2% real UNFCCC (2010)
Lending rate 6.7% nominal Ondraczek et al. (2013)
Loan tenor Half of investment lifetime Waissbein et al. (2013)
Tax rate 30% Current practice
Depreciation Linear, max 5% p.a., min book value 5% Current practice
Discounting of public expenditures Equals 40-year bond yield of 4.43 % Thai Bond Market Association,
http://www.thaibma.or.th/yieldcurve/YieldTTM.aspx,;
assessed on 4/3/2014
33

More Related Content

What's hot

To Assess the Main Drawbacks of Advanced Technology for the Accounting Sphere
To Assess the Main Drawbacks of Advanced Technology for the Accounting SphereTo Assess the Main Drawbacks of Advanced Technology for the Accounting Sphere
To Assess the Main Drawbacks of Advanced Technology for the Accounting SphereFinancialMarketCorpo
 
ICT Educational leadership
ICT Educational leadershipICT Educational leadership
ICT Educational leadershipCasual Teacher
 
Environmental reforms in kenya. ASSIGNMNET 1 DDS914E
Environmental reforms in kenya. ASSIGNMNET 1 DDS914EEnvironmental reforms in kenya. ASSIGNMNET 1 DDS914E
Environmental reforms in kenya. ASSIGNMNET 1 DDS914Ebarasa odula elias
 
Toward sustainable interior design education in kuwait
Toward sustainable interior design education in kuwaitToward sustainable interior design education in kuwait
Toward sustainable interior design education in kuwaitDr.Ahmad Alansari
 
An Economics of Nano technology: The relative importance of Governmental fund...
An Economics of Nano technology: The relative importance of Governmental fund...An Economics of Nano technology: The relative importance of Governmental fund...
An Economics of Nano technology: The relative importance of Governmental fund...IJERA Editor
 
Ppt of final thesis
Ppt of final thesisPpt of final thesis
Ppt of final thesisWU
 
UNEP Assessment GE Policymaking_for web
UNEP Assessment GE Policymaking_for webUNEP Assessment GE Policymaking_for web
UNEP Assessment GE Policymaking_for webYoonhee Kim
 
Beautiful Beijing seminar presentation by Kari Hiltunen, Tekes
Beautiful Beijing seminar presentation by Kari Hiltunen, TekesBeautiful Beijing seminar presentation by Kari Hiltunen, Tekes
Beautiful Beijing seminar presentation by Kari Hiltunen, TekesBusiness Finland
 
Analysis and prediction of cost and time overrun of
Analysis and prediction of cost and time overrun ofAnalysis and prediction of cost and time overrun of
Analysis and prediction of cost and time overrun ofAlexander Decker
 
INNOVATIVE GOALS: CONCEPT, FORMULATION, BUILDING TREE GOALS
INNOVATIVE GOALS: CONCEPT, FORMULATION, BUILDING TREE GOALSINNOVATIVE GOALS: CONCEPT, FORMULATION, BUILDING TREE GOALS
INNOVATIVE GOALS: CONCEPT, FORMULATION, BUILDING TREE GOALSSubmissionResearchpa
 
Investigating factors affecting material selection
Investigating factors affecting material selectionInvestigating factors affecting material selection
Investigating factors affecting material selectionAlsian Brown-Perry
 
Wp062011 risk management for energy efficiency projects in developing countries
Wp062011 risk management for energy efficiency projects in developing countriesWp062011 risk management for energy efficiency projects in developing countries
Wp062011 risk management for energy efficiency projects in developing countriesAgus Witono
 
Nordic Collaboration With China In Energy Research And Develiopment
Nordic Collaboration With China In Energy Research And DeveliopmentNordic Collaboration With China In Energy Research And Develiopment
Nordic Collaboration With China In Energy Research And DeveliopmentGlenn Klith Andersen
 
EU4Environment RA - Introduction
EU4Environment RA - IntroductionEU4Environment RA - Introduction
EU4Environment RA - IntroductionOECD Environment
 
Engineering Cluster PLTW presentation
Engineering Cluster PLTW presentationEngineering Cluster PLTW presentation
Engineering Cluster PLTW presentationKrystal DuBose
 
Rockin’ All over The World - How Education-Supporting ICT Research Can Make N...
Rockin’ All over The World - How Education-Supporting ICT Research Can Make N...Rockin’ All over The World - How Education-Supporting ICT Research Can Make N...
Rockin’ All over The World - How Education-Supporting ICT Research Can Make N...The Research Council of Norway, IKTPLUSS
 

What's hot (19)

To Assess the Main Drawbacks of Advanced Technology for the Accounting Sphere
To Assess the Main Drawbacks of Advanced Technology for the Accounting SphereTo Assess the Main Drawbacks of Advanced Technology for the Accounting Sphere
To Assess the Main Drawbacks of Advanced Technology for the Accounting Sphere
 
ICT Educational leadership
ICT Educational leadershipICT Educational leadership
ICT Educational leadership
 
Environmental reforms in kenya. ASSIGNMNET 1 DDS914E
Environmental reforms in kenya. ASSIGNMNET 1 DDS914EEnvironmental reforms in kenya. ASSIGNMNET 1 DDS914E
Environmental reforms in kenya. ASSIGNMNET 1 DDS914E
 
Toward sustainable interior design education in kuwait
Toward sustainable interior design education in kuwaitToward sustainable interior design education in kuwait
Toward sustainable interior design education in kuwait
 
An Economics of Nano technology: The relative importance of Governmental fund...
An Economics of Nano technology: The relative importance of Governmental fund...An Economics of Nano technology: The relative importance of Governmental fund...
An Economics of Nano technology: The relative importance of Governmental fund...
 
Ppt of final thesis
Ppt of final thesisPpt of final thesis
Ppt of final thesis
 
UNEP Assessment GE Policymaking_for web
UNEP Assessment GE Policymaking_for webUNEP Assessment GE Policymaking_for web
UNEP Assessment GE Policymaking_for web
 
Beautiful Beijing seminar presentation by Kari Hiltunen, Tekes
Beautiful Beijing seminar presentation by Kari Hiltunen, TekesBeautiful Beijing seminar presentation by Kari Hiltunen, Tekes
Beautiful Beijing seminar presentation by Kari Hiltunen, Tekes
 
Analysis and prediction of cost and time overrun of
Analysis and prediction of cost and time overrun ofAnalysis and prediction of cost and time overrun of
Analysis and prediction of cost and time overrun of
 
INNOVATIVE GOALS: CONCEPT, FORMULATION, BUILDING TREE GOALS
INNOVATIVE GOALS: CONCEPT, FORMULATION, BUILDING TREE GOALSINNOVATIVE GOALS: CONCEPT, FORMULATION, BUILDING TREE GOALS
INNOVATIVE GOALS: CONCEPT, FORMULATION, BUILDING TREE GOALS
 
Investigating factors affecting material selection
Investigating factors affecting material selectionInvestigating factors affecting material selection
Investigating factors affecting material selection
 
Wp062011 risk management for energy efficiency projects in developing countries
Wp062011 risk management for energy efficiency projects in developing countriesWp062011 risk management for energy efficiency projects in developing countries
Wp062011 risk management for energy efficiency projects in developing countries
 
Nordic Collaboration With China In Energy Research And Develiopment
Nordic Collaboration With China In Energy Research And DeveliopmentNordic Collaboration With China In Energy Research And Develiopment
Nordic Collaboration With China In Energy Research And Develiopment
 
UNEP_Investing
UNEP_InvestingUNEP_Investing
UNEP_Investing
 
EU4Environment RA - Introduction
EU4Environment RA - IntroductionEU4Environment RA - Introduction
EU4Environment RA - Introduction
 
Engineering Cluster PLTW presentation
Engineering Cluster PLTW presentationEngineering Cluster PLTW presentation
Engineering Cluster PLTW presentation
 
Rockin’ All over The World - How Education-Supporting ICT Research Can Make N...
Rockin’ All over The World - How Education-Supporting ICT Research Can Make N...Rockin’ All over The World - How Education-Supporting ICT Research Can Make N...
Rockin’ All over The World - How Education-Supporting ICT Research Can Make N...
 
20081002 summary 07.12.07
20081002 summary 07.12.0720081002 summary 07.12.07
20081002 summary 07.12.07
 
New challenges for the evaluation community
New challenges for the evaluation communityNew challenges for the evaluation community
New challenges for the evaluation community
 

Viewers also liked

Zorgmarketing: de slag om de patiënt
Zorgmarketing: de slag om de patiëntZorgmarketing: de slag om de patiënt
Zorgmarketing: de slag om de patiëntLex van der Giessen
 
Reducing farming's greenhouse gas emissions:what will the future bring?
Reducing farming's greenhouse gas emissions:what will the future bring?Reducing farming's greenhouse gas emissions:what will the future bring?
Reducing farming's greenhouse gas emissions:what will the future bring?Farming Futures
 
Нема ціни святині дорогій
Нема ціни святині дорогійНема ціни святині дорогій
Нема ціни святині дорогійSergiy Gakh
 
Quand Le Bricolage Devient Un Art !
Quand Le Bricolage Devient Un Art !Quand Le Bricolage Devient Un Art !
Quand Le Bricolage Devient Un Art !Sylvain Dufour
 
Report Alix - Wash governance SSD final 06.07.2015
Report Alix - Wash governance SSD final 06.07.2015Report Alix - Wash governance SSD final 06.07.2015
Report Alix - Wash governance SSD final 06.07.2015Alix lerebours
 
Camera angle images from documentary
Camera angle images from documentaryCamera angle images from documentary
Camera angle images from documentarysamwadsted
 
A Trinity Construction for Web Extraction Using Efficient Algorithm
A Trinity Construction for Web Extraction Using Efficient AlgorithmA Trinity Construction for Web Extraction Using Efficient Algorithm
A Trinity Construction for Web Extraction Using Efficient AlgorithmIOSR Journals
 
Martin data collection methods
Martin  data collection methodsMartin  data collection methods
Martin data collection methodsMartin Otundo
 
Opleidingen in personeelsplanning en personeelsmanagement 2016
Opleidingen in personeelsplanning en personeelsmanagement 2016Opleidingen in personeelsplanning en personeelsmanagement 2016
Opleidingen in personeelsplanning en personeelsmanagement 2016Déhora
 
Top 30 Things We've Learned (Dr. Alicia Mangram)
Top 30 Things We've Learned (Dr. Alicia Mangram)Top 30 Things We've Learned (Dr. Alicia Mangram)
Top 30 Things We've Learned (Dr. Alicia Mangram)honorhealth
 
Voice Over Styles
Voice Over Styles Voice Over Styles
Voice Over Styles JackBolton1
 
Feasibility of Using Tincal Ore Waste as Barrier Material for Solid Waste Con...
Feasibility of Using Tincal Ore Waste as Barrier Material for Solid Waste Con...Feasibility of Using Tincal Ore Waste as Barrier Material for Solid Waste Con...
Feasibility of Using Tincal Ore Waste as Barrier Material for Solid Waste Con...IOSR Journals
 

Viewers also liked (16)

Zorgmarketing: de slag om de patiënt
Zorgmarketing: de slag om de patiëntZorgmarketing: de slag om de patiënt
Zorgmarketing: de slag om de patiënt
 
Ross kemp
Ross kempRoss kemp
Ross kemp
 
Reducing farming's greenhouse gas emissions:what will the future bring?
Reducing farming's greenhouse gas emissions:what will the future bring?Reducing farming's greenhouse gas emissions:what will the future bring?
Reducing farming's greenhouse gas emissions:what will the future bring?
 
Modelle
ModelleModelle
Modelle
 
Нема ціни святині дорогій
Нема ціни святині дорогійНема ціни святині дорогій
Нема ціни святині дорогій
 
Quand Le Bricolage Devient Un Art !
Quand Le Bricolage Devient Un Art !Quand Le Bricolage Devient Un Art !
Quand Le Bricolage Devient Un Art !
 
Report Alix - Wash governance SSD final 06.07.2015
Report Alix - Wash governance SSD final 06.07.2015Report Alix - Wash governance SSD final 06.07.2015
Report Alix - Wash governance SSD final 06.07.2015
 
Budapest Fiddler
Budapest FiddlerBudapest Fiddler
Budapest Fiddler
 
Camera angle images from documentary
Camera angle images from documentaryCamera angle images from documentary
Camera angle images from documentary
 
A Trinity Construction for Web Extraction Using Efficient Algorithm
A Trinity Construction for Web Extraction Using Efficient AlgorithmA Trinity Construction for Web Extraction Using Efficient Algorithm
A Trinity Construction for Web Extraction Using Efficient Algorithm
 
Porsche, Volkswagen and CSX Cars, Trains & Derivatives
Porsche, Volkswagen and CSXCars, Trains & Derivatives Porsche, Volkswagen and CSXCars, Trains & Derivatives
Porsche, Volkswagen and CSX Cars, Trains & Derivatives
 
Martin data collection methods
Martin  data collection methodsMartin  data collection methods
Martin data collection methods
 
Opleidingen in personeelsplanning en personeelsmanagement 2016
Opleidingen in personeelsplanning en personeelsmanagement 2016Opleidingen in personeelsplanning en personeelsmanagement 2016
Opleidingen in personeelsplanning en personeelsmanagement 2016
 
Top 30 Things We've Learned (Dr. Alicia Mangram)
Top 30 Things We've Learned (Dr. Alicia Mangram)Top 30 Things We've Learned (Dr. Alicia Mangram)
Top 30 Things We've Learned (Dr. Alicia Mangram)
 
Voice Over Styles
Voice Over Styles Voice Over Styles
Voice Over Styles
 
Feasibility of Using Tincal Ore Waste as Barrier Material for Solid Waste Con...
Feasibility of Using Tincal Ore Waste as Barrier Material for Solid Waste Con...Feasibility of Using Tincal Ore Waste as Barrier Material for Solid Waste Con...
Feasibility of Using Tincal Ore Waste as Barrier Material for Solid Waste Con...
 

Similar to Global Learning Versus Renewable energy

Till Bajohr - Renewable Energy Investments in Developing Countries
Till Bajohr - Renewable Energy Investments in Developing CountriesTill Bajohr - Renewable Energy Investments in Developing Countries
Till Bajohr - Renewable Energy Investments in Developing CountriesJens12
 
International Climate Technology Strategies
International Climate Technology StrategiesInternational Climate Technology Strategies
International Climate Technology StrategiesGlenn Klith Andersen
 
Pathways to Net Zero: The Impact of Clean Energy Research
Pathways to Net Zero: The Impact of Clean Energy ResearchPathways to Net Zero: The Impact of Clean Energy Research
Pathways to Net Zero: The Impact of Clean Energy ResearchKitipan Kitbamroong Ph.D. CISA
 
11_Lect_New Directions in Economic Geography
11_Lect_New Directions in Economic Geography11_Lect_New Directions in Economic Geography
11_Lect_New Directions in Economic GeographyPrivate
 
Rolling Out the Quadrennial Technology Review Report
Rolling Out the Quadrennial Technology Review Report Rolling Out the Quadrennial Technology Review Report
Rolling Out the Quadrennial Technology Review Report US Department of Energy
 
Tenant participation in sustainable renovation projects
Tenant participation in sustainable renovation projectsTenant participation in sustainable renovation projects
Tenant participation in sustainable renovation projectsAlexander Decker
 
The effects of information communication technology and Economic.pptx
The effects of information communication technology and Economic.pptxThe effects of information communication technology and Economic.pptx
The effects of information communication technology and Economic.pptxmohammed19
 
Sustainability 12-06571-v2
Sustainability 12-06571-v2Sustainability 12-06571-v2
Sustainability 12-06571-v2SITINURAIN41
 
IEA Energy Technology Perspectives 2023
IEA Energy Technology Perspectives 2023IEA Energy Technology Perspectives 2023
IEA Energy Technology Perspectives 2023Energy for One World
 
US Department of Energy: Critical Materials Strategy
US Department of Energy: Critical Materials StrategyUS Department of Energy: Critical Materials Strategy
US Department of Energy: Critical Materials StrategyRare Earths / Rare Metals
 
Product recovery decisions within the context of Extended Producer Responsibi...
Product recovery decisions within the context of Extended Producer Responsibi...Product recovery decisions within the context of Extended Producer Responsibi...
Product recovery decisions within the context of Extended Producer Responsibi...Ian McCarthy
 
Re&agri 2014 - risk governance of energy transition - komendantova
Re&agri 2014 -  risk governance of energy transition - komendantovaRe&agri 2014 -  risk governance of energy transition - komendantova
Re&agri 2014 - risk governance of energy transition - komendantovaMohamed Larbi BEN YOUNES
 
Al Azhar - International Seminar on Science, Technology and Innovations
Al Azhar - International Seminar on Science, Technology and InnovationsAl Azhar - International Seminar on Science, Technology and Innovations
Al Azhar - International Seminar on Science, Technology and Innovationspariatmono
 
Solar Photovoltaic power roadmap
Solar Photovoltaic power roadmapSolar Photovoltaic power roadmap
Solar Photovoltaic power roadmapH Janardan Prabhu
 
Technology transfer in a global economyDavid B. Audretsch .docx
Technology transfer in a global economyDavid B. Audretsch .docxTechnology transfer in a global economyDavid B. Audretsch .docx
Technology transfer in a global economyDavid B. Audretsch .docxssuserf9c51d
 
The Need for Green Technologies, by UK Energy Research Centre (UKERC) Researc...
The Need for Green Technologies, by UK Energy Research Centre (UKERC) Researc...The Need for Green Technologies, by UK Energy Research Centre (UKERC) Researc...
The Need for Green Technologies, by UK Energy Research Centre (UKERC) Researc...UK Energy Research Centre (UKERC)
 
ELE00041H Management and Marketing of Technology Assignment (100).docx
ELE00041H Management and Marketing of Technology Assignment (100).docxELE00041H Management and Marketing of Technology Assignment (100).docx
ELE00041H Management and Marketing of Technology Assignment (100).docxtoltonkendal
 
Carragher et al, 2014 Behave Conference Paper - 4 sept 2014
Carragher et al, 2014 Behave Conference Paper - 4 sept 2014Carragher et al, 2014 Behave Conference Paper - 4 sept 2014
Carragher et al, 2014 Behave Conference Paper - 4 sept 2014cahir90
 

Similar to Global Learning Versus Renewable energy (20)

Till Bajohr - Renewable Energy Investments in Developing Countries
Till Bajohr - Renewable Energy Investments in Developing CountriesTill Bajohr - Renewable Energy Investments in Developing Countries
Till Bajohr - Renewable Energy Investments in Developing Countries
 
International Climate Technology Strategies
International Climate Technology StrategiesInternational Climate Technology Strategies
International Climate Technology Strategies
 
Pathways to Net Zero: The Impact of Clean Energy Research
Pathways to Net Zero: The Impact of Clean Energy ResearchPathways to Net Zero: The Impact of Clean Energy Research
Pathways to Net Zero: The Impact of Clean Energy Research
 
11_Lect_New Directions in Economic Geography
11_Lect_New Directions in Economic Geography11_Lect_New Directions in Economic Geography
11_Lect_New Directions in Economic Geography
 
Rolling Out the Quadrennial Technology Review Report
Rolling Out the Quadrennial Technology Review Report Rolling Out the Quadrennial Technology Review Report
Rolling Out the Quadrennial Technology Review Report
 
Tenant participation in sustainable renovation projects
Tenant participation in sustainable renovation projectsTenant participation in sustainable renovation projects
Tenant participation in sustainable renovation projects
 
The effects of information communication technology and Economic.pptx
The effects of information communication technology and Economic.pptxThe effects of information communication technology and Economic.pptx
The effects of information communication technology and Economic.pptx
 
Sustainability 12-06571-v2
Sustainability 12-06571-v2Sustainability 12-06571-v2
Sustainability 12-06571-v2
 
IEA Energy Technology Perspectives 2023
IEA Energy Technology Perspectives 2023IEA Energy Technology Perspectives 2023
IEA Energy Technology Perspectives 2023
 
US Department of Energy: Critical Materials Strategy
US Department of Energy: Critical Materials StrategyUS Department of Energy: Critical Materials Strategy
US Department of Energy: Critical Materials Strategy
 
Product recovery decisions within the context of Extended Producer Responsibi...
Product recovery decisions within the context of Extended Producer Responsibi...Product recovery decisions within the context of Extended Producer Responsibi...
Product recovery decisions within the context of Extended Producer Responsibi...
 
IEA PV Road Map
IEA PV Road MapIEA PV Road Map
IEA PV Road Map
 
Re&agri 2014 - risk governance of energy transition - komendantova
Re&agri 2014 -  risk governance of energy transition - komendantovaRe&agri 2014 -  risk governance of energy transition - komendantova
Re&agri 2014 - risk governance of energy transition - komendantova
 
Al Azhar - International Seminar on Science, Technology and Innovations
Al Azhar - International Seminar on Science, Technology and InnovationsAl Azhar - International Seminar on Science, Technology and Innovations
Al Azhar - International Seminar on Science, Technology and Innovations
 
Solar Photovoltaic power roadmap
Solar Photovoltaic power roadmapSolar Photovoltaic power roadmap
Solar Photovoltaic power roadmap
 
Technology transfer in a global economyDavid B. Audretsch .docx
Technology transfer in a global economyDavid B. Audretsch .docxTechnology transfer in a global economyDavid B. Audretsch .docx
Technology transfer in a global economyDavid B. Audretsch .docx
 
The Need for Green Technologies, by UK Energy Research Centre (UKERC) Researc...
The Need for Green Technologies, by UK Energy Research Centre (UKERC) Researc...The Need for Green Technologies, by UK Energy Research Centre (UKERC) Researc...
The Need for Green Technologies, by UK Energy Research Centre (UKERC) Researc...
 
ELE00041H Management and Marketing of Technology Assignment (100).docx
ELE00041H Management and Marketing of Technology Assignment (100).docxELE00041H Management and Marketing of Technology Assignment (100).docx
ELE00041H Management and Marketing of Technology Assignment (100).docx
 
Compendium 26 february 2012
Compendium 26  february 2012Compendium 26  february 2012
Compendium 26 february 2012
 
Carragher et al, 2014 Behave Conference Paper - 4 sept 2014
Carragher et al, 2014 Behave Conference Paper - 4 sept 2014Carragher et al, 2014 Behave Conference Paper - 4 sept 2014
Carragher et al, 2014 Behave Conference Paper - 4 sept 2014
 

More from Ali Osman Öncel

Riskli Yapılar - Çevre ve Şehircilik
Riskli Yapılar - Çevre ve ŞehircilikRiskli Yapılar - Çevre ve Şehircilik
Riskli Yapılar - Çevre ve ŞehircilikAli Osman Öncel
 
Riskli Yapılar -Çevre ve Şehircilik
Riskli Yapılar -Çevre ve ŞehircilikRiskli Yapılar -Çevre ve Şehircilik
Riskli Yapılar -Çevre ve ŞehircilikAli Osman Öncel
 
Kar Kar Geothermal Field Work
Kar Kar Geothermal Field WorkKar Kar Geothermal Field Work
Kar Kar Geothermal Field WorkAli Osman Öncel
 
High Resolution Earth's Gravitational Field
High Resolution Earth's Gravitational FieldHigh Resolution Earth's Gravitational Field
High Resolution Earth's Gravitational FieldAli Osman Öncel
 
Gravity Predictions for Earthquakes
Gravity Predictions for EarthquakesGravity Predictions for Earthquakes
Gravity Predictions for EarthquakesAli Osman Öncel
 
Nakamura Technique for Soil Characterization
Nakamura Technique for Soil CharacterizationNakamura Technique for Soil Characterization
Nakamura Technique for Soil CharacterizationAli Osman Öncel
 
Geopsy: Seismic Vibration Processing
Geopsy: Seismic Vibration ProcessingGeopsy: Seismic Vibration Processing
Geopsy: Seismic Vibration ProcessingAli Osman Öncel
 

More from Ali Osman Öncel (20)

APA Yazım Kuralları
APA Yazım KurallarıAPA Yazım Kuralları
APA Yazım Kuralları
 
Gravimetri : Ders 14
Gravimetri : Ders 14Gravimetri : Ders 14
Gravimetri : Ders 14
 
Gravimetri : Ders 13
Gravimetri : Ders 13Gravimetri : Ders 13
Gravimetri : Ders 13
 
Gravimetri : Ders 12
Gravimetri : Ders 12Gravimetri : Ders 12
Gravimetri : Ders 12
 
Riskli Yapılar - Çevre ve Şehircilik
Riskli Yapılar - Çevre ve ŞehircilikRiskli Yapılar - Çevre ve Şehircilik
Riskli Yapılar - Çevre ve Şehircilik
 
Riskli Yapılar -Çevre ve Şehircilik
Riskli Yapılar -Çevre ve ŞehircilikRiskli Yapılar -Çevre ve Şehircilik
Riskli Yapılar -Çevre ve Şehircilik
 
Gravimetri : Ders 07
Gravimetri : Ders 07Gravimetri : Ders 07
Gravimetri : Ders 07
 
Gravimetri : Ders 06
Gravimetri : Ders 06Gravimetri : Ders 06
Gravimetri : Ders 06
 
Gravimetri: Ders 05
Gravimetri: Ders 05Gravimetri: Ders 05
Gravimetri: Ders 05
 
Gravimetri : Ders 04
Gravimetri : Ders 04Gravimetri : Ders 04
Gravimetri : Ders 04
 
Gravimetri : Ders 03
Gravimetri : Ders 03Gravimetri : Ders 03
Gravimetri : Ders 03
 
Gravimetri Ders 02
Gravimetri Ders 02Gravimetri Ders 02
Gravimetri Ders 02
 
Gravimetri Ders 01
Gravimetri Ders 01Gravimetri Ders 01
Gravimetri Ders 01
 
Kar Kar Geothermal Field Work
Kar Kar Geothermal Field WorkKar Kar Geothermal Field Work
Kar Kar Geothermal Field Work
 
Beppu geothermal field
Beppu geothermal fieldBeppu geothermal field
Beppu geothermal field
 
High Resolution Earth's Gravitational Field
High Resolution Earth's Gravitational FieldHigh Resolution Earth's Gravitational Field
High Resolution Earth's Gravitational Field
 
Gravity Predictions for Earthquakes
Gravity Predictions for EarthquakesGravity Predictions for Earthquakes
Gravity Predictions for Earthquakes
 
Nakamura Technique for Soil Characterization
Nakamura Technique for Soil CharacterizationNakamura Technique for Soil Characterization
Nakamura Technique for Soil Characterization
 
H/V User Guidelines
H/V User Guidelines H/V User Guidelines
H/V User Guidelines
 
Geopsy: Seismic Vibration Processing
Geopsy: Seismic Vibration ProcessingGeopsy: Seismic Vibration Processing
Geopsy: Seismic Vibration Processing
 

Recently uploaded

Alper Gobel In Media Res Media Component
Alper Gobel In Media Res Media ComponentAlper Gobel In Media Res Media Component
Alper Gobel In Media Res Media ComponentInMediaRes1
 
18-04-UA_REPORT_MEDIALITERAСY_INDEX-DM_23-1-final-eng.pdf
18-04-UA_REPORT_MEDIALITERAСY_INDEX-DM_23-1-final-eng.pdf18-04-UA_REPORT_MEDIALITERAСY_INDEX-DM_23-1-final-eng.pdf
18-04-UA_REPORT_MEDIALITERAСY_INDEX-DM_23-1-final-eng.pdfssuser54595a
 
Biting mechanism of poisonous snakes.pdf
Biting mechanism of poisonous snakes.pdfBiting mechanism of poisonous snakes.pdf
Biting mechanism of poisonous snakes.pdfadityarao40181
 
How to Make a Pirate ship Primary Education.pptx
How to Make a Pirate ship Primary Education.pptxHow to Make a Pirate ship Primary Education.pptx
How to Make a Pirate ship Primary Education.pptxmanuelaromero2013
 
DATA STRUCTURE AND ALGORITHM for beginners
DATA STRUCTURE AND ALGORITHM for beginnersDATA STRUCTURE AND ALGORITHM for beginners
DATA STRUCTURE AND ALGORITHM for beginnersSabitha Banu
 
Employee wellbeing at the workplace.pptx
Employee wellbeing at the workplace.pptxEmployee wellbeing at the workplace.pptx
Employee wellbeing at the workplace.pptxNirmalaLoungPoorunde1
 
Computed Fields and api Depends in the Odoo 17
Computed Fields and api Depends in the Odoo 17Computed Fields and api Depends in the Odoo 17
Computed Fields and api Depends in the Odoo 17Celine George
 
Enzyme, Pharmaceutical Aids, Miscellaneous Last Part of Chapter no 5th.pdf
Enzyme, Pharmaceutical Aids, Miscellaneous Last Part of Chapter no 5th.pdfEnzyme, Pharmaceutical Aids, Miscellaneous Last Part of Chapter no 5th.pdf
Enzyme, Pharmaceutical Aids, Miscellaneous Last Part of Chapter no 5th.pdfSumit Tiwari
 
Painted Grey Ware.pptx, PGW Culture of India
Painted Grey Ware.pptx, PGW Culture of IndiaPainted Grey Ware.pptx, PGW Culture of India
Painted Grey Ware.pptx, PGW Culture of IndiaVirag Sontakke
 
भारत-रोम व्यापार.pptx, Indo-Roman Trade,
भारत-रोम व्यापार.pptx, Indo-Roman Trade,भारत-रोम व्यापार.pptx, Indo-Roman Trade,
भारत-रोम व्यापार.pptx, Indo-Roman Trade,Virag Sontakke
 
EPANDING THE CONTENT OF AN OUTLINE using notes.pptx
EPANDING THE CONTENT OF AN OUTLINE using notes.pptxEPANDING THE CONTENT OF AN OUTLINE using notes.pptx
EPANDING THE CONTENT OF AN OUTLINE using notes.pptxRaymartEstabillo3
 
CARE OF CHILD IN INCUBATOR..........pptx
CARE OF CHILD IN INCUBATOR..........pptxCARE OF CHILD IN INCUBATOR..........pptx
CARE OF CHILD IN INCUBATOR..........pptxGaneshChakor2
 
Presiding Officer Training module 2024 lok sabha elections
Presiding Officer Training module 2024 lok sabha electionsPresiding Officer Training module 2024 lok sabha elections
Presiding Officer Training module 2024 lok sabha electionsanshu789521
 
“Oh GOSH! Reflecting on Hackteria's Collaborative Practices in a Global Do-It...
“Oh GOSH! Reflecting on Hackteria's Collaborative Practices in a Global Do-It...“Oh GOSH! Reflecting on Hackteria's Collaborative Practices in a Global Do-It...
“Oh GOSH! Reflecting on Hackteria's Collaborative Practices in a Global Do-It...Marc Dusseiller Dusjagr
 
How to Configure Email Server in Odoo 17
How to Configure Email Server in Odoo 17How to Configure Email Server in Odoo 17
How to Configure Email Server in Odoo 17Celine George
 
Pharmacognosy Flower 3. Compositae 2023.pdf
Pharmacognosy Flower 3. Compositae 2023.pdfPharmacognosy Flower 3. Compositae 2023.pdf
Pharmacognosy Flower 3. Compositae 2023.pdfMahmoud M. Sallam
 
Roles & Responsibilities in Pharmacovigilance
Roles & Responsibilities in PharmacovigilanceRoles & Responsibilities in Pharmacovigilance
Roles & Responsibilities in PharmacovigilanceSamikshaHamane
 
Software Engineering Methodologies (overview)
Software Engineering Methodologies (overview)Software Engineering Methodologies (overview)
Software Engineering Methodologies (overview)eniolaolutunde
 
Incoming and Outgoing Shipments in 1 STEP Using Odoo 17
Incoming and Outgoing Shipments in 1 STEP Using Odoo 17Incoming and Outgoing Shipments in 1 STEP Using Odoo 17
Incoming and Outgoing Shipments in 1 STEP Using Odoo 17Celine George
 

Recently uploaded (20)

Alper Gobel In Media Res Media Component
Alper Gobel In Media Res Media ComponentAlper Gobel In Media Res Media Component
Alper Gobel In Media Res Media Component
 
18-04-UA_REPORT_MEDIALITERAСY_INDEX-DM_23-1-final-eng.pdf
18-04-UA_REPORT_MEDIALITERAСY_INDEX-DM_23-1-final-eng.pdf18-04-UA_REPORT_MEDIALITERAСY_INDEX-DM_23-1-final-eng.pdf
18-04-UA_REPORT_MEDIALITERAСY_INDEX-DM_23-1-final-eng.pdf
 
Biting mechanism of poisonous snakes.pdf
Biting mechanism of poisonous snakes.pdfBiting mechanism of poisonous snakes.pdf
Biting mechanism of poisonous snakes.pdf
 
How to Make a Pirate ship Primary Education.pptx
How to Make a Pirate ship Primary Education.pptxHow to Make a Pirate ship Primary Education.pptx
How to Make a Pirate ship Primary Education.pptx
 
DATA STRUCTURE AND ALGORITHM for beginners
DATA STRUCTURE AND ALGORITHM for beginnersDATA STRUCTURE AND ALGORITHM for beginners
DATA STRUCTURE AND ALGORITHM for beginners
 
Employee wellbeing at the workplace.pptx
Employee wellbeing at the workplace.pptxEmployee wellbeing at the workplace.pptx
Employee wellbeing at the workplace.pptx
 
Model Call Girl in Tilak Nagar Delhi reach out to us at 🔝9953056974🔝
Model Call Girl in Tilak Nagar Delhi reach out to us at 🔝9953056974🔝Model Call Girl in Tilak Nagar Delhi reach out to us at 🔝9953056974🔝
Model Call Girl in Tilak Nagar Delhi reach out to us at 🔝9953056974🔝
 
Computed Fields and api Depends in the Odoo 17
Computed Fields and api Depends in the Odoo 17Computed Fields and api Depends in the Odoo 17
Computed Fields and api Depends in the Odoo 17
 
Enzyme, Pharmaceutical Aids, Miscellaneous Last Part of Chapter no 5th.pdf
Enzyme, Pharmaceutical Aids, Miscellaneous Last Part of Chapter no 5th.pdfEnzyme, Pharmaceutical Aids, Miscellaneous Last Part of Chapter no 5th.pdf
Enzyme, Pharmaceutical Aids, Miscellaneous Last Part of Chapter no 5th.pdf
 
Painted Grey Ware.pptx, PGW Culture of India
Painted Grey Ware.pptx, PGW Culture of IndiaPainted Grey Ware.pptx, PGW Culture of India
Painted Grey Ware.pptx, PGW Culture of India
 
भारत-रोम व्यापार.pptx, Indo-Roman Trade,
भारत-रोम व्यापार.pptx, Indo-Roman Trade,भारत-रोम व्यापार.pptx, Indo-Roman Trade,
भारत-रोम व्यापार.pptx, Indo-Roman Trade,
 
EPANDING THE CONTENT OF AN OUTLINE using notes.pptx
EPANDING THE CONTENT OF AN OUTLINE using notes.pptxEPANDING THE CONTENT OF AN OUTLINE using notes.pptx
EPANDING THE CONTENT OF AN OUTLINE using notes.pptx
 
CARE OF CHILD IN INCUBATOR..........pptx
CARE OF CHILD IN INCUBATOR..........pptxCARE OF CHILD IN INCUBATOR..........pptx
CARE OF CHILD IN INCUBATOR..........pptx
 
Presiding Officer Training module 2024 lok sabha elections
Presiding Officer Training module 2024 lok sabha electionsPresiding Officer Training module 2024 lok sabha elections
Presiding Officer Training module 2024 lok sabha elections
 
“Oh GOSH! Reflecting on Hackteria's Collaborative Practices in a Global Do-It...
“Oh GOSH! Reflecting on Hackteria's Collaborative Practices in a Global Do-It...“Oh GOSH! Reflecting on Hackteria's Collaborative Practices in a Global Do-It...
“Oh GOSH! Reflecting on Hackteria's Collaborative Practices in a Global Do-It...
 
How to Configure Email Server in Odoo 17
How to Configure Email Server in Odoo 17How to Configure Email Server in Odoo 17
How to Configure Email Server in Odoo 17
 
Pharmacognosy Flower 3. Compositae 2023.pdf
Pharmacognosy Flower 3. Compositae 2023.pdfPharmacognosy Flower 3. Compositae 2023.pdf
Pharmacognosy Flower 3. Compositae 2023.pdf
 
Roles & Responsibilities in Pharmacovigilance
Roles & Responsibilities in PharmacovigilanceRoles & Responsibilities in Pharmacovigilance
Roles & Responsibilities in Pharmacovigilance
 
Software Engineering Methodologies (overview)
Software Engineering Methodologies (overview)Software Engineering Methodologies (overview)
Software Engineering Methodologies (overview)
 
Incoming and Outgoing Shipments in 1 STEP Using Odoo 17
Incoming and Outgoing Shipments in 1 STEP Using Odoo 17Incoming and Outgoing Shipments in 1 STEP Using Odoo 17
Incoming and Outgoing Shipments in 1 STEP Using Odoo 17
 

Global Learning Versus Renewable energy

  • 1. An edited version of this paper is forthcoming in the Journal of Cleaner Production The Effect of Local and Global Learning on the Cost of Renewable Energy in Developing Countries Joern Huenteler1,2 *, Christian Niebuhr1,3 , Tobias S. Schmidt1,4 1 Department of Management, Technology and Economics, ETH Zurich, Switzerland 2 Belfer Center for Science and International Affairs, John F. Kennedy School of Government, Harvard University, USA 3 School of Business and Economics, RWTH Aachen University, Germany 4 Precourt Energy Efficiency Center, Stanford University, USA *corresponding author: jhuenteler@ethz.ch; +41 44 632 97 39; +41 44 632 05 41 Abstract High upfront costs are a critical barrier for investments in clean infrastructure technologies in developing countries. This paper uses a case study of Thailand’s electricity sector to create realistic estimates for the relative contributions of local and global technological learning to reducing these cost in the future and discusses implications of such learnings for international climate policy. For six renewable electricity technologies, we derive estimates for the share of locally and globally sourced goods and services, and analyze the effects of local and global learning during the implementation of Thailand’s renewable energy targets for 2021. Our results suggest that, in aggregate, the largest potential for cost reduction lies in local learning. This finding lends quantitative support to the argument that the conditions enabling local learning, such as a skilled workforce, a stable regulatory framework, and the establishment of sustainable business models, have a more significant impact on cost of renewable energy in developing countries than global technology learning curves. The recent shift of international support under the United Nations Framework Convention on Climate Change towards country-specific technology support is therefore promising. However, our results also show that the relative importance of local and global learning differs significantly between technologies, and is determined by technology and country characteristics. This suggests that international support need to consider both the global perspective and local context and framework conditions in order to reap the full benefits of technological learning across the wide range of clean technologies. Keywords: Climate policy, Technology transfer, Technological capabilities, Technological learning, Thailand, Renewable energy 1
  • 2. An edited version of this paper is forthcoming in the Journal of Cleaner Production Highlights: • Development of a techno-economic model of Thailand’s Alternative Energy Development Plan 2012-2021 • Analysis of the impacts of local and global learning effects on mitigation cost • Demonstration that the importance of global and local learning varies between clean technologies • Finding that local learning is significant for wind, PV, biogas and micro hydro, whereas global learning is important for PV and solar thermal • Discussion of the future role of the international support for clean technologies 2
  • 3. An edited version of this paper is forthcoming in the Journal of Cleaner Production 1. Introduction The global climate policy regime needs to significantly accelerate the diffusion of clean technologies to avoid dangerous impacts from climate change (UNFCCC, 2012). In addition to actions taken by the developed world, developing countries are expected to assume greater responsibility by implementing domestic policies that contribute to both domestic economic development and climate change mitigation (Kanie et al., 2010). Indeed many developing countries are already implementing domestic climate legislation, despite the gridlock in international negotiations (Nachmany et al., 2014; REN21, 2013; Townshend et al., 2013). However, high upfront costs remain a critical barrier for large-scale investments in clean technologies, especially in developing countries (IPCC, 2012; Schmidt, 2014). How to accelerate the development and transfer of clean technologies is, therefore, emerging as a central issue in the international climate policy negotiations (Ockwell and Mallett, 2012; Pueyo et al., 2012). Experience in the industrialized world has shown that cost reductions and performance improvements of new technologies are often closely linked to policies aimed at increased production and deployment (Jänicke, 2012), driven by mechanisms collectively referred to as technological learning (Junginger et al., 2010). If successful, the increasing number of mitigation actions taken now by developing countries holds the promise to stimulate innovations and future cost reductions there as well. But technological learning encapsulates a diverse array of purposeful processes that some countries, sectors and organizations manage better than others (Bell and Figueiredo, 2012; van Hoof, 2014). Besides creating financial incentives for investment, one of the key challenges for international climate policy is therefore to actively promote technological capabilities in developing countries and to enable countries to reap the full learning benefits from mitigation investments they make and attract (Benioff et al., 2010; Bhasin, 2013; de Coninck et al., 2008; Ockwell and Mallett, 2012). Technological learning in developing countries, especially outside the largest emerging economies, follows distinct dynamics (Pueyo et al., 2011). The industries producing clean technologies are increasingly globalized (Gallagher, 2014; Lewis, 2012; Nahm and Steinfeld, 2014). Therefore, in a typical investment project, local firms in developing countries provide only part of the products and services. Learning in this share of the industry value chain is local in nature and driven by local market developments and policies – we will refer to it as local technological learning (Morrison et al., 2008; Mytelka, 2000). However, because a substantial share of components is typically sourced from abroad, the economics of local investments are also impacted by technological learning processes in other countries. For example, technological progress by Chinese solar cell producers improves the economics of solar investments around the world. This form of learning is driven more by global markets than by policies in individual countries (Peters et al., 2012). Future investment conditions for clean technologies in developing countries thus depend on a combination of global and local learning processes, which, in turn, depend on domestic and international regulatory, institutional and industrial contexts. Better understanding of the relative importance of the two can improve both domestic and international policy decisions. Using a quantitative case study, this paper estimates the effect of local and global technological learning on the cost reductions of renewable electricity generation in Thailand. We employ a techno- economic model of the country’s electricity sector to project the cost of implementing the country’s renewable energy targets for 2021 (Kamolpanus, 2013). We derive estimates for the share of locally 3
  • 4. An edited version of this paper is forthcoming in the Journal of Cleaner Production and globally sourced goods and services for six renewable electricity technologies and analyze, in different scenarios, the impact of local and global learning effects on the investment cost. Based on the results, we explore implications for the design of international low carbon technology support mechanisms. The paper makes three main contributions. First, our case study informs the academic debate as well as international negotiations on the post-Kyoto climate policy regime of the United Nations Framework Convention on Climate Change (UNFCCC). In its support for technology development and transfer, the international climate policy regime has recently shifted its attention toward national policies and local technological learning. The analysis presented in this paper enhances the understanding of the merits of this shift, and informs the design and functional specification of the new international technology support mechanisms. Our quantitative approach and the focus on mitigation cost complements existing conceptual and qualitative work on the topic (Benioff et al., 2010; Bhasin, 2013; de Coninck et al., 2008; Ockwell and Mallett, 2012). Furthermore, it contributes to the growing body of literature on the economics of clean energy technology investments in developing countries (e.g., IRENA, 2012a; Schmidt et al., 2012). Finally, our paper is among the first to investigate the impact of local and global learning separately for a specific developing country case. The next section will introduce the key theoretical constructs used in the analysis (Section 2). Section 3 introduces the case, before section 4 presents the model, the data sources, and the methodology. The results of the case study are presented in Section 5, and their policy implications discussed in Section 6. 2. Local and Global Technological Learning 2.1. Technological Learning in Developing Countries Technological learning is understood here broadly as the accumulation of technological knowledge and experience, often also referred to as technological capabilities, in individuals and organizations (Bell and Figueiredo, 2012). Research on innovation processes has shown that the technological capabilities held by firms comprises not only information codified in capital goods or documents (patents, manuals, etc.), but also includes the tacit knowledge embodied in individual skills and firm routines (Dosi, 1988; Senker, 1995). These elements of knowledge are costly to transfer and therefore highly organization-specific (von Hippel, 1994). This means that removing trade barriers and providing developing countries with intellectual property rights (IPR) and resources for technology imports is not sufficient to enable countries to catch up to the technological frontier (Bell and Pavitt, 1996; Ockwell et al., 2010). Rather, catching up requires building local technological capabilities through the cumulative, costly and time-consuming process of technological learning (Bell, 2010). Technological capabilities and learning are increasingly being recognized as significant drivers of low carbon development (Byrne et al., 2011; Lema and Lema, 2013; Phillips et al., 2013). The international climate negotiations, too, are taking notice (Ockwell and Mallett, 2012). Improved technological capabilities hold the promise of removing barriers to the diffusion of clean technologies, thereby facilitating further emission reductions in the future (Sandén and Azar, 2005). Besides its effect on mitigation cost, the local build-up of technological capabilities is crucial for local industrial 4
  • 5. An edited version of this paper is forthcoming in the Journal of Cleaner Production capacity, poverty reduction and economic growth. For many developing countries, investing in climate change mitigation is, for now, only desirable if the government can create opportunities for the local private sector to participate in the value chain of mitigation investments. However, in order to participate in the development and manufacturing of clean technologies, local firms in developing countries need to create the capacity to continuously absorb, adapt and improve new technologies (Bell and Pavitt, 1996). Climate models increasingly incorporate learning as an endogenous process driven by mitigation investments (Kahouli-Brahmi, 2008; van der Zwaan et al., 2002), but technological learning is not an automatic by-product of investments (Bell and Figueiredo, 2012). Rather, in the analysis of the development of mitigation policies and estimation of future mitigation cost, it is better understood as an opportunity that can be only adequately seized when both governments and firms create the necessary conditions. Organizations need to pursue conscious efforts to create the ability, in the form of a skilled workforce and organizational processes, to absorb the new knowledge and experience that they generate (Cohen and Levinthal, 1989). Furthermore, organizations innovate and learn through their interaction with users, suppliers, competitors, universities or regulators in systems of innovation (Fagerberg et al., 2007; Lundvall et al., 2009). The existence of formal and informal networks, as well as public funding for science and technology, are therefore critical drivers of technological learning. And, last but not least, learned capabilities degenerate rapidly if organizations have a rapid workforce turnover, face an instable regulatory framework, or pursue unsustainable business models. 2.2. Local and Global Learning Effects in Value Chains Most clean technologies are technological systems consisting of hundreds, or even thousands, of materials, components, and intermediate goods. Furthermore, mitigation investments involve numerous legal, financial, and regulatory services. The collective of technology suppliers and service providers that deliver the materials, components, products and services to deploy technologies we call the technologies’ industry value chain. Modern industry value chains are disintegrated and geographically distributed production and service networks. As markets for clean technologies have grown, their supplying industries have also globalized in recent years (e.g., Gallagher, 2014; Lewis, 2012; Nahm and Steinfeld, 2014). Globally traded components and products are often those that can be transported at relatively low cost and have standardized interfaces. (On the extreme end of this spectrum are commodities.) Globally traded services often require highly specialized technological expertise that only very few firms possess. In the wind turbine industry, for example, gearboxes, hubs, generators and bearings are components for which the know-how necessary for design and manufacturing is concentrated in only a few key firms globally. Further, the consulting services needed to make a complex product bankable, or a difficult geography accessible, are often provided by experienced, globally operating firms. For technological learning in globally traded goods and services, global market conditions matter more than where their products are finally deployed. If uncertainty about the product’s performance is very large, as in the case of carbon capture and storage technology, any demonstration will add to the global knowledge pool (de Coninck et al., 2009). In the case of smaller components, materials, or intermediate goods, producers seldom even interact with end-users, if they know them at all. In the 5
  • 6. An edited version of this paper is forthcoming in the Journal of Cleaner Production case of services, the global applicability of their experience is the key reason why globally operating producers are selected in the first place. The accumulation of capabilities in firms and industries is therefore more dependent on global, aggregate market trends than on country-specific context factors. We define learning in these goods and services as global technological learning, because, in a simplified learning model or experience curve, it would best be predicted by the size of the global market. But value chains are not entirely globalized. To stimulate local private sector participation, many climate-related laws in developing countries contain some form of provision to create a certain level of domestic content. This gives local firms economic advantages over global suppliers. But even without legislative requirements, often local firms provide many steps. This may include large and heavy components that are costly to transport, or factors which are cheaper to make at home; but it is important to note that the drivers underlying these patterns are not affected only by input or transportation cost. The drivers for localization may include the expertise required to deal with idiosyncratic geography, context-specific or fast-changing regulations, or local infrastructure and climate conditions. In a wind power project, for example, towers, blades, and foundations are typically sourced from suppliers not far from the project site, and domestic firms often provide project development, installation, operation, and maintenance services. In developing countries, it is reasonable to assume that local firms are mostly active in their home markets. We will therefore assume that their learning is predominantly local, and refer to technological learning in this part of the value chain as local technological learning. The geographical dispersion of value chains leads to cost and cost trends that differ significantly between components (e.g., Lindman and Söderholm, 2011). Cost trends and learning curves are global whenever global markets exists, while for the locally sourced components trends differ substantially between regions (e.g., Seel et al., 2014). For the latter, local economic, political, and regulatory conditions determine whether or not investments lead to the accumulation of technological capabilities, which in turn are essential to reduce local investment cost. To stimulate progress in this part of the value chain, domestic and international policymakers should focus on strengthening the domestic innovation system. For the global part of the value chain, however, which also affects domestic investment economics, national innovation systems are not very important. Here, policymakers need to work toward international knowledge sharing and standardization activities to strengthen the sectoral innovation system in order to advance low- carbon technologies (de Coninck et al., 2009). They should also strive for the global markets to remain open and try to minimize protectionism to reap the benefits of global technological learning (Lewis, 2014). 3. The Case of Thailand’s Electricity Sector 3.1. Case Selection This paper presents a quantitative case study of Thailand’s Alternative Energy Development Plan (DEDE, 2012) for the electricity sector in order to explore the relative importance of local and global learning in developing countries’ mitigation efforts. We chose a case study of the electricity sector because it lies at the heart of the climate change challenge as the single largest source of CO2 emissions among the primary sectors of the world economy (Bazilian et al., 2008). Indeed, the 6
  • 7. An edited version of this paper is forthcoming in the Journal of Cleaner Production majority of national mitigation policies in developing countries target energy production and consumption in the industrial, energy supply, buildings, and transport sectors (van Tilburg et al., 2013). At the same time, the diversity of technologies in the electricity sector and their globally operating technology providers allows us to model both local and global learning processes. We chose Thailand as case study for three reasons. First, the country has clear, broad and ambitious targets for renewable energy diffusion which allow us to study the impact of different learning conditions on the cost of an existing policy. Second, the country’s government publishes detailed data on energy production and consumption that allow us to model the electricity sector on a single- plant level. Third, the country faces economic and political challenges that make the framework conditions for its energy policy decisions representative of a large number of other middle-income countries. A country of 66.9 million with a GDP per capita at USD 5,210, Thailand has managed to provide its population with almost universal access to electricity (The World Bank, 2014). Like many other middle-income countries, it now faces the challenge of rapidly growing energy consumption, accompanied by growing carbon emissions, import dependency, national security concerns and local resistance to fossil and nuclear power plants. How to assist emerging economies in managing these challenges while simultaneously reducing carbon emissions will be one of the most important questions for international climate policy in the coming decades. 3.2. Trends and Challenges Primary energy consumption in Thailand has almost tripled from 1990 to 2011, making it the second- largest energy consumer in the Association of Southeast Asian Nations (ASEAN), while subsequently its greenhouse gas (GHG) emissions grew by 177.5% (see Figure 1). The power sector is the largest carbon source, with a share in national emissions that grew from 33% in 1990 to 42% in 2011. By 2035, energy consumption and GHG emissions are expected to roughly double yet again (IEA, 2013a). Thailand is already a net importer of oil, gas and coal, and is projected to become the most energy import-dependent country among the ASEAN by 2035, with imports estimated to increase to about 90% of consumed oil and gas (IEA, 2013a). Nakawiro et al (2008) estimate that gas and coal import costs will grow from 0.92% of the country’s GDP in 2011 to 2.19-2.69% in 2025, depending on the development of fuel prices in the region. The main domestic sources are not without challenges, too, in light of strong local opposition to nuclear power and new coal plants (Greacen and Bijoor, 2007; Pongsoi and Wongwises, 2013).1 1 The first nuclear plant was originally scheduled to come online in 2020, but was postponed to 2026 after the nuclear incidence in Fukushima, Japan, in 2011. 7
  • 8. An edited version of this paper is forthcoming in the Journal of Cleaner Production Figure 1: Thailand’s carbon emissions by sector (a) and future projections for emissions from the country’s power sector (b). 1 CO2 emissions from power sector do not contain imports. Data from EPPO (2013, 2012a). As of 2011, the electricity sector is dominated by natural gas (67%), with lignite and hard coal providing together about 20% as well (Figure 2). Besides large hydropower (5%), renewable energy constitutes only a very small part of the electricity mix, mostly in the form of biomass (1.4%) (EPPO, 2012b). The remaining demand is covered by direct electricity imports (6.6%). Electricity generation reached 162 TWh in 2011 and is projected to increase by more than 4% annually (EPPO, 2012b, 2012c). Besides domestic capacity investments, the government plans to meet demand by increasing the share of direct electricity imports from neighboring Malaysia and Laos to 13% in 2030 (Figure 2). Figure 2: Development of the fuel mix in Thailand’s power sector from 1987 to 2030. 1 The renewables wedge contains hydropower after 2011; the share of renewables after 2012 reflects relatively conservative projections of the Power Development Plan. Data from EPPO (2013, 2012a). 3.3. Targets and Support for Renewable Energy In recent years, electricity sector planning initiatives have begun to consider renewable energy as a potential remedy for some of the problems the country faces. Thailand has no official renewable energy law at this point but several comprehensive long-term energy plans (Tongsopit and Greacen, 2013). The two most important are the Power Development Plan by the Energy Policy and Planning 250 200 150 100 50 0 201020052000199519901987 0 50 100 150 200 250 203020252015 20202011 Other Power GenerationTransportIndustry CO2-eq emissions from power generation1 Power generationGDP b) Projections, 2011=100 Carbon emissions in Thailand a) Historic emissions [in million tons CO2-eq] 5% 67% 8% Lignite 12% Natural gas 1% Imported 7% Fuel oil & diesel 1% Coal 2011 (total :162.3 TWh) 350 300 250 200 150 100 50 0 201020001990 20302020 LigniteRenewables1Imported electricity Fuel oil & diesel Coal Natural gasHydro Estimates Renewables Hydro Planned fuel mix of the electricity sector in Thailand 1987-2030 Electricity production by source, TWh 8
  • 9. An edited version of this paper is forthcoming in the Journal of Cleaner Production Office (EPPO, 2012c) and the Alternative Energy Development Plan (AEDP) by the Department of Alternative Energy Development and Efficiency (DEDE, 2012; Kamolpanus, 2013), both under the Ministry of Energy. The AEDP, updated in 2013, is aiming to increase the renewable energy in the power sector to 14 GW by 2021, or 24% of the total capacity (compare with Figure 2). As shown in Figure 3, the largest part of this capacity is projected to come from biomass (4.8 GW), followed by biogas (3.6 GW), solar power (3 GW), wind power (1.8 GW) and micro hydro (324 MW).2 The largest relative increase is targeted for biogas (17-fold) and wind energy (15-fold). It is notable that large hydro is not part of the AEDP. For simplification, we therefore use the term ‘renewable electricity’ in this paper to refer to non-large-hydro renewable electricity technologies. Figure 3: Targets for renewable electricity under Thailand‘s Alternative Energy Development Plan (DEDE, 2012). Data for 2012 are from DEDE (2013); updated targets for 2021 from Kamolpanus (2013). In addition to public research, tax incentives, venture capital and investment grants, the primary government policy to induce renewable energy investments is currently a feed-in tariff premium scheme, referred to as ‘FIT adder’ (DEDE, 2012; Tongsopit and Greacen, 2013). The FIT adder program provides a purchase guarantee under which fixed premiums, which differ by technology, capacity and project location, are paid on top of a base tariff that is determined by the utility’s avoided cost. Originally implemented in 2007, the official objectives of the FIT adder policy included enhanced levels of renewable energy generation; private sector involvement; economic growth and rural development; diversification of the fuel mix; local pollution reduction and utilizing agricultural wastes; as well as local equipment manufacturing and thus reduced international equipment imports (Tongsopit and Greacen, 2013). In 2010, Thailand’s government announced plans to transform the FIT adder into a fixed FIT, but has done it so far only for rooftop solar PV (Kamolpanus, 2013). There is no local content requirement in Thailand’s renewable electricity support policies, but import duties create incentives to source locally (Beerepoot et al., 2013).3 2 The targets include another 400 MW of municipal waste incineration plants. 3 These import duties were not considered in our analysis. 10243112377193 324400 1,800 3,000 3,600 MSWPVBiogasBiomass 4,800 MW 1,960 MW +1,761% +697% +145% +836% Wind +1,511% Micro Hydro +218% Targets for 2021Status end of 2012 2,786 MW +400% Total renewables (excluding large hydro) 13,924 MW Targets for renewable energy development in Thailand in 2012-2021 Electric power generation capacity by source, MW 9
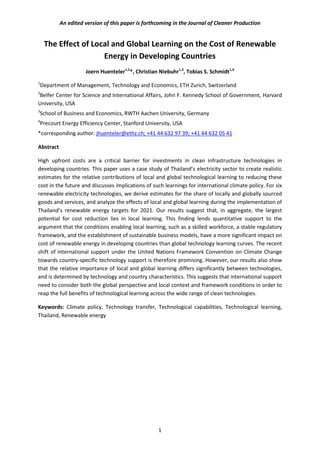
  • 10. An edited version of this paper is forthcoming in the Journal of Cleaner Production 3.4. Local and Global Learning in Renewable Energy in Thailand As developed in Section 2, modern clean technology value chains feature significant local and global value creation. To illustrate how the local and global aspects of the value chain play out in Thailand, the value chain of a typical project in the electricity sector in Thailand is shown in Figure 4. Displayed is a value chain of a solar PV project, including the primary value chain, from material and component suppliers, up to the grid operator, and secondary activities such as universities, consultancies or legal services. For one specific project, a 9.5 MW solar PV project in Mae Chan in Chiang Rai province developed in 2013, we identified the most likely countries of origin for each value chain step. In the depicted case the project operator, the grid operator, the construction company, one of the two project developers, (probably) legal and financial services, and the regulator are local, while no core hardware components were manufactured in Thailand. The modules are manufactured by a Norwegian company in Singapore, while the inverters are made by a Swiss-Swedish company, most likely in Estonia. The leading production equipment suppliers, material suppliers and research institutes are located in Europe, the United States and Australia, thus it is almost certain that all these countries/continents are also represented in the value chain. The economics of the final project are determined by progress by all these actors in a concurrence of local and global learning effects, which calls for policy support that strengthens learning conditions locally and globally to facilitate overall technological progress. Figure 4: Value chain for an exemplary solar PV project in Thailand. Country codes as defined by UN Statistics Division; EU stands for European Union. Company identification from news sources. Consulting, legal advice, financial services Cell/Module manufacturers Production equipment Logistics and installation services Materials suppliers R&D, certification & testing services University research and education EPC, project development Component suppliers Power producers, O&M Regulators Grid operator Supportive activities Primary value chain THA THA THA THA THA NLD ESPCHE SWE NOR SGP CHE USA DEU USA NOR EU EU EUUSA AUS USA SGP EU Flow of goods and services Origin of actor Origin estimated THA EST Local and global value chain for a solar PV power project in Thailand Origin of actors in value chain of Sonnedix‘s 9.5 MW project in Mae Chan, Chiang Rai 10
  • 11. An edited version of this paper is forthcoming in the Journal of Cleaner Production 4. Materials and Methods 4.1. General model framework We developed a model of Thailand’s electricity sector and used different scenarios to estimate the effects of technological learning on the cost of achieving the Alternative Energy Development Plan (AEDP) targets. We chose a bottom-up, techno-economic model (Berglund and Söderholm, 2006) because it allows us to study the effects of cost dynamics on the technology-level on the aggregate cost of renewable energy policies (Kahouli-Brahmi, 2008). To model the effects of learning on the cost of technologies, we chose the learning curve approach because it enables us to treat local and global effects separately (Hayward and Graham, 2013). We focused on six renewable energy technologies under the AEDP: biomass, biogas, micro hydro, on-shore wind, solar PV, and concentrating solar power (CSP). Figure 5: Relationships between key input and output metrics in the techno-economic model; the upper half of the graphic shows variables calculated on the technology-level; the lower half shows variables calculated for the entire electricity sector/policy. The overall structure of the model with its key variables and relationships is depicted in Figure 5. Calculating the cost of renewable electricity is a well-established process in renewable energy policy analysis (Burtraw et al., 2012). The cost of the avoided electricity, however, even though at least equally important, are often neglected (Schmidt et al., 2012). To obtain the cost of avoided electricity and the avoided greenhouse gas emissions, we compared different scenarios for diffusion of renewable energy with a hypothetical scenario without any renewables diffusion. Based on this comparison, the model provides two main outcome metrics, shown in dark grey in Figure 5, to assess the policy support needed to achieve Thailand’s renewable electricity targets: the incremental policy cost and the mitigation cost, both stated as net present value.4 The former is a proxy for marginal 4 The incremental costs and the mitigation costs are discounted to the year 2012 with the yield of 40-year Thai government bonds, which reflects the refinancing cost of the Thai government over the period of the assumed feed-in Tariff payments. Technology level Sector level LCOE (i, t) Cost of generation by source (i, t) Carbon credits (i,t)* Cost of avoided generation (t) Total cost of generation (t) Incremental cost of policy (t) Capital and O&M cost (i, t) Fuel Cost (i, t) Debt & equity rates (i) Fossil plant pipeline (t) Globally installed capacity (i, t) Learning rates (i) Locally installed capacity (i, t) Resource potential / full-load hours (i, t) Tax and depreciation rules Carbon emissions (t) Fuel mix (t) Mitigation cost of policy (t) Input / assumptions Intermediate outputs Output metrics Model structure Key relationships between input and output variables (function of technology i, year t) 11
  • 12. An edited version of this paper is forthcoming in the Journal of Cleaner Production social cost (Palmer and Burtraw, 2005), while the latter allows comparisons between different mitigation measures and carbon prices. How the scenarios deviate from the non-renewables scenario is calculated on the sectoral level. The incremental costs represent the difference between the total cost of renewable electricity and the total cost of avoided electricity (Schmidt et al., 2012). The mitigation costs are calculated based on the total carbon emission reductions from the AEDP and the incremental cost: (𝑖) 𝐼𝑛𝑐𝑟𝑒𝑚𝑒𝑛𝑡𝑎𝑙 𝑝𝑜𝑙𝑖𝑐𝑦 𝑐𝑜𝑠𝑡 = 𝐶𝑜𝑠𝑡 𝑜𝑓 𝑟𝑒𝑛𝑒𝑤𝑎𝑏𝑙𝑒 𝑒𝑙𝑒𝑐𝑡𝑟𝑖𝑐𝑖𝑡𝑦 − 𝐶𝑜𝑠𝑡 𝑜𝑓 𝑎𝑣𝑜𝑖𝑑𝑒𝑑 𝑒𝑙𝑒𝑐𝑡𝑟𝑖𝑐𝑖𝑡𝑦 [𝑖𝑛 𝑈𝑆𝐷 𝑜𝑟 𝑈𝑆𝐷 𝑀𝑊ℎ ] (𝑖𝑖) 𝑀𝑖𝑡𝑖𝑔𝑎𝑡𝑖𝑜𝑛 𝑐𝑜𝑠𝑡 = 𝐼𝑛𝑐𝑟𝑒𝑚𝑒𝑛𝑡𝑎𝑙 𝑐𝑜𝑠𝑡 𝐴𝑣𝑜𝑖𝑑𝑒𝑑 𝑔𝑟𝑒𝑒𝑛ℎ𝑜𝑢𝑠𝑒 𝑔𝑎𝑠 𝑒𝑚𝑖𝑠𝑠𝑖𝑜𝑛𝑠 [ 𝑈𝑆𝐷 𝑡𝐶𝑂 2 ] For each of the renewable and fossil technologies in the sector we calculated the cost of electricity generation for each year of the considered period. The cost of renewable electricity and the cost of avoided electricity were then aggregated from the technology-level calculations. The cost of renewable electricity was aggregated over the renewable technologies under the AEDP in 2013-2021 (details in Section 4.2). The cost of avoided electricity was aggregated over the 9 main fossil technologies from 2013, when the electricity is displaced, to 2040, when the last renewable plant goes offline. How we calculated the avoided cost and avoided emissions is explained in detail in Appendix A. 4.2. Cost of Renewable Electricity Generation 4.2.1. Generated Electricity The electricity generated by each source of renewable electricity is a function of the diffusion path and the plant utilization. Since the AEDP does not contain interim targets, we modeled the diffusion of the six considered technologies as a linear increase in installed capacity. The split between PV and CSP in the (undifferentiated) total solar target is assumed as a relation of 9 (PV) to 1 (CSP). All renewable electricity is assumed to be fed into the grid (no curtailment), so the plant utilization is a mere function of the resource potential. In the case of micro hydro, biogas and biomass, for which significant domestic experience exists, we took the capacity values from domestic academic sources (Delivand et al., 2011; Pattanapongchai and Limmeechokchai, 2011a; Promjiraprawat and Limmeechokchai, 2012). For wind, solar PV and CSP we estimated the capacity factors based on resource information from the IRENA global atlas (3Tier layer; IRENA, 2014). 4.2.2. Cost Per Unit of Generated Electricity To model the cost of electricity, we assumed that the government supports each technology with an inflation-adjusted, fixed feed-in tariff (FIT). A 20-year lifetime for all investments in 2013-2021 implies FIT payments in the period 2012-2040. The FIT rates for each technology are assumed to exactly reflect, at any point in time, the technology’s levelized cost of electricity (LCOE) (Waissbein et al., 2013): 12
  • 13. An edited version of this paper is forthcoming in the Journal of Cleaner Production 𝐿𝐶𝑂𝐸𝑖,𝑡 = 𝑆𝐸 ∗ 𝐼𝑁𝑉𝑖 + ∑ 𝑂𝑃𝐸𝑋𝑖,𝑡 + 𝐶𝐷𝑖,𝑡 − 𝑇𝑅 ∗ �𝑂𝑃𝐸𝑋𝑖,𝑡 + 𝐼𝐸𝑖,𝑡 + 𝐷𝑃𝑖,𝑡� (1 + 𝑅𝑂𝐸) 𝜏 𝑇 𝜏=0 (1 − 𝑇𝑅) ∗ ∑ 𝑃𝑖,𝑡 ∗ 𝐶𝐹𝑖,𝑡 ∗ 8760ℎ (1 + 𝑅𝑂𝐸) 𝜏 𝑇 𝜏=0 An equity investor perspective was adopted by modeling the cash flows generated for every technology on a single plant basis (Dinica, 2006). The determinants of the LCOE of a technology i in year t are thus the share of equity (SE), the total investment cost (INV), the operational expenses (OPEX), including operation, maintenance and fuel cost, and the cost of debt (CD), which includes the interest expenses and capital payments of the debt-financed investment share in a fixed-rate, 10- year loan. A fixed corporate tax rate (TR) was assumed to apply to all income minus OPEX, interest expenses (IE) and annual depreciation (DP). The annual revenues from electricity generation are determined from the net electric capacity (P) and the time- and technology-specific capacity factor (CF; see below). ROE is the after-tax return on equity that an investor requires taking into account the risk-free rate as well as political, market and technology risks in the designated location. For system integration cost of variable renewable energy technologies (PV, CSP and wind), we considered an additional average of 0.0115 USD/kWh to account for balancing and grid integration cost (IEA, 2008). Table 3 and Table 6 in the appendix provide an overview over the input parameters for renewable energy technologies and key sector-wide assumptions used in our model. 4.2.3. Local and Global Learning The cost of renewable electricity is assumed to decrease over time as technological capabilities accumulate in the industry (compare Section 2). In particular, the initial investment cost and the fixed O&M cost of technology I were modeled as a function of local and global cumulative installations (Ylocal and Yglobal), learning rates and diffusion over time: (𝑖𝑖𝑖) 𝐼𝑁𝑉𝑖,𝑡 = 𝛼𝑖,𝑙𝑜𝑐𝑎𝑙 ∗ 𝐼𝑁𝑉𝑖,𝑡−1 ∗ � 𝑌𝑖,𝑙𝑜𝑐𝑎𝑙,𝑡−1 𝑌𝑖,𝑙𝑜𝑐𝑎𝑙,𝑡−2 � 𝑙𝑛(1−𝐿𝑅𝑖,𝑙𝑜𝑐𝑎𝑙) ln 2 + 𝛼𝑖,𝑔𝑙𝑜𝑏𝑎𝑙 ∗ 𝐼𝑁𝑉𝑖,𝑡−1 ∗ � 𝑌𝑖,𝑔𝑙𝑜𝑏𝑎𝑙,𝑡−1 𝑌𝑖,𝑔𝑙𝑜𝑏𝑎𝑙,𝑡−2 � 𝑙𝑛(1−𝐿𝑅𝑖,𝑔𝑙𝑜𝑏𝑎𝑙) ln 2 [ 𝑈𝑆𝐷 𝑘𝑊 ] (𝑖𝑣) 𝑂&𝑀 𝑐𝑜𝑠𝑡𝑖,𝑡 = 𝛽𝑖 ∗ 𝐼𝑁𝑉𝑖,𝑡 [ 𝑈𝑆𝐷 𝑘𝑊ℎ ] To separate the effects of local and global technological learning, we split up the investment cost into locally and globally sourced components (αi,local and αi,global). The learning rate LR, too, is differentiated for local and global learning (LR,local and LR,global) (Hayward and Graham, 2013). The cost structures of different renewable technologies were taken from the literature (sources listed in Table 1). The estimates for the share and type of locally sourced components are based on a survey of news reports on renewable energy projects implemented in Thailand and interviews with local renewable energy investors. In the news report analysis, we coded the companies and main components involved renewable projects in Thailand (such as the Mae Chan PV project shown in Figure 4) according to the type of service or component they provided and the location of business (domestic / international)5 . The interviews were used to verify the findings about the general patterns of locally sourced components. The information on typical sourcing strategies was then linked to the technology-specific cost structure data to obtain estimates of local and foreign cost shares, to which we applied local and global learning rates obtained from the literature (see Table 1). 5 We considered local manufacturing as local sourcing, even when it is the result of foreign direct investment. 13
  • 14. An edited version of this paper is forthcoming in the Journal of Cleaner Production In the initial specification, our model used high but realistic estimates for the local share, as presented in Table 1. For all six considered renewable technologies, we assumed that grid connection, EPC (engineering, procurement and construction) and heavy, bulky components are sourced locally, while the core of the electro-mechanical conversion system is sourced globally. This rule leads to very different local shares: from 43% in the case of PV up to 87% for micro hydro. To assess the sensitivity to these assumptions, a second set of model specifications (see section 4.3) uses more pessimistic estimates for local private sector participation (values given in Table 5 in the appendix). A third set of model specifications assumes a cost markup of 20% for all local components in wind, solar PV and CSP, which are relatively new technologies in Thailand. Table 1: Split between locally and globally sourced components by technology Technology Locally sourced parts Globally sourced parts Cost split local/global Learning rate local/global) Wind Grid connection; engineering; procurement & construction; foundation; rotor blades; tower Nacelle (including electrical machinery, power electronics & control system) 67%/33%a 11.3/4.3e PV Grid connection; engineering; procurement & construction; balance of system excluding inverter PV modules; inverter 43%/57%b 17/20e CSP (solar tower)f Grid connection; engineering; procurement & construction; solar field Power block; heat transfer fluid cycle 67%/33%b 14.6/14.6e Biomass (anaerobic digestion)f Grid connection; engineering, procurement & construction; fuel shredder; boiler; heat exchanger; piping Steam turbine and electric generator (prime mover); flue gas and water treatment 75%/25%c 5/5d Biogas Grid connection; engineering, procurement & construction; fuel handling; balance of system; 75% of converter system Gas engine (prime mover); 25% of converter system 78%/22%d 5/5d Micro hydro Grid connection; engineering, procurement & construction; 50% of electro-mechanical equipment 50% of electro-mechanical equipment 87%/13%c 5/5d a IRENA (2012b); b NREL (2012); c Delivand et al. (2011); d Mott McDonald (2011); e Hayward & Graham (2013); f For both CSP and biomass a range of technological options exists, of which we chose one each to simplify the model; we chose anaerobic digestion because it is the dominant technology in Thailand (JIE, 2008), and solar tower because it represents 43% of the global near-term project pipeline (Hering, 2012). 4.3. Model Specification and Scenarios Different model specifications were created to evaluate the learning effects, to gauge the impact of key assumptions, and to compare learning effects to other policy priority areas (see Table 2). Models A-L were specified to investigate the impacts of local and global learning. The first four, A-D, assume the local shares estimated in Table 1 and only differ by the learning rates. Model A assumes no learning at all (learning rates set to zero) and serves as base-case scenario, while model B and C estimate the separate effects of local and global learning, respectively, and model D estimates the full joint effect of local and global learning. Models E, F, G and H follow the specifications of models A-D, but use a more conservative estimate of the share of local components (values are given in Table 5 in the Appendix). The models I, J, K and L, too, mirror models A-D, but account for the uncertainty about the initial cost of locally produced components by assuming a markup of 20%6 on all local components in wind, solar PV and concentrating solar power. Finally, model GL assumes that no components are locally sourced and global learning opportunities are fully exploited. 6 The mark-up of 20% is within the range of mark-ups implicitly assumed in policies such as Turkey’s Renewable Energy Law 2010 (IEA and IRENA, 2013). 14
  • 15. An edited version of this paper is forthcoming in the Journal of Cleaner Production The last two models, CARBON and FINANCE, were specified to allow a comparison of the magnitude of learning effects to those of other suggested policy priority areas for international support. In model CARBON, we assumed a global carbon price of USD 15 to reflect a reinvigorated global carbon market from which renewables projects can raise additional financing. Model FINANCE assumes that both debt and equity cost are reduced by one percentage point to estimate the impact of improving financing conditions through policies that reduce investor risks. Table 2: Model description and specification; all models assume local diffusion of renewable technologies according to AEDP targets and global diffusion according to predictions in IEA (2013b) a . Model Description Implementation Purpose A or base- case AEDP targets implemented, but neither local nor global diffusion leads to learning Learning rates LRlocal and LRglobal set to 0 Estimate cost without learning B Same as A, but local industry realizes learning opportunities from diffusion LRlocal >0; LRglobal =0 Estimate effects of local learning C Same as A, but global industry realizes learning opportunities from diffusion LRlocal =0; LRglobal >0 Estimate effects of global learning D Same as A, both local and global industries realize learning opportunities from diffusion LRlocal and LRglobal>0 Estimate full effects of learning E, F, G, H Same as A-D, but lower share of local components Reduced local share; values in Table 5 in the Appendix Estimate sensitivity to share of local cost; account for variance between projects I, J, K, L Same as A-D, but cost markup for local components technologies that are new to Thailand 20% cost markup for local components in wind, PV, CSP Estimate sensitivity to initial local component cost; account for uncertainty about initial cost GL Same as C, but no local content No local content; LRglobal >0 Evaluate value of local component sourcing CARBON Same as A, but renewables projects benefit from carbon credit sales LRlocal =0; LRglobal =0; carbon price USD 15 for 10 years; credits generated according to methodology of Clean Development Mechanism Compare learning effects to impact of a functioning global carbon market FINANCE Same as A, but renewables projects benefit reduced financing cost LRlocal =0; LRglobal =0; the investor’s expected rate of return and the lending rate for renewables are reduced by 1%-point Compare learning effects to impact of derisking activities a Local installation data for 2012 from DEDE (2013); global installations in 2011 for solar, CSP and wind from IEA (2013b); for biomass and biogas from IRENA (2012c); and for micro hydro from IRENA (2012d). 5. Results 5.1. Impact on the Electricity Mix Our model predicts that, if the AEDP targets are achieved, Thailand will increase its share of non- large-hydro renewables in the electricity sector from 6 to 24%, as shown in Figure 6. Biomass (47%) and biogas (36%) are responsible for most of this increase, given their high capacity increases and high plant utilization. Solar PV and wind contribute 8% and 7%, respectively, while CSP and micro hydro each produce 1%. Increasing by a total of over 11 GW, the diffusion of renewable energy reduces the pressure to install new conventional power plants. The construction of some coal power plants will be delayed – the capacity in 2021 is 800 MW lower with the AEDP targets implemented – but the most significant effect is on natural gas. In 2021, the installed capacity is 3,600 MW lower than in the case without additional renewable capacity; this leads to a drop of natural gas in the fuel mix from 59 to 46% (see Figure 6b). If all construction delays caused by the diffusion of renewables in the modeled period 15
  • 16. An edited version of this paper is forthcoming in the Journal of Cleaner Production 2013-2040 are aggregated and stated in MW-years (MWa), natural gas power plants are delayed by 62,250 MWa; coal power plants by 8,850 MWa; nuclear by 8,000 MWa and diesel plants by 1,250 MWa. In terms of displaced electricity, too, natural gas is affected most (654 TWh in 2013-2040), followed by coal (145 TWh), nuclear (90 TWh), lignite (61 TWh) and diesel (5 TWh). In total, our model estimates that the AEDP targets avoid a total of 956 TWh of conventional electricity and 455.7 million tons of CO2. Figure 6: Impact of the AEDP targets on the fuel mix in the electricity sector in 2021 5.2. Incremental Policy Cost and Effects of Learning Since we are assuming fixed feed-in tariff payments over a 20-year lifetime for each installation, the cost of the increase in renewable electricity is spread over the period 2013-2040. The annual payments increase linearly with the capacity additions in 2013-2021 to a maximum of almost USD 5bn per year, staying flat until the first added plants retire in 2032 and then dropping to zero (as shown in Figure 7). The savings from avoided conventional electricity production follow a similar path, with small variations between years caused by the delay of large fossil plants. 6% 59% Other 0% Renewables Hydro 3% Imported 13% Coal 12% Lignite 6% Natural gas 2021: Fuel mix for base case (total: 255.6 TWh) 2021: Fuel mix with AEDP targets (total: 255.6 TWh) a) b) 24% 46% 3% Imported 13% Coal 8%Lignite 6% Other 0% Hydro 2021: Fuel mix within renewables share (total: 62.0 TWh) c) 47% 8% Biogas 36% Biomass Micro hydro 1% Wind 7% CSP 1% Solar PV Renewables Fuel mix in 2021 with and without AEDP targets Electricity production by source, TWh 16
  • 17. An edited version of this paper is forthcoming in the Journal of Cleaner Production Figure 7: Payments for renewable electricity under the AEDP and avoided fossil electricity over time The total cost of reaching the AEDP targets as well as the model’s two main outcome metrics, the (discounted) incremental policy cost and the carbon mitigation cost, are depicted in Figure 8 for the different learning scenarios. For the base case, the FIT payments supporting the renewable energy installations add up to a total of USD $74.75bn in 2013-2040, while the cost of the avoided conventional electricity reach an aggregate of $61.43bn over the same period. The remaining, incremental policy cost is thus $13.3bn, which corresponds to a mitigation cost of $29.2 per ton of CO2.7 By exploiting the local and global learning effects, this incremental policy cost can be reduced significantly. If both learning effects are fully exploited in the standard specification of the model (model D), the incremental policy cost drops by about 80% to $2.6bn. If most components are sourced globally (model H), the effect is less strong, but the cost is still reduced by $8.8bn (66%) to $4.5bn. Through learning, the incremental cost falls below the original base-case cost to $4bn, even if initial cost is assumed to include a 20% markup for local components. The models CARBON and FINANCE, not shown in Figure 8, help put the learning effects in perspective: A $15 carbon price would reduce incremental cost from $13.3bn to $7.52bn, while a reduction of one percentage point in the weighted cost of capital would reduce it to $9.88bn. Across all models, the effect of local learning outweighs that of global learning. Figure 8 shows the results for incremental and mitigation cost of all 12 different learning scenarios. If a high share of local sourcing is assumed (models B-D), local learning can reduce the incremental cost by $6.7bn, while global learning can further decrease them by $3bn. This strong effect of local learning is robust across all considered model specifications. In the models that assume a low local component share (E-H), local and global learning reduces the incremental cost by 36% and 31%, or $4.7bn and $4.1bn, respectively. When a mark-up of 20% is considered (models I-L), local learning shaves 47% ($8.5bn) off the incremental cost, while local learning reduces them by 19% ($3bn). 7 If distributed as a surcharge on the electricity bill, these incremental cost would peak at about c$0.3 per kWh in 2020, or about 3% of the average retail electricity price (Ruangrong, 2012). 5 4 3 2 1 0 -2 -3 -4 -5 204020352030202520202015 Incremental costCost of FIT payments Avoided cost Cost of AEDP targets over time Total payments for FIT and total avoided cost [in billion USD2012, discounted] 17
  • 18. An edited version of this paper is forthcoming in the Journal of Cleaner Production Figure 8: Total cost of supporting the AEDP targets in 2021 in different learning scenarios Another important finding is that strong local private sector participation, represented in the models by a high share of local components, can reduce mitigation cost beyond the reductions possible under a purely global value chain. This can be seen when comparing model GL with models D, H and L – the incremental cost in all three models are significantly lower than in GL. Indeed, the effect of local learning alone exceeds the total learning effect in GL in all but model F, the model with a low share of local content. 5.2.1. Differences Between Technologies The effects seen on the global level are more nuanced when looking at the effects by technology. Figure 9 shows the LCOE of all technologies in 2021 for different scenarios. It can be seen that, overall, the learning effect is strongest for CSP (-54%) and PV (-43%) and weakest for micro hydro (- 8%) and biomass (-3%). Similar differences are visible for the relative importance of local and global learning. The effect of local learning is much stronger for CSP, with 41% and 13% reduction, respectively, whereas global learning is more relevant for PV (25% compared to 18%). Local learning also outweighs global learning for wind, biogas and micro hydro. However, in biomass, both are not very significant. Cost of AEDP targets in different models a) Total feed-in tariff payments for renewable electricity 2013-2040 [in billion USD 2012, discounted] 0 20 40 60 80 100 Avoided cost USD 61.43bn Avoided cost GLLKJIHGFEDCBA High share of local content 4.0 15.6 4.5 9.210.3 5.6 0 5 10 15 20 IHGF 8.6 E 13.3 D 2.6 CBA 13.3 GL 6.9 LK 12.6 J 7.1 8.99.8 20.218.9 29.229.2 0 10 20 30 40 GL 15.2 LK 27.6 J 15.5 IHGFED 5.6 C 22.5 B 12.3 A Low share of local content 20% markup for local content No local content No learning Local learning Global learning Local and global learning b) Incremental cost [in billion USD2012 ] c) Mitigation cost [in USD2012 per ton of CO2-eq ] 34.2 18
  • 19. An edited version of this paper is forthcoming in the Journal of Cleaner Production Figure 9: Effect of technological learning on the levelized cost of different renewable energy technologies in 2021. *The presented cost for fossil fuel electricity represents marginal cost of newly built power plants; the fuel cost reflect import prices of coal, diesel and natural gas (see Table 4 in the attachment). 6. Discussion 6.1. How to Tap Local Learning Potentials? The climate policy regime that emerges for the post-2020 period foresees that developing countries will pursue domestic policies that deliver on both climate and development objectives. In the view of national governments, local private sector participation in the value chains of low carbon investments holds the promise of creating employment and growth opportunities. At the same time, as our model results suggest, it can help to reduce the long-term cost of emissions mitigation. The process linking these two objectives is local technological learning. Our calculations imply that local learning can reduce the cost of renewable electricity to the point where they are very close to competitiveness with fossil fuels. But how can developing countries realize the learning opportunities that our model predicts are possible? And how can the international institutional framework assist developing countries in this agenda? Our case study of Thailand’s electricity sector highlights that the cost reduction opportunities from local learning depend on three interlinked factors: the (cumulative) local installations at the beginning of the analyzed period, which can be understood as proxy for the maturity of the domestic industry; the average share of locally sourced components; and the rate of local learning in the different technologies. First and foremost, the potential for future cost reductions from technological learning is determined by the (cumulative) size of the existing domestic market. The projected learning potentials in our model are highest for technologies that are new to Thailand, such as solar PV and CSP, while mature industries, such as biomass, exhibit limited opportunities to radically alter the cost structure of future investments. 0 5 10 15 20 25 30 35 IGCClignite Nuclear Gasturbine CCGTgas IGCC Subcriticalcoal Subcriticallignite Supercriticalcoal Wind Solar PV CSP Biomass Biogas Micro hydro No learning (model A) Local learning (B) Global learning (C) Local and global learning (D) Marginal cost of displaced electricity* Levelized cost of renewable electricity in 2021 in different models LCOE for [in cUSD2012 per kWh] 19
  • 20. An edited version of this paper is forthcoming in the Journal of Cleaner Production The share of local components, the second factor, depends crucially on the availability of local components, which in turn depends on the amount of prior local investment in building up production capacity by firms along the industry chain. Any such investment will hinge on a credible, long-term market perspective (Pueyo et al., 2011). But besides their availability, the share of locally sourced components also depends on their competitiveness. Research has presented ample evidence that the competitiveness of local firms is the result not only of factor cost, or hardware imports, but also their stock of technological capabilities (Bell and Figueiredo, 2012). Without the necessary capabilities – i.e., if the initial markup is too high – local firms might never be able to enter the virtuous cycle of learning and new investments. Even if the investment comes from foreign firms, it will require complementary local capabilities to be “absorbed” effectively (Bell, 2010). Local technological capabilities depend on domestic private and public investments, in the form of a skilled workforce, local science and technology infrastructure, as well as firm networks and coordinating actors. International factors, such as the conditions for access to state-of-the-art technology, also play an important role for the local private sector to produce competitive products and services. Lastly, the third and most important factor in our model that determines the potential for learning to reduce cost compared to the base case is the rate of learning. If the learning opportunities are not seized, a large share of locally sourced components does not yield any benefit in terms of mitigation cost. Indeed, if there is a positive markup, it might actually be counterproductive, at least from a cost perspective. The extent to which industries can reap the benefits of learning is determined by the opportunities to create new knowledge from experience, but also by the processes that govern the dissemination, utilization and retention of the created knowledge (Bell and Albu, 1999). These processes can be shaped and enhanced by domestic governments and international support mechanisms. 6.2. Implications for Domestic Policy Our results suggest that the governments of developing countries should pursue any investments in low carbon infrastructure with the explicit target of seizing the opportunity to build up local technological capabilities. First and foremost, whether low carbon investments can promote learning is determined by the nature of the policies that attract this investment. Experience in developed countries has shown that technological capabilities can best be created under stable and predictable market conditions (IRENA, 2013). Developing countries can create such conditions domestically through long-term targets and stable regulatory frameworks, as well as a clear allocation of responsibilities in the public sector. Options to promote industry-wide learning through efforts targeted at the dissemination, utilization and retention of created knowledge include investments in collaborative research programs that accompany and monitor infrastructure technology; public institutions for testing and certifying technology; requirements for beneficiaries of government support to publish non-sensitive information on cost and performance of the technologies; and the creation of government-led platforms for knowledge exchange. Apart from the need for efforts targeted at learning, the case study also suggests that policies to subsidize early local private sector participation can be a good investment. By lowering entry barriers in the beginning, public support can create conditions that enable learning, which, in the long term, lowers overall cost beyond what would have been possible with purely foreign suppliers. But such a policy needs to be designed with a clear target and procedure to review and eventually phase out support. Furthermore, direct subsidies for local sourcing of specific components carry the risk of 20
  • 21. An edited version of this paper is forthcoming in the Journal of Cleaner Production wasting public resources on subsidizing the production of components that are too costly, or too complex, to yield any local learning effects. Nevertheless, if they are focused on technologies and components for which technical expertise is available (or attainable), and if they are linked to efforts to build technological capabilities, our model suggests that local content policies can deliver on both development and cost reduction objectives (see also Johnson, 2013). 6.3. Implications for International Technology Support Mechanisms In its support for technology development and transfer, the international climate policy regime has recently shifted attention from global agreements toward country-specific support, and from the transfer of hardware to the build-up of local technological capabilities. Most notably, the Technology Mechanism (TM) was created under the UNFCCC in 2011 to determine “technology needs […] based on national circumstances and priorities”, and to “accelerate action consistent with international obligations, at different stages of the technology cycle, including research and development, demonstration, deployment, diffusion and transfer of technology in support of action on mitigation and adaptation” (UNFCCC, 2011, p. 18-19). By emphasizing local and global aspects of technology development, innovation, and knowledge networks, the TM’s functions clearly go beyond the ‘one- size-fits-all’ approach of the mechanisms under the Kyoto Protocol, but also beyond the purely country-centered practice of technology needs assessments supported by the United Nations. However, given the range of initiatives that institutions such as the TM could potentially support means that there is a need for analysis to inform the design and priority setting of these institutions. The analysis presented in this paper provides implications for the allocation of resources between global and local support. Our results suggest technology characteristics, such as novelty and the share of simple, heavy and country-specific components, determine the relevance of local learning in concert with country characteristics, such as the existence of domestic industry in similar sectors and the size of the already existing market for the considered technology. These case-specific differences suggest that the TM should ideally integrate global and local perspectives. In cases where local learning is crucial, the TM should assist countries by strengthening the local innovation system, e.g., by identifying technology needs and priorities; by supporting the design of policies and regulations; by providing training and capacity building; through efforts to provide developing countries with access to IPR; or through the creation of local actor networks. In cases where global learning is very important, the TM should strengthen the global, sectoral innovation systems through the creation of global technology roadmaps; the promotion of global technology standards; the coordination of policies across countries and regions; the creation of global, technology-centered networks; or the coordination of institutional linkages between the TM and other global and regional institutions (such as the World Trade Organization, the Green Climate Fund, or the Global Environmental Facility). Overall, our case study suggests that the recent emphasis on local capabilities is promising. However, since resources are necessarily limited, the TM should pursue these different activities with priorities reflecting country characteristics and technology-specific value chain structures. 6.4. Limitations A quantitative case study such as the one presented in this paper has a number of inherent limitations that constrain the validity and applicability of our findings. We see three main factors that need to be highlighted here. First, we are not aware of any other attempt to differentiate local and 21
  • 22. An edited version of this paper is forthcoming in the Journal of Cleaner Production global learning in a techno-economic model for a developing country. Our projections for the potential of local learning are therefore limited by the availability of empirically grounded, cross- industry estimates for local component shares, cost mark-ups and local learning rates.8 To obtain more accurate estimates than those presented here, further research is needed to better understand the cost structure and cost dynamics of renewable energy projects in developing countries. A second limitation concerns the model’s output metrics. Government decisions should be made based on cost-benefit calculations. Our paper provided only estimates for possible cost reductions – the benefits side – while neglecting the cost of policies to realize and support local learning processes. Public research programs, testing and certification institutions, and international support for policy design and capacity building all come at a cost. In order to provide estimates for the leverage of these public investments, i.e., how many cost reductions can be realized at what cost, further data and analysis is necessary. This is particularly important when comparing different policy options. Lastly, by modeling technological capabilities as production cost, and modeling technological learning as cost reductions through a logarithmic function of only installations, our model grossly simplified what is, in reality, a set of extremely complex and distributed processes with multiple qualitative and quantitative dimensions. It can thus only function as a small piece in the broader set of analyses on technological learning that aims to support the design of domestic and international climate policy. 7. Conclusion This paper presented a case study of Thailand’s electricity sector in order to estimate the effects of local and global technological learning on the cost of renewable energy technologies in developing countries. Our model results suggest (i) that technological learning can, in the near future, reduce the cost of renewable electricity in emerging economies to a level that is close to competitiveness with fossil fuels; (ii) the major potential for cost reductions through learning lies in the build-up of local technological capabilities; and (iii) the relative importance of local and global learning, while clear in aggregate terms, differs significantly between technologies. This finding lends quantitative support to the argument that the conditions enabling local learning, such as a skilled workforce, a stable regulatory framework, and the establishment of sustainable business models, have a more significant impact on the cost of renewable energy in developing countries than global technology learning curves. The recent shift of international support under the UNFCCC toward the strengthening of local innovation systems is therefore promising. However, our results also suggests that international support must not disregard the global innovation system perspective in order to reap the full benefits of technological learning across the wide range of clean technologies. These insights are particularly relevant for the ongoing design and functional specification of mechanisms for technology support under the post-Kyoto climate policy regime of the UNFCCC. Here, our quantitative approach and the focus on mitigation cost complements existing qualitative and conceptual work on the topic. Further qualitative research should explore in more detail the economics of renewable energy projects in developing countries, and the effectiveness of different policy options to promote technological learning in and across the developed world. Additional quantitative research should investigate the leverage of different policy options, in particular the relative merit of options targeted at learning, de-risking and global pricing of carbon emissions. 8 For example, we were only able to obtain differentiated estimates for local and global learning rates for wind and solar PV, and for both cases the numbers are from developed country analyses. 22
  • 23. An edited version of this paper is forthcoming in the Journal of Cleaner Production Acknowledgements The authors would like to thank the participants of the workshop on “Governance Architecture towards Low-Carbon Society: Technology and Actor Configuration” at the United Nations University in Yokohama and the “Sustainability Innovation Seminar” at the University of Tokyo, as well as Volker Hoffmann, Fabien Richard, Ingo Puhl, Pimkarn Kattiyavong, Suzanne Greene, Tillmann Lang, Joern Hoppmann, Kavita Surana and two anonymous reviewers for their valuable inputs. All errors remain our own. 23
  • 24. An edited version of this paper is forthcoming in the Journal of Cleaner Production References Bazilian, M., Coninck, H. De, Radka, M., 2008. Considering technology within the UN climate change negotiations. Energy Centre of The Netherlands (ECN), Amsterdam, The Netherlands. Beerepoot, M., Laosiripojana, N., Sujjakulnukij, B., Tippichai, A., Kamsamrong, J., 2013. Incentives for Renewable Energy in Southeast Asia: Case study of Thailand. The International Institute for Sustainable Development (IISD), Winnipeg, Canada. Bell, M., 2010. Innovation Capabilities and Directions of Development. STEPS Centre Working Paper 33, Brighton, UK. Bell, M., Albu, M., 1999. Knowledge Systems and Technological Dynamism in Industrial Clusters in Developing Countries. World Dev. 27, 1715–1734. Bell, M., Figueiredo, P., 2012. Innovation capability building and learning mechanisms in latecomer firms: recent empirical contributions and implications for research. Can. J. Dev. 37–41. Bell, M., Pavitt, K., 1996. The Development of Technological Capabilities, in: Haque, I., Bell, M., Dahlman, C., Lall, S., Pavitt, K. (Eds.), Trade, Technology, and International Competitiveness. The World Bank, Washington, DC. Benioff, R., de Coninck, H., Dhar, S., Hansen, U., McLaren, J., Painuly, J., 2010. Strengthening Clean Energy Technology Cooperation under the UNFCCC: Steps toward Implementation. National Renewable Energy Laboratory (NREL), NREL/TP-6A0-48596, Boulder, Colorado. Berglund, C., Söderholm, P., 2006. Modeling technical change in energy system analysis: analyzing the introduction of learning-by-doing in bottom-up energy models. Energy Policy 34, 1344– 1356. Bhasin, S., 2013. International Technology Cooperation: Lessons for the Upcoming Technology Mechanism of the United Nations Framework Convention on Climate Change. German Development Institute (DIE), Bonn, Germany. Burtraw, D., Krupnick, A., Sampson, G., 2012. The True Cost of Electric Power An Inventory of Methodologies to Support Future Decisionmaking in Comparing the Cost and Competitiveness of Electricity Generation Technologies. Resources for the Future (RFF), Washington, DC. Byrne, R., Smith, A., Watson, J., Ockwell, D., 2011. Energy pathways in low-carbon development: From technology transfer to socio-technical transformation. STEPS Centre Working Paper 46, STEPS Centre and Sussex Energy Group, SPRU, University of Sussex, Brighton, UK. Cohen, W.M., Levinthal, D.A., 1989. Innovation and learning: the two faces of R&D. Econ. J. 99, 569– 596. De Coninck, H., Fischer, C., Newell, R.G., Ueno, T., 2008. International technology-oriented agreements to address climate change. Energy Policy 36, 335–356. De Coninck, H., Stephens, J.C., Metz, B., 2009. Global learning on carbon capture and storage: A call for strong international cooperation on CCS demonstration. Energy Policy 37, 2161–2165. 24
  • 25. An edited version of this paper is forthcoming in the Journal of Cleaner Production DEDE, 2012. The Renewable and Alternative Energy Development Plan for 25 Percent in 10 Years (AEDP 2012-2021). DEDE, 2013. Energy in Thailand: Facts and Figures 2012. Ministry of Energy - Department of Alternative Energy Development and Efficiency (DEDE), Bangkok, Thailand. Delivand, M.K., Barz, M., Gheewala, S.H., Sajjakulnukit, B., 2011. Economic feasibility assessment of rice straw utilization for electricity generating through combustion in Thailand. Appl. Energy 88, 3651–3658. Dinica, V., 2006. Support systems for the diffusion of renewable energy technologies—an investor perspective. Energy Policy 34, 461–480. DOE/EIA, 2013. Electricity Market Module of the National Energy Modeling System. US Department of Energy (DOE) and Energy Information Adminstration (EIA), Washington, DC. Dosi, G., 1988. Sources, procedures, and microeconomic effects of innovation. J. Econ. Lit. 26, 1120– 1171. EPPO, 2012a. Summary of Thailand Power Development Plan 2012-2030 (Revision 3). Ministry of Energy - Energy Policy and Planning Office (EPPO), Bangkok, Thailand. EPPO, 2012b. Energy Database Statistics, Available at: http://www.eppo.go.th/info/5electricity_stat.htm [Accessed August 30, 2012]. Ministry of Energy - Energy Policy and Planning Office (EPPO), Bangkok, Thailand. EPPO, 2012c. Power Development Plan 2010, Revision 3 (June 2012). Ministry of Energy - Energy Policy and Planning Office (EPPO), Bangkok, Thailand. EPPO, 2012d. Thailand’s Automatic Tariff Adjustment Formula. Ministry of Energy - Energy Policy and Planning Office (EPPO), Bangkok, Thailand. EPPO, 2013. Energy Statistics of Thailand 2012. Ministry of Energy - Energy Policy and Planning Office (EPPO), Bangkok, Thailand. Fagerberg, J., Srholec, M., Knell, M., 2007. The Competitiveness of Nations: Why Some Countries Prosper While Others Fall Behind. World Dev. 35, 1595–1620. Gallagher, K.S., 2014. The Globalization of Clean Energy Technology. MIT Press, Cambridge, MA. Greacen, C., Bijoor, S., 2007. Decentralized energy in Thailand: An emerging light. World Rivers Rev. 6, 4–5. Hayward, J.A., Graham, P.W., 2013. A global and local endogenous experience curve model for projecting future uptake and cost of electricity generation technologies. Energy Econ. 40, 537– 548. Hering, G., 2012. Losing steam? Phot. Int. 15, 74–87. IEA, 2008. World Energy Outlook 2008, Electronics and Power. International Energy Agency (IEA) / Organisation for Economic Cooperation and Development (OECD), Paris, France. 25
  • 26. An edited version of this paper is forthcoming in the Journal of Cleaner Production IEA, 2013a. Southeast Asia Energy Outlook. International Energy Agency (IEA) / Organisation for Economic Cooperation and Development (OECD), Paris, France. IEA, 2013b. Renewable Energy - Medium-Term Market Report 2013. International Energy Agency (IEA) / Organisation for Economic Cooperation and Development (OECD), Paris, France. IEA, 2013c. World Energy Outlook 2013. International Energy Agency (IEA) / Organisation for Economic Cooperation and Development (OECD), Paris, France. IEA, IRENA, 2013. Global Renewable Energy Policies and Measures Database, availabe at http://www.iea.org/policiesandmeasures/renewableenergy/. available at http://www.iea.org/policiesandmeasures/renewableenergy/. IPCC, 2012. Special Report of the Intergovernmental Panel on Climate Change on Renewable Energy Sources and Climate Change Mitigation. Cambridge University Press, Cambridge, UK. IRENA, 2012a. Renewable Power Generation Costs in 2012: An Overview. International Renewable Energy Agency (IRENA), Abu Dhabi, UAE. IRENA, 2012b. Wind Power, Renewable Energy Technologies: Cost Analysis Series. International Renewable Energy Agency (IRENA) - Renewable Energy Technologies: Cost Analysis Series 5/5, Abu Dhabi, UAE. IRENA, 2012c. Biomass for Power Generation, Renewable Energy Technologies: Cost Analysis Series. International Renewable Energy Agency (IRENA) - Renewable Energy Technologies: Cost Analysis Series 2/5, Abu Dhabi, UAE. IRENA, 2012d. Hydropower. International Renewable Energy Agency (IRENA) - Renewable Energy Technologies: Cost Analysis Series 3/5, Abu Dhabi. IRENA, 2012e. Renewable Energy Technologies: Cost Analysis Wind Power. International Renewable Energy Agency (IRENA), Abu Dhabi, UAE. IRENA, 2013. 30 Years of Policies for Wind Energy. International Renewable Energy Agency (IRENA), Abu Dhabi, UAE. IRENA, 2014. Global Atlas. International Renewable Energy Agency (IRENA), Abu Dhabi, UAE. Jänicke, M., 2012. Dynamic governance of clean-energy markets: how technical innovation could accelerate climate policies. J. Clean. Prod. 1, 50–59. JIE, 2008. The Asian Biomass Handbook. The Japan Institute of Energy (JIE), Tokyo, Japan. Johnson, O., 2013. Exploring the Effectiveness of Local Content Requirements in Promoting Solar PV Manufacturing in India. German Development Institute (DIE), Bonn, Germany. Junginger, H.M., Sark, W., Faaij, A., 2010. Technological Learning in the Energy Sector: Lessons for Policy, Industry and Science. Edward Elgar, Cheltenham, UK. Kahouli-Brahmi, S., 2008. Technological learning in energy-environment-economy modelling: A survey. Energy Policy 36, 138–162. 26
  • 27. An edited version of this paper is forthcoming in the Journal of Cleaner Production Kamolpanus, S., 2013. Thailand’s Renewable Power - Current Status, Challenges, and Future Trend. AORC-CIGRE Tech. Meet. Sept. 3rd, 2013, Guangzhou China. Kanie, N., Nishimoto, H., Hijioka, Y., Kameyama, Y., 2010. Allocation and architecture in climate governance beyond Kyoto: lessons from interdisciplinary research on target setting. Int. Environ. Agreements Polit. Law Econ. 10, 299–315. Lema, A., Lema, R., 2013. Technology transfer in the clean development mechanism: Insights from wind power. Glob. Environ. Chang. 1, 301–313. Lewis, J., 2012. Green innovation in China: China’s wind power industry and the global transition to a low-carbon economy. Columbia University Press, New York, NY. Lewis, J.I., 2014. The Rise of Renewable Energy Protectionism: Emerging Trade Conflicts and Implications for Low Carbon Development Joanna. Glob. Environ. Polit. 14. Lindman, Å., Söderholm, P., 2011. Wind power learning rates: A conceptual review and meta-analysis. Energy Econ. 34, 754–761. Lundvall, B.Å., Joseph, K.J., Chaminade, C., 2009. Handbook on Innovation Systems and Developing Countries: Building Domestic Capabilities in a Global Context. Edward Elgar Publishing, Cheltenham, UK and Northampton, MA. Morrison, A., Pietrobelli, C., Rabellotti, R., 2008. Global Value Chains and Technological Capabilities: A Framework to Study Learning and Innovation in Developing Countries. Oxford Dev. Stud. 36, 39–58. Mott McDonald, 2011. Costs of low-carbon generation technologies. UK Committee on Climate Change, London, UK. Muncharoen, C., Limmeechokchai, B., Yoohoon, A., Kumpeera, K., Buakhiew, C., Kunanopparat, S., Sangdow, S., Kniniman, N., Chawanapong, A., Theeraleekul, A., Bunchaidee, R., 2010. The study of emission factor for an electricity system in Thailand in Year 2010. Thailand Greenhouse Gas Management Organization, Bangkok, Thailand. Mytelka, L.K., 2000. Local Systems of Innovation in a Globalized World Economy. Ind. Innov. 7, 15–32. Nachmany, M., Fankhauser, S., Townshend, T., Collins, M., Landesman, T., Matthews, A., Pavese, C., Rietig, K., Schleifer, P., Setzer, J., 2014. The GLOBE Climate Legislation Study: A Review of Climate Change Legislation in 66 Countries. Fourth Edition. GLOBE International and the Grantham Research Institute, London School of Economics, London, UK. Nahm, J., Steinfeld, E.S., 2014. Scale-up Nation: China’s Specialization in Innovative Manufacturing. World Dev. 54, 288–300. Nakawiro, T., Bhattacharyya, S., Limmeechokchai, B., 2008. Electricity capacity expansion in Thailand: An analysis of gas dependence and fuel import reliance. Energy 33, 712–723. Naksrisuk, C., Audomvongseree, K., 2013. Dependable capacity evaluation of wind power and solar power generation systems. 2013 10th Int. Conf. Electr. Eng. Comput. Telecommun. Inf. Technol. 27
  • 28. An edited version of this paper is forthcoming in the Journal of Cleaner Production NREL, 2012. Cost and performance data for power generation technologies. National Renewable Energy Laboratory (NREL), Boulder, Colorado. Ockwell, D., Haum, R., Mallett, A., Watson, J., 2010. Intellectual property rights and low carbon technology transfer: Conflicting discourses of diffusion and development. Glob. Environ. Chang. 20, 729–738. Ockwell, D., Mallett, A., 2012. Low-carbon technology transfer: From rhetoric to reality. Rourledge, New York, NY. Ondraczek, J., Komendantova, N., Patt, A., 2013. WACC the Dog: The Effect of Financing Costs on the Levelized Cost of Solar PV Power. Working Paper FNU-201, Hamburg, Germany. Palmer, K., Burtraw, D., 2005. Cost-effectiveness of renewable electricity policies. Energy Econ. 27, 873–894. Pattanapongchai, A., Limmeechokchai, B., 2011a. Least cost energy planning in Thailand: A case of biogas upgrading in palm oil industry. Songklanakarin J. Sci. Technol. 33, 705–715. Pattanapongchai, A., Limmeechokchai, B., 2011b. Least cost energy planning in Thailand : A case of biogas upgrading in palm oil industry. Renew. Energy 33, 705–715. Peters, M., Schneider, M., Griesshaber, T., Hoffmann, V.H., 2012. The impact of technology-push and demand-pull policies on technical change – Does the locus of policies matter? Res. Policy 41, 1296–1308. Phillips, J., Das, K., Newell, P., 2013. Governance and technology transfer in the Clean Development Mechanism in India. Glob. Environ. Chang. 6, 1594–1604. Pongsoi, P., Wongwises, S., 2013. A review on nuclear power plant scenario in Thailand. Renew. Sustain. Energy Rev. 24, 586–592. Promjiraprawat, K., Limmeechokchai, B., 2012. Assessment of Thailand’s Energy Policies and CO2 Emissions: Analyses of Energy Efficiency Measures and Renewable Power Generation. Energies 5, 3074–3093. PTIT, 2012. Facts about Natural Gas in Thailand. Petroleum Institute of Thailand (PTIT), Bangkok, Thailand. Pueyo, A., García, R., Mendiluce, M., Morales, D., 2011. The role of technology transfer for the development of a local wind component industry in Chile. Energy Policy 39, 4274–4283. Pueyo, A., Mendiluce, M., Naranjo, M.S., Lumbreras, J., 2012. How to increase technology transfers to developing countries: a synthesis of the evidence. Clim. Policy 12, 320–340. REN21, 2013. Renewables 2013: Global Status Report. Renewable Energy Policy Network for the 21st Century (REN21), Paris, France. Ruangrong, P., 2012. Power Tariff Structure in Thailand Energy Regulatory Commission of Thailand. Energy Regulatory Commission of Thailand, Bangkok, Thailand. 28
  • 29. An edited version of this paper is forthcoming in the Journal of Cleaner Production Sandén, B.A., Azar, C., 2005. Near-term technology policies for long-term climate targets? Economy- wide versus technology specific approaches. Energy Policy 33, 1557–1576. Sangarasri-Greacen, C., Greacen, C., 2012. Proposed Power Development Plan 2012 and a Framework for Improving Accountability and Performance of Power Sector Planning. Bangkok, Thailand. Schmidt, T., Born, R., Schneider, M., 2012. Assessing the costs of photovoltaic and wind power in six developing countries. Nat. Clim. Chang. 2, 548–553. Schmidt, T.S., 2014. Low-carbon investment risks and de-risking. Nat. Clim. Chang. 4, 237–239. Seel, J., Barbose, G., Wiser, R., 2014. An analysis of residential PV system price differences between the United States and Germany. Energy Policy in press. Senker, J., 1995. Tacit Knowledge and Models of Innovation. Ind. Corp. Chang. 4, 425–447. The World Bank, 2014. Databank. The World Bank, Washington, DC. Tongsopit, S., Greacen, C., 2013. An assessment of Thailand’s feed-in tariff program. Renew. Energy 60, 1–24. Townshend, T., Fankhauser, S., Aybar, R., Collins, M., Landesman, T., Nachmany, M., Pavese, C., 2013. How national legislation can help to solve climate change. Nat. Clim. Chang. 3, 430–432. UNFCCC, 2010. Guidelines on the Assessment of Investment Analysis. United Nations Framework Convention on Climate Change (UNFCCC), Bonn, Germany. UNFCCC, 2011. Report of the Conference of the Parties on its sixteenth session. United Nations Framework Convention on Climate Change (UNFCCC), Cancun, Mexico. UNFCCC, 2012. Establishment of an Ad Hoc Working Group on the Durban Platform for Enhanced Action (Proposal by the President). United Nations Framework Convention on Climate Change (UNFCCC), Durban, South Africa. Van der Zwaan, B.C.C., Gerlagh, R., Zwaan, B.C.C. Van Der, Klaassen, G., 2002. Endogenous technological change in climate change modelling. Energy Econ. 24, 1–19. Van Hoof, B., 2014. Organizational learning in cleaner production among Mexican supply networks. J. Clean. Prod. 64, 115–124. Van Tilburg, X., Bristow, S., Röser, F., Escalante, D., Fekete, H., 2013. Status Report on Nationally Appropriate Mitigation Actions (NAMAs) - Mid-year update June 2013. Energy Centre of The Netherlands (ECN) and Ecofys, Amsterdam, the Netherlands. Von Hippel, E., 1994. “Sticky information” and the locus of problem solving: Implications for innovation. Manage. Sci. 40, 429–439. Waissbein, O., Glemarec, Y., Bayraktar, H., Schmidt, T.S., 2013. Derisking Renewable Energy Investment. A Framework to Support Policymakers in Selecting Public Instruments to Promote Renewable Energy Investment in Developing Countries. United Nations Development Programme (UNDP), New York, NY. 29
  • 30. An edited version of this paper is forthcoming in the Journal of Cleaner Production Wisuttisak, P., 2012. Regulation and competition issues in Thai electricity sector. Energy Policy 44, 185–198. 30
  • 31. An edited version of this paper is forthcoming in the Journal of Cleaner Production Appendix A: Cost of Avoided Electricity Fuel Mix in the Electricity Sector Thailand’s electricity sector is partly vertically integrated and dominated by state-owned enterprises (Wisuttisak, 2012). The Electricity Generation Authority of Thailand (EGAT) is the transmission system operator and directly operates around 50% of the generation assets and, as their largest shareholder, controls the two largest independent power producers. Furthermore, the wholesale market is not liberalized. Decisions over new power plant investments are therefore still made based on long-term integrated plans, rather than purely based on market signals, and plant utilization is based on long- term allocations rather than marginal cost of generation. Our model of the fuel mix aims to reflect this decision-making process. We took the power plant pipeline from the Power Development Plan from June 2012 (EPPO, 2012a) and assumed that all hydropower, combined-heat-and-power, and contracted import capacity comes online as planned. Additional power plants were assumed to be built, in the sequence determined by the plan, whenever dependable capacity exceeds peak demand by less than 15%, or total expected demand exceeds expected generation, based on historic capacity factors, exceeds more than 5%. This approach is similar to the one adopted by domestic researchers (Sangarasri-Greacen and Greacen, 2012). The dependable capacity equals the total capacity adjusted by factors that aim to reflect the fact that not all build capacity can be expected to be available in the moment of peak demand, because of maintenance, failures, or intermittent generation.9 The fuel mix was then calculated, on a yearly basis, from historic capacity factors, marginally adjusted for the dispatchable plant fleet to exactly meet yearly demand. “Dispatchable” refers here to the plants that are ramped up and down to balance demand, i.e., the full fleet excluding renewables, contracted import capacity (lignite and hydro), municipal solid waste and (heat-led) cogeneration. Avoided Electricity To model the effect of renewable energy diffusion on conventional electricity generation, we compared the hypothetical scenario without renewable energy diffusion to the case of full implementation of the AEDP targets. The total avoided electricity we then calculated by aggregating the differences between total generation in 2012-2041 with and without AEDP targets for each of the dispatchable technologies (generation from non-dispatachable technologies is not affected by the AEDP). Modeling the marginal cost of avoided electricity required one more step of differentiation. The impact of renewable capacity installations can be twofold: plant utilization of dispatchable power plants can be reduced or the construction of new power plants postponed. Our model accounted for these two effects by dividing the total avoided electricity into build and operating margins. For all displaced electricity the cost of electricity was calculated based on the LCOE approach presented in section 4.2.2. However, in the case of reduced plant utilization, the operating margin, we assumed the marginal cost of electricity to contain only the variable cost (O&M and fuel). The displaced 9 The factors are taken from Sangarasri-Greacen and Greacen (2012) and listed in Table 3. 31
  • 32. An edited version of this paper is forthcoming in the Journal of Cleaner Production electricity from postponed power plants, the build margin, contains all fixed and variable cost.10 Table 4 summarizes the input assumptions for all conventional technologies. Appendix B: Model Input Assumptions Table 3: Input assumptions for renewable energy technologies (values for 2012; $=USD2012) Size (MW) Lifetime [a] Investment [$/kW] O&M fix [$/kWa] O&M variable [$/MWh] Fuel cost [$/MWh] Efficiency [%] Capacity factor [%] Dependable capacity [%] Carbon credits* [kCO2e/MWh] Wind 10 20 1,980a 60a 0a - - 31.8e 9f 555.4h PV 10 20 2,830a 50a 0a - - 19.8e 20f 555.4h CSP 5 20 4,910a 50a 0a - - 21.5e 70g 555.4h Biomass 10 20 2,157b 0b 10.4b 41.2b 19.8%b 69b 55g 511.3h Biogas 1 20 2,554c 116c 0c 10c 31%c 70c 21g 511.3h Micro hydro 1 20 2,800d 112d 0d - - 29i 40g 511.3h a NREL (2012); b Delivand et al. (2011); c Pattanapongchai and Limmeechokchai (2011); d IRENA (2012e); e calculated based on data from the IRENA Global Atlas (3Tier; 2014); f Naksrisuk and Audomvongseree (2013); g Sangarasri-Greacen and Greacen (2012); h Munchareon et al. (2010); i Promjiraprawat and Limmeechokchai (2012) other data are own assumptions and calculations; *used for calculation of generated carbon credits; data from the Thailand Greenhouse Gas Management Organization (Muncharoen et al., 2010), which calculates the avoided carbon emissions of renewable projects in Thailand based on CDM methodology. The CDM methodology distinguishes between intermittent (solar and wind) and non-intermittent technologies (biomass, biogas and micro-hydro)- Because they need back-up power, intermittent sources are assumed to not much affect the decision about new fossil-fuelled power plants. The electricity they avoid therefore comes mostly from existing power plants (75% to 25%), while non-intermittent sources are assumed to avoid a larger amount of newly built fossil-fuelled power capacity (50% to 50%). Since the new power plants have lower emissions than the existing plant fleet, the intermittent sources end up avoiding slightly more carbon emissions than the non-intermittent sources. Table 4: Input assumptions for dispatchable fossil fuel technologies (values for 2012; $=USD2012) 10 This procedure was also employed by Schmidt et al. (2012) and is related to the rules employed to calculate avoided carbon emissions in the Clean Development Mechanisms under the UNFCCC. Lifetime [a] Investment [$/kW] O&M fixed [$/kWa] O&M variable [$/MWh] Fuel efficiency [%] Fuel cost* [$/kWh] Capacity factor [%] Carbon emissions [tCO2e/MWh] Subcritic. lignite 30 1,125a 38.91b 11.02b 35b 0.005d 90 1,159b IGCC lignite 30 2,830c 50c 7.9c 46c 0.005d 90 882 Adv. nuclear 40 5,429c 91.65c 2.1c 33c 0.003d 90 21b Gas turbine ** ** 7.21c 15.28c 31.4c 0.052e 30 631b CCGT 30 1,006c 15.1c 3.21c 54c 0.052e 60 404b Subcritic. coal ** ** 38b 0.04b 36b 0.015f 90 973b Supercrit. coal 30 2,934c 31.18d 4.7d 39c 0.015f 90 782b IGCC coal 30 3,784c 51.39c 8.45c 39c 0.015f 90 782b Diesel turbine ** ** 12a 28.6a 22a 0.061d 30 808b CCGT: combined cycle gas turbine; IGCC: integrated gasification combined cycle; a Pattanapongchai and Limmeechokchai(2011); b Promjiraprawat and Limmeechokchai (2012); c DOE/EIA (2013); d EPPO (2012d);e price for natural gas is for imports from Myanmar, from PTIT (2012) f IEA (2013c); *Fuel price trends from IEA (2013c); **Not needed because no new power plants in the pipeline 32
  • 33. An edited version of this paper is forthcoming in the Journal of Cleaner Production Table 5: Split between locally and globally sourced components by technology in models E-H, representing a low share of local components Technology Locally sourced parts Globally sourced parts Cost split local/global Learning rate local/global Wind Grid connection; engineering; procurement & construction Nacelle (including electrical machinery, power electronics & control system); foundation; rotor blades; tower 36/64a 11.3/4.3d PV Grid connection; engineering; procurement & construction PV modules; inverter; balance of system 36/64b 17/20d CSP Grid connection; engineering; procurement & construction Power block; heat transfer fluid cycle; solar field 23/77b 14.6/14.6d Biomass Grid connection; engineering, procurement & construction; fuel shredder; piping Steam turbine and electric generator (prime mover); flue gas and water treatment; boiler; heat exchanger 37/63c 5/5c Biogas Grid connection; engineering, procurement & construction; fuel handling Gas engine (prime mover); converter system; electrical system 48/52c 5/5c Micro hydro Grid connection; engineering, procurement & construction Electro-mechanical equipment 77/23c 5/5c a IRENA (2012c); b NREL (2012); c Mott McDonald (2011); d Hayward & Graham (2013) Table 6: Sectoral assumptions in the model Factor Assumption Source Currency USD 2012 in real terms --- Exchange rate 1 USD = 31.5 Thai Baht The World Bank Inflation 2.5% Bank of Thailand Equity/debt spilt 30/70 Current practice Return on equity 11.2% real UNFCCC (2010) Lending rate 6.7% nominal Ondraczek et al. (2013) Loan tenor Half of investment lifetime Waissbein et al. (2013) Tax rate 30% Current practice Depreciation Linear, max 5% p.a., min book value 5% Current practice Discounting of public expenditures Equals 40-year bond yield of 4.43 % Thai Bond Market Association, http://www.thaibma.or.th/yieldcurve/YieldTTM.aspx,; assessed on 4/3/2014 33