The document discusses Venn diagrams, including:
1) A Venn diagram is a diagram used to represent sets and the relationships between them, with circles representing each set and the overlapping areas representing elements in common between sets.
2) Venn diagrams were introduced in 1880 by John Venn and are used in teaching set theory as well as in other subjects like probability, logic, linguistics, and computer science.
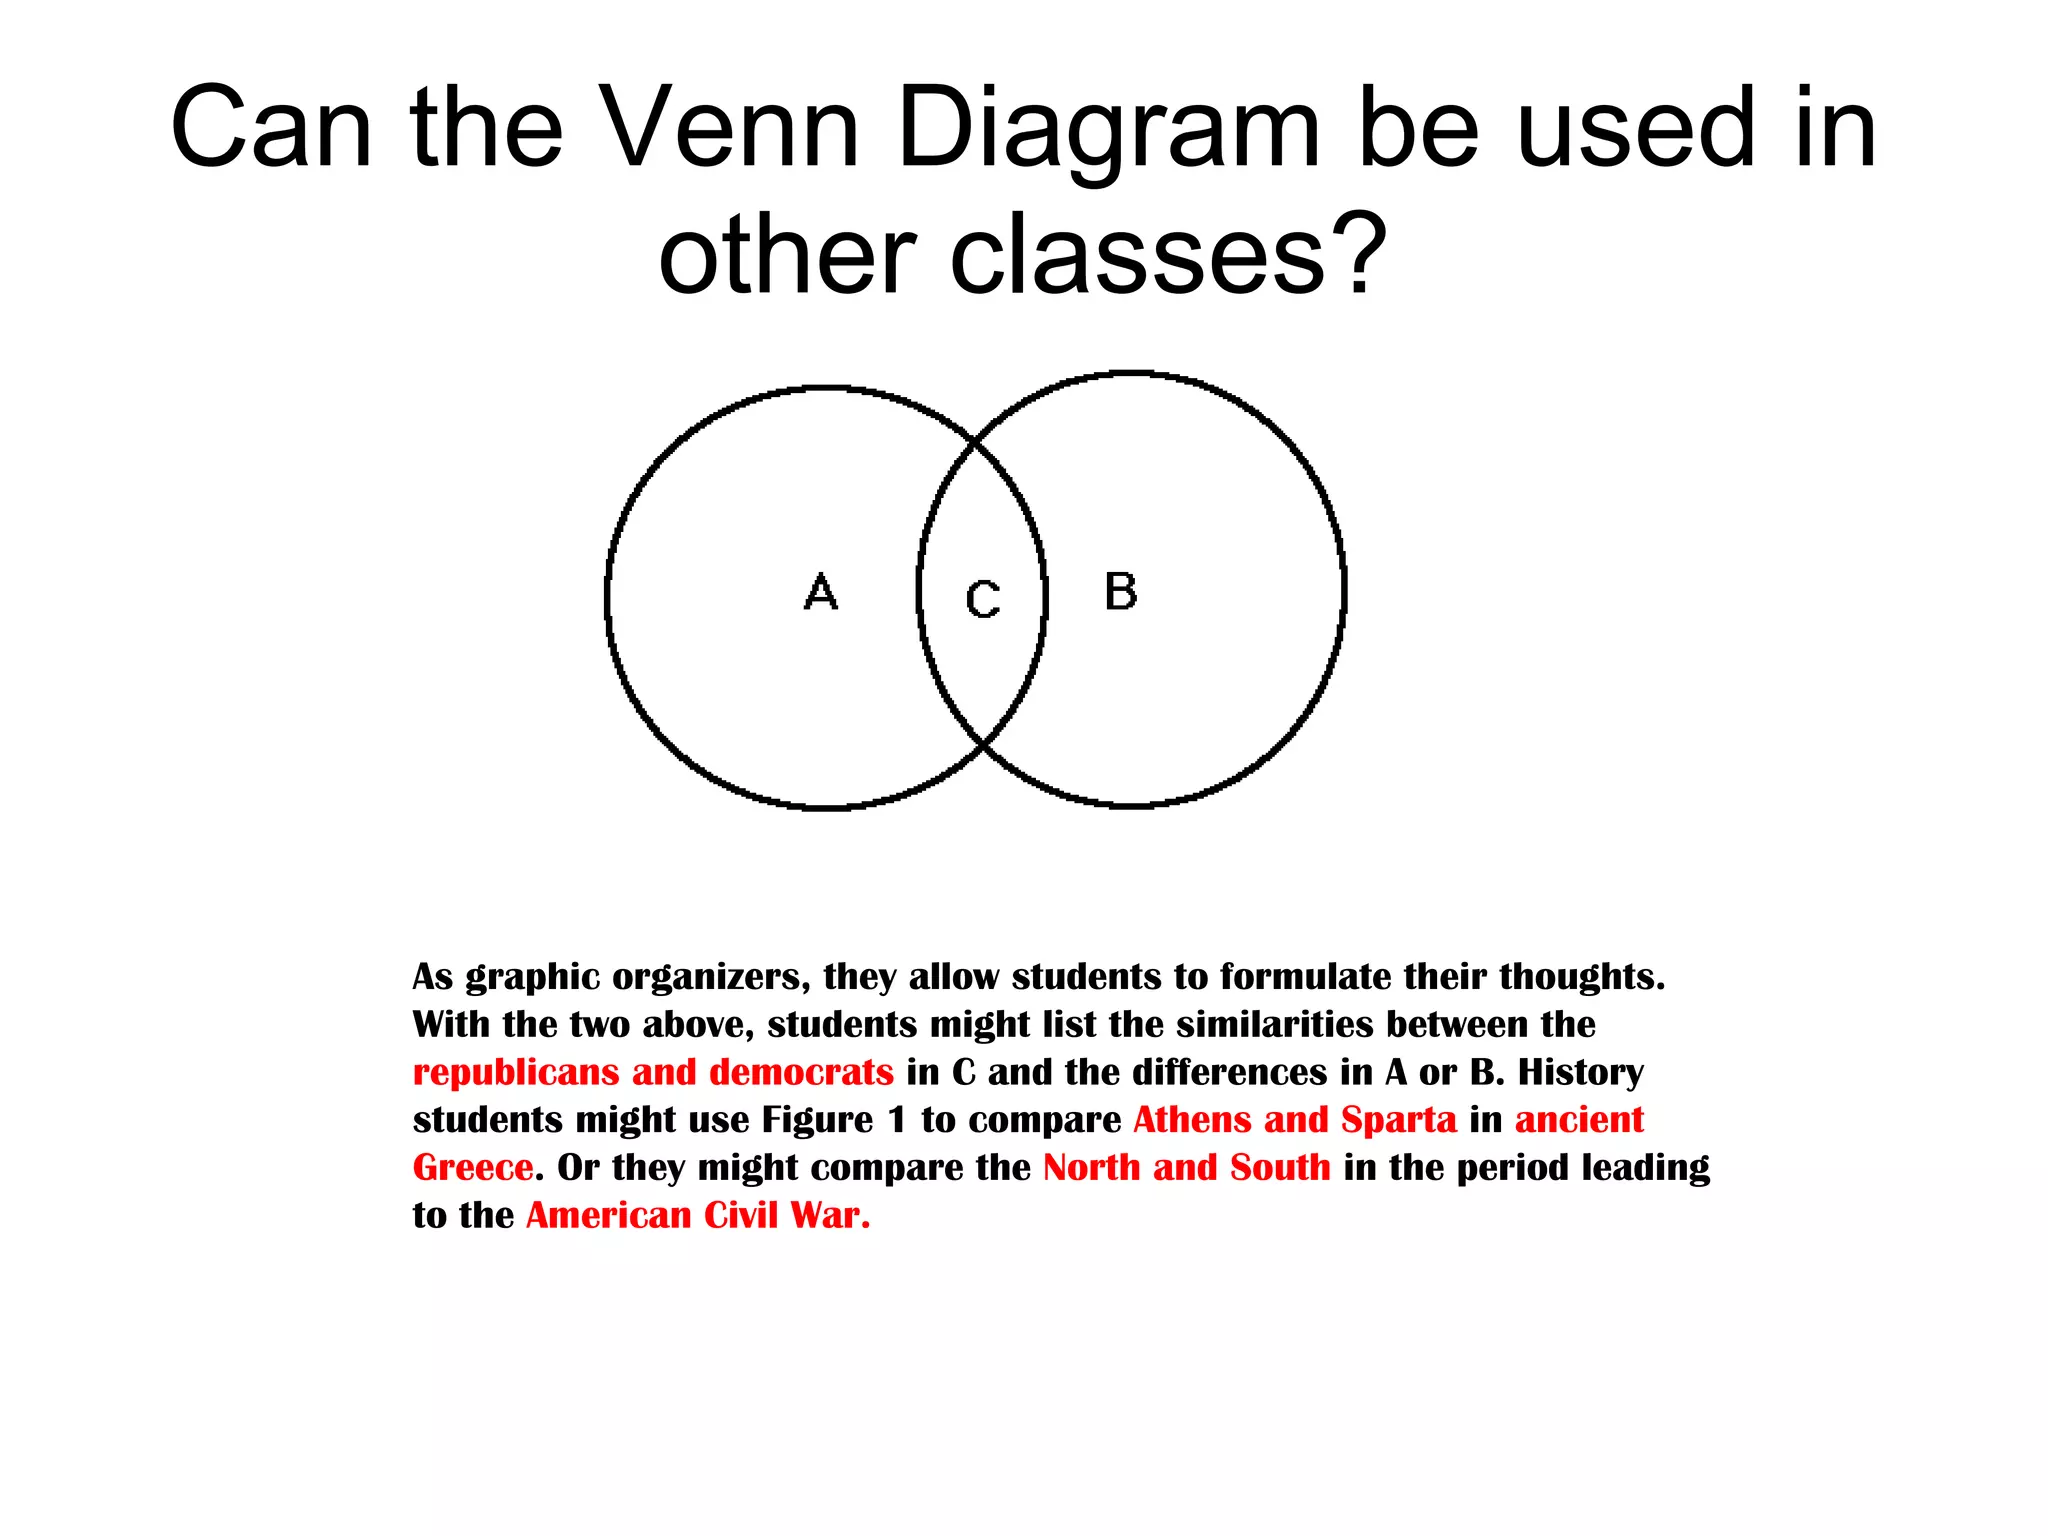
3) The document provides an example of how a Venn diagram could be used to compare characteristics of Republicans and Democrats or of Athens and Sparta.