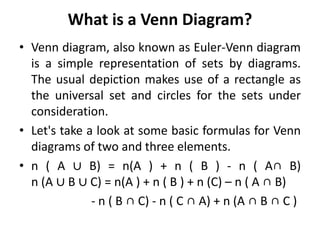
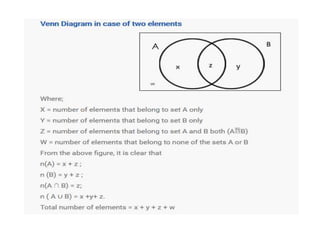
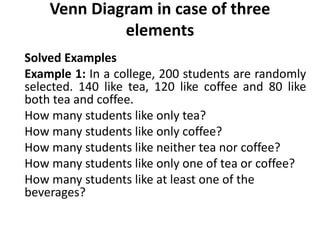
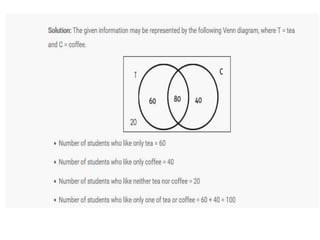
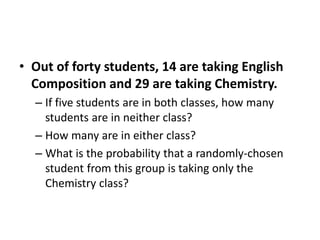
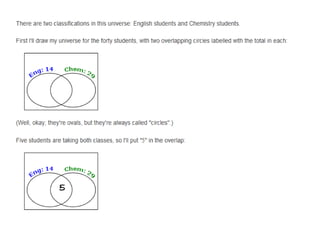
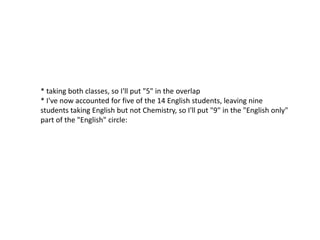
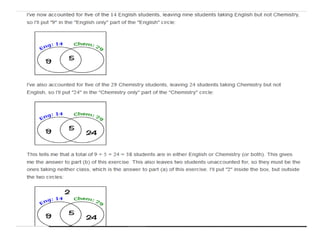
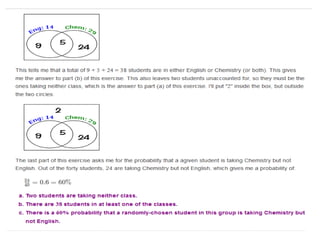
VENN DIAGRAM
Prepared by
S.Piramu Kailasam
Assistant Professor
Sadakathullah appa college
Tirunelveli
What is a Venn Diagram?
• Venn diagram, also known as Euler-Venn diagram
is a simple representation of sets by diagrams.
The usual depiction makes use of a rectangle as
the universal set and circles for the sets under
consideration.
• Let's take a look at some basic formulas for Venn
diagrams of two and three elements.
• n ( A ∪ B) = n(A ) + n ( B ) - n ( A∩ B)
n (A ∪ B ∪ C) = n(A ) + n ( B ) + n (C) – n ( A ∩ B)
- n ( B ∩ C) - n ( C ∩ A) + n (A ∩ B ∩ C )
Venn Diagram in case of three
elements
Solved Examples
Example 1: In a college, 200 students are randomly
selected. 140 like tea, 120 like coffee and 80 like
both tea and coffee.
How many students like only tea?
How many students like only coffee?
How many students like neither tea nor coffee?
How many students like only one of tea or coffee?
How many students like at least one of the
beverages?
• Venn diagram word problems generally give
you two or three classifications and a bunch of
numbers. You then have to use the given
information to populate the diagram and
figure out the remaining information. For
instance:
• Out of forty students, 14 are taking English
Composition and 29 are taking Chemistry.
– If five students are in both classes, how many
students are in neither class?
– How many are in either class?
– What is the probability that a randomly-chosen
student from this group is taking only the
Chemistry class?
• There are two classifications in this universe:
English students and Chemistry students.
• First I'll draw my universe for the forty
students, with two overlapping circles labelled
with the total in each:
* taking both classes, so I'll put "5" in the overlap
* I've now accounted for five of the 14 English students, leaving nine
students taking English but not Chemistry, so I'll put "9" in the "English only"
part of the "English" circle:
Thank you

Venndiagram 211012062532

  • 1.
    VENN DIAGRAM Prepared by S.PiramuKailasam Assistant Professor Sadakathullah appa college Tirunelveli
  • 2.
    What is aVenn Diagram? • Venn diagram, also known as Euler-Venn diagram is a simple representation of sets by diagrams. The usual depiction makes use of a rectangle as the universal set and circles for the sets under consideration. • Let's take a look at some basic formulas for Venn diagrams of two and three elements. • n ( A ∪ B) = n(A ) + n ( B ) - n ( A∩ B) n (A ∪ B ∪ C) = n(A ) + n ( B ) + n (C) – n ( A ∩ B) - n ( B ∩ C) - n ( C ∩ A) + n (A ∩ B ∩ C )
  • 4.
    Venn Diagram incase of three elements Solved Examples Example 1: In a college, 200 students are randomly selected. 140 like tea, 120 like coffee and 80 like both tea and coffee. How many students like only tea? How many students like only coffee? How many students like neither tea nor coffee? How many students like only one of tea or coffee? How many students like at least one of the beverages?
  • 6.
    • Venn diagramword problems generally give you two or three classifications and a bunch of numbers. You then have to use the given information to populate the diagram and figure out the remaining information. For instance:
  • 7.
    • Out offorty students, 14 are taking English Composition and 29 are taking Chemistry. – If five students are in both classes, how many students are in neither class? – How many are in either class? – What is the probability that a randomly-chosen student from this group is taking only the Chemistry class?
  • 8.
    • There aretwo classifications in this universe: English students and Chemistry students. • First I'll draw my universe for the forty students, with two overlapping circles labelled with the total in each:
  • 10.
    * taking bothclasses, so I'll put "5" in the overlap * I've now accounted for five of the 14 English students, leaving nine students taking English but not Chemistry, so I'll put "9" in the "English only" part of the "English" circle:
  • 13.