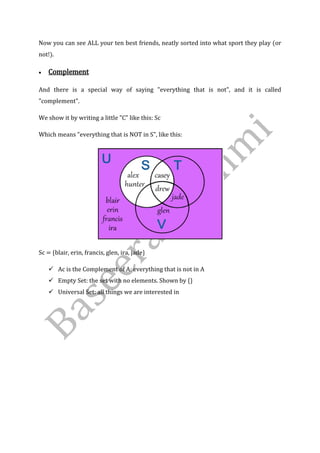
Download to read offline
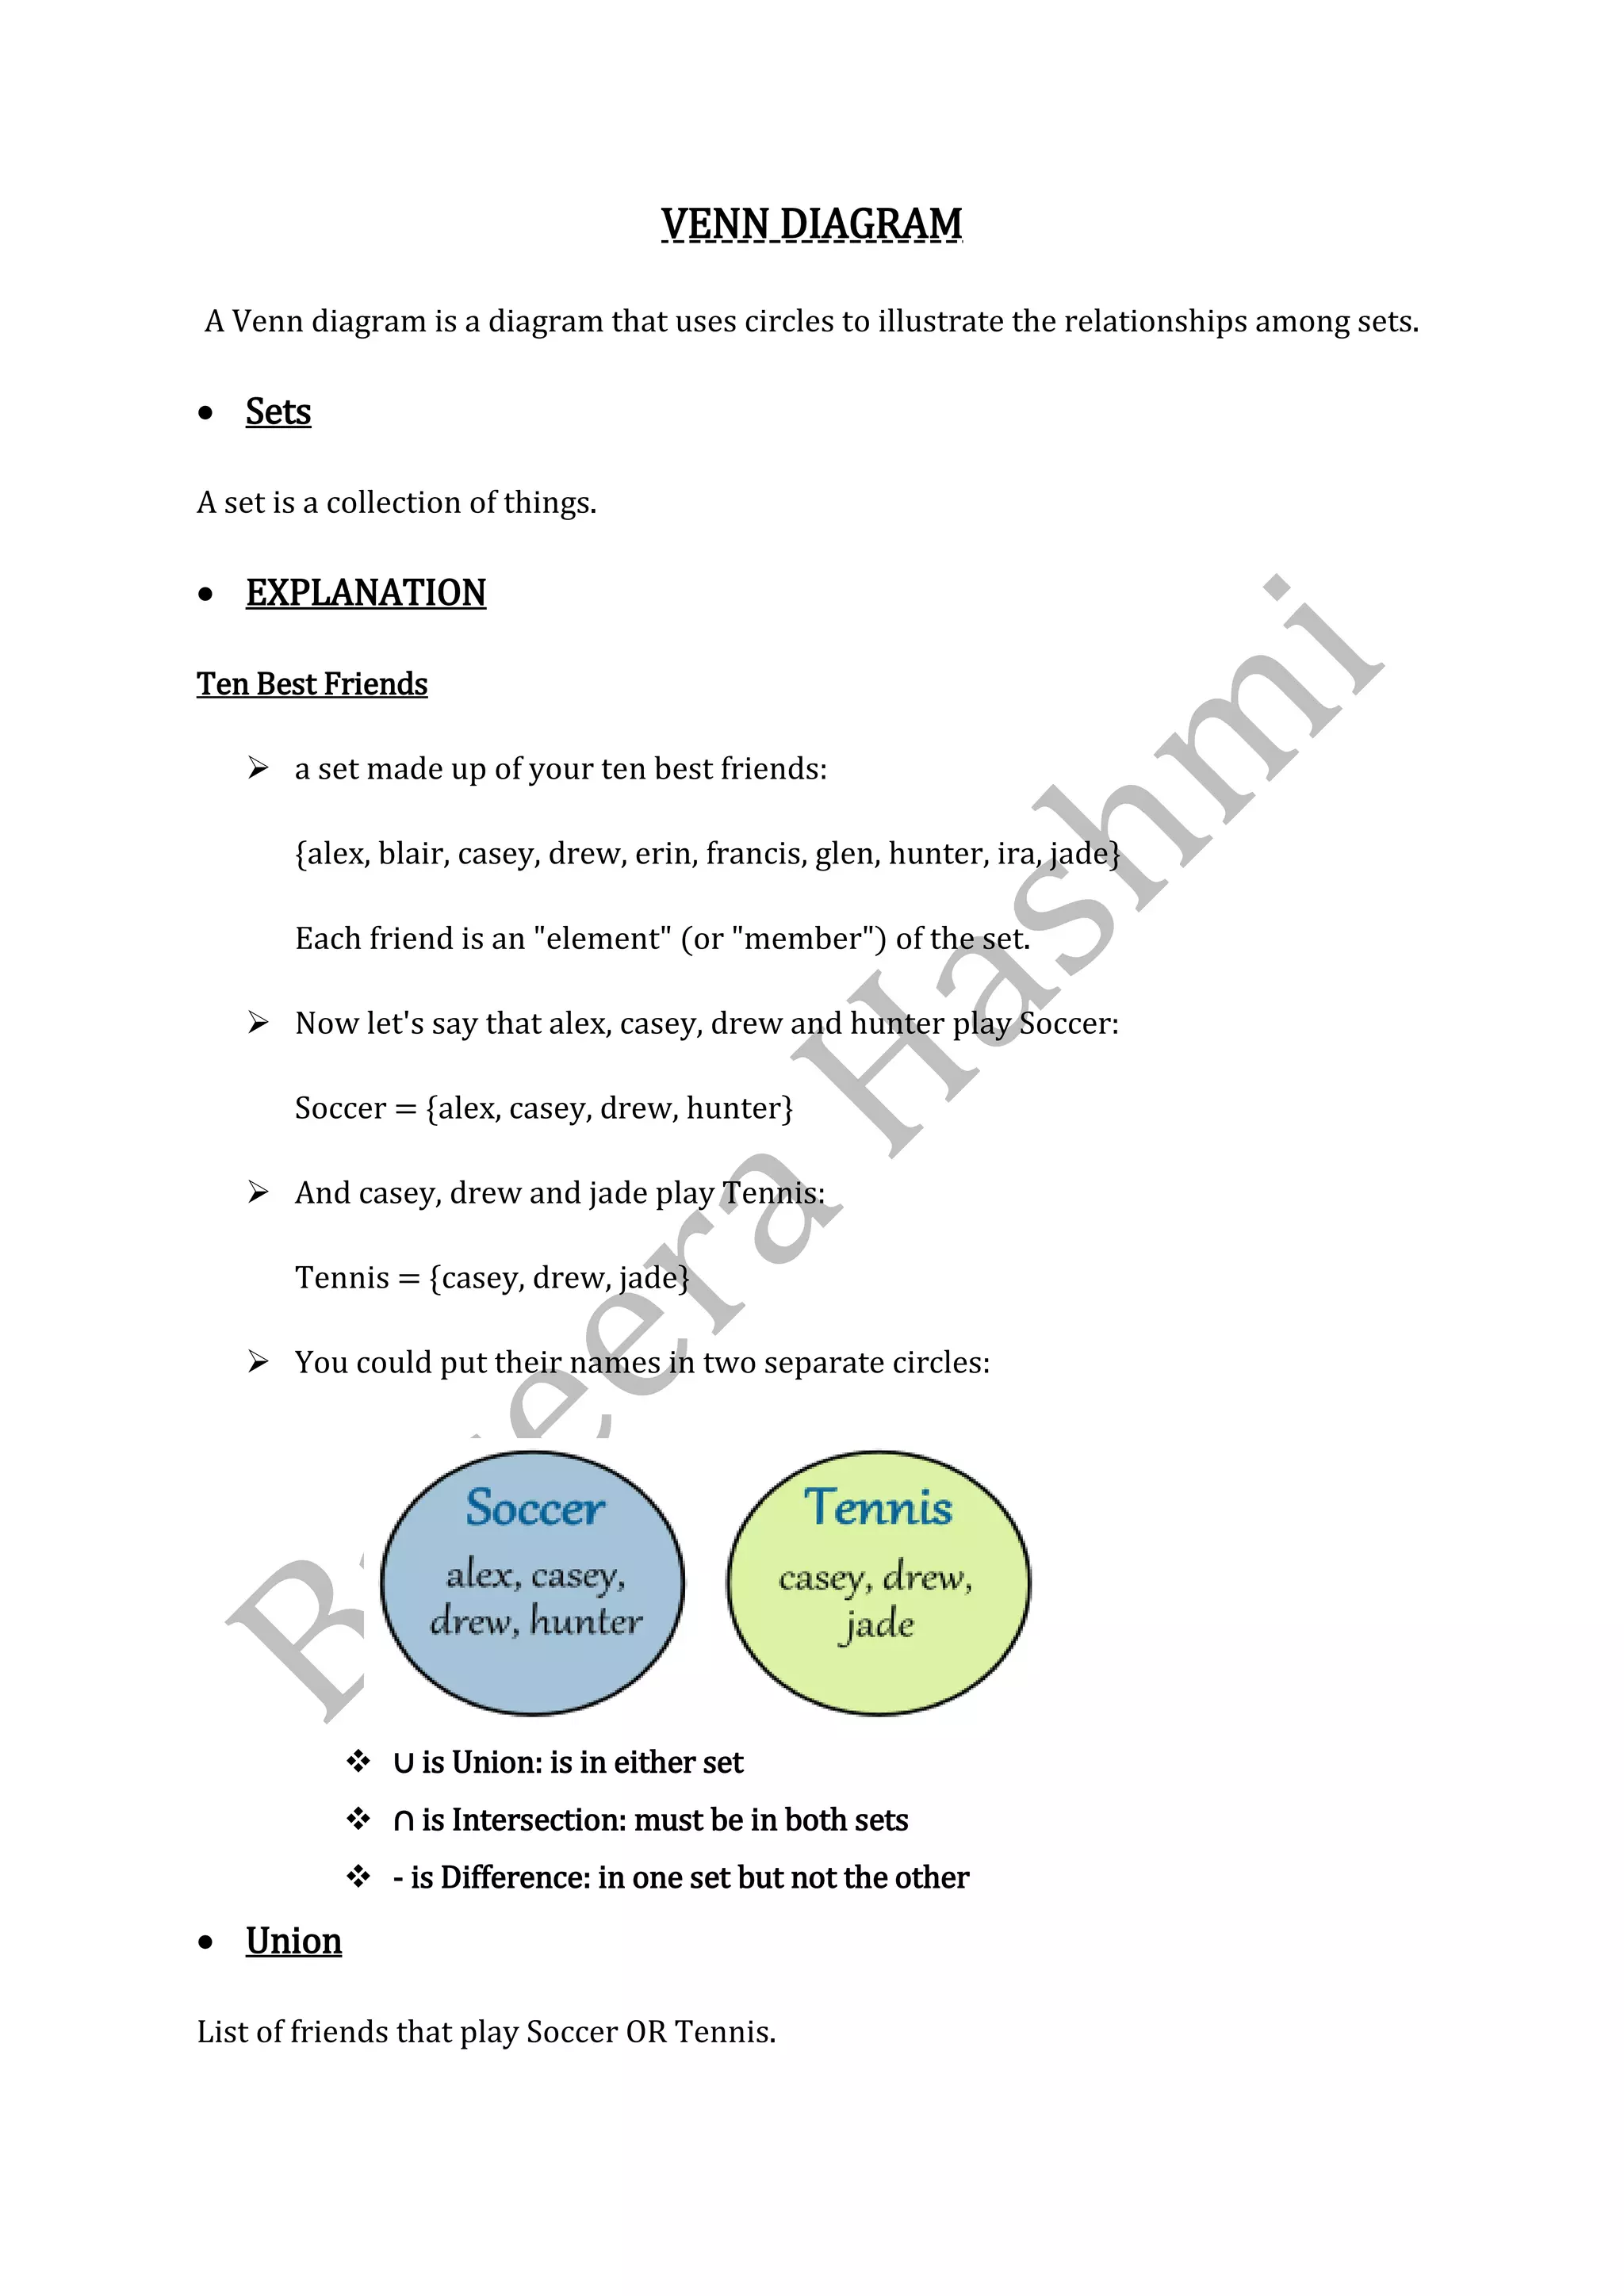


A Venn diagram uses overlapping circles to show relationships between different sets. It can illustrate sets with elements in common as well as elements unique to each set. For example, a Venn diagram can show which of your 10 best friends play soccer, tennis, or both by placing their names in the appropriate overlapping or separate circles. The intersection is the set of elements common to both sets while the union includes elements in either set. A Venn diagram provides a visual representation of sets, subsets, intersections, and relationships between elements.


![[CHEM 17] ALDEHYDES AND KETONES (PRE-LAB).pptx](https://cdn.slidesharecdn.com/ss_thumbnails/chem17aldehydesandketonespre-lab-240421234728-1a48a129-thumbnail.jpg?width=640&height=640&fit=bounds)
![Chemistry ail shashank [hydrocarbons]](https://cdn.slidesharecdn.com/ss_thumbnails/chemistryailshashankhydrocarbons-210105031943-thumbnail.jpg?width=640&height=640&fit=bounds)


