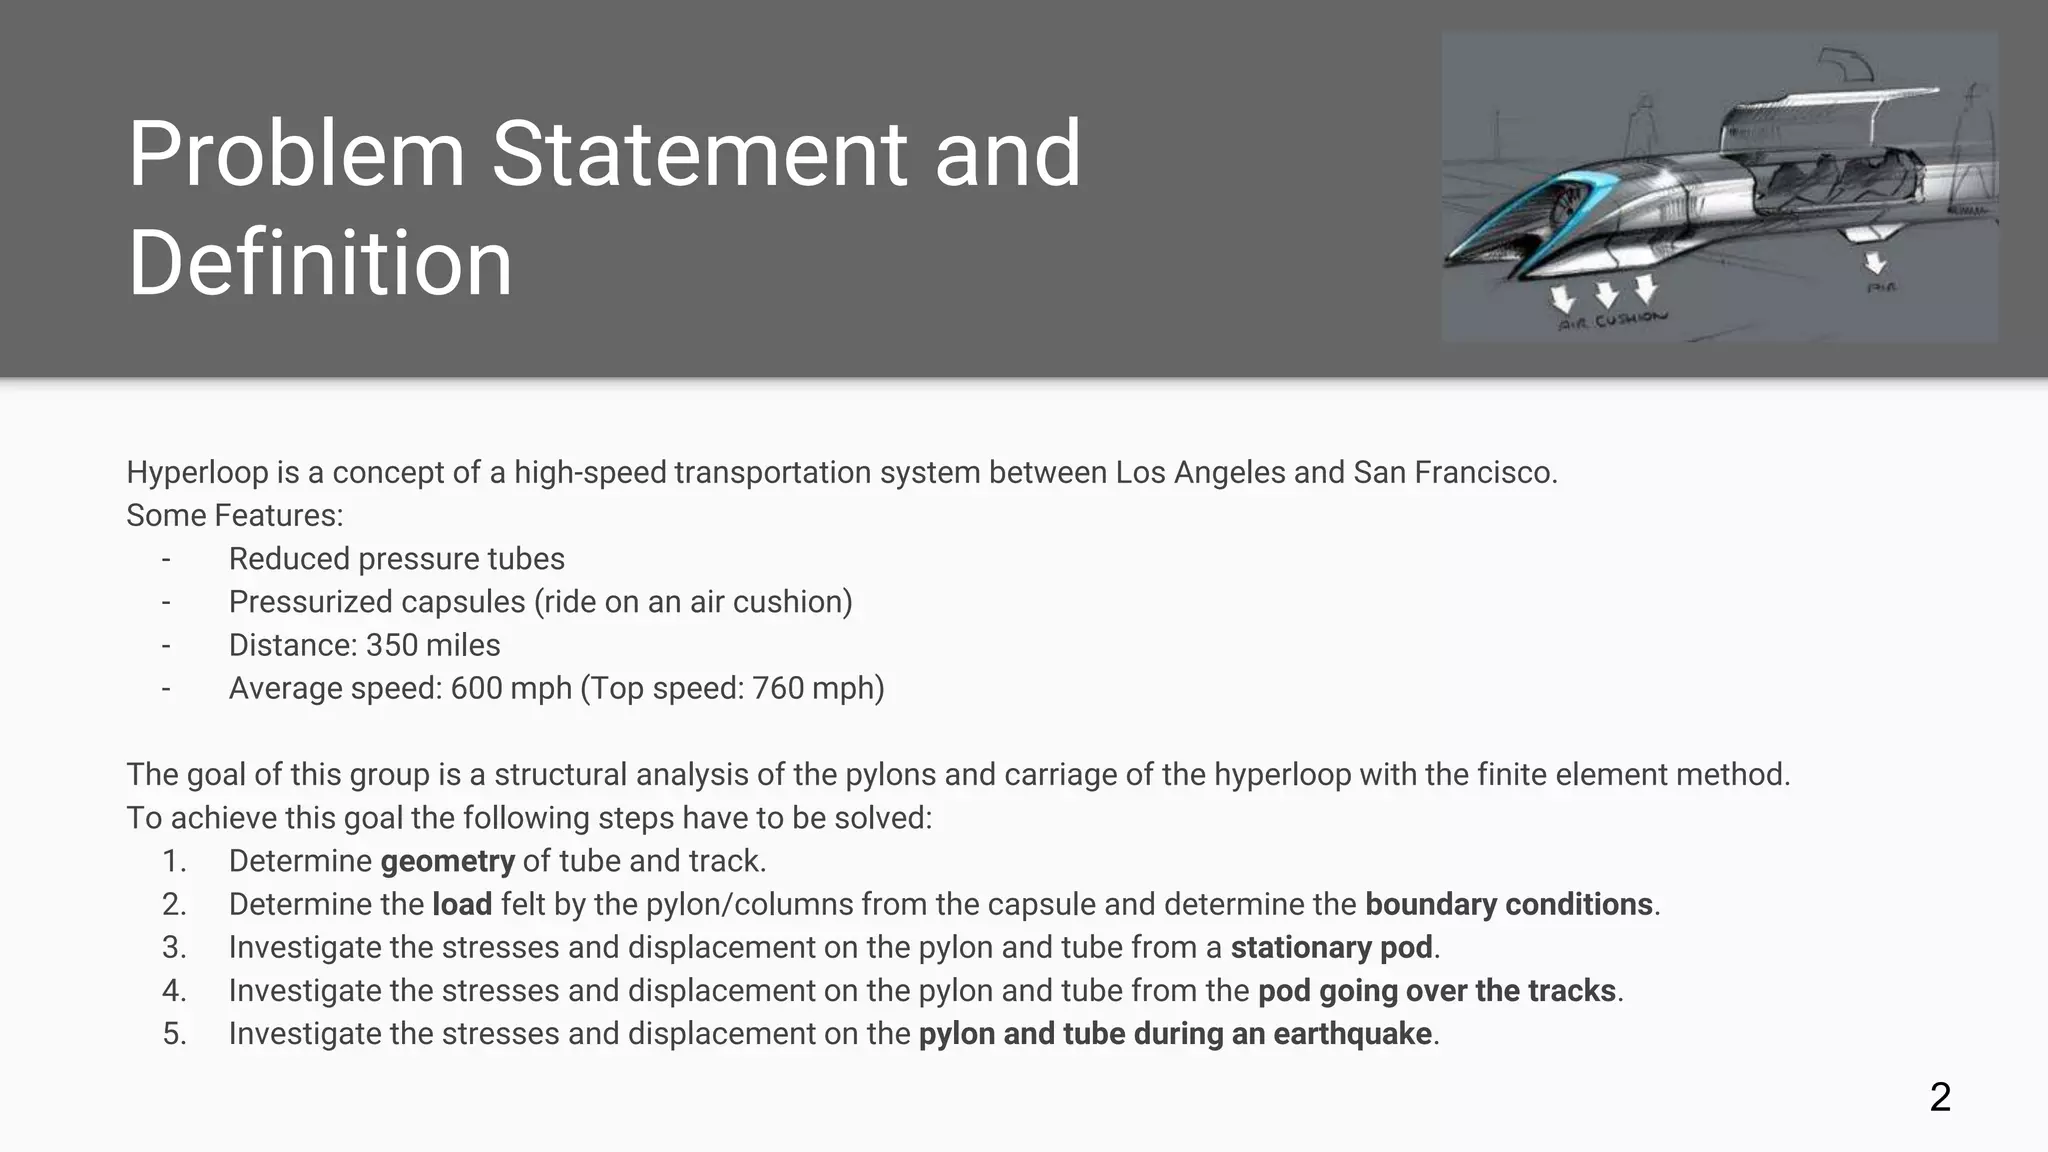
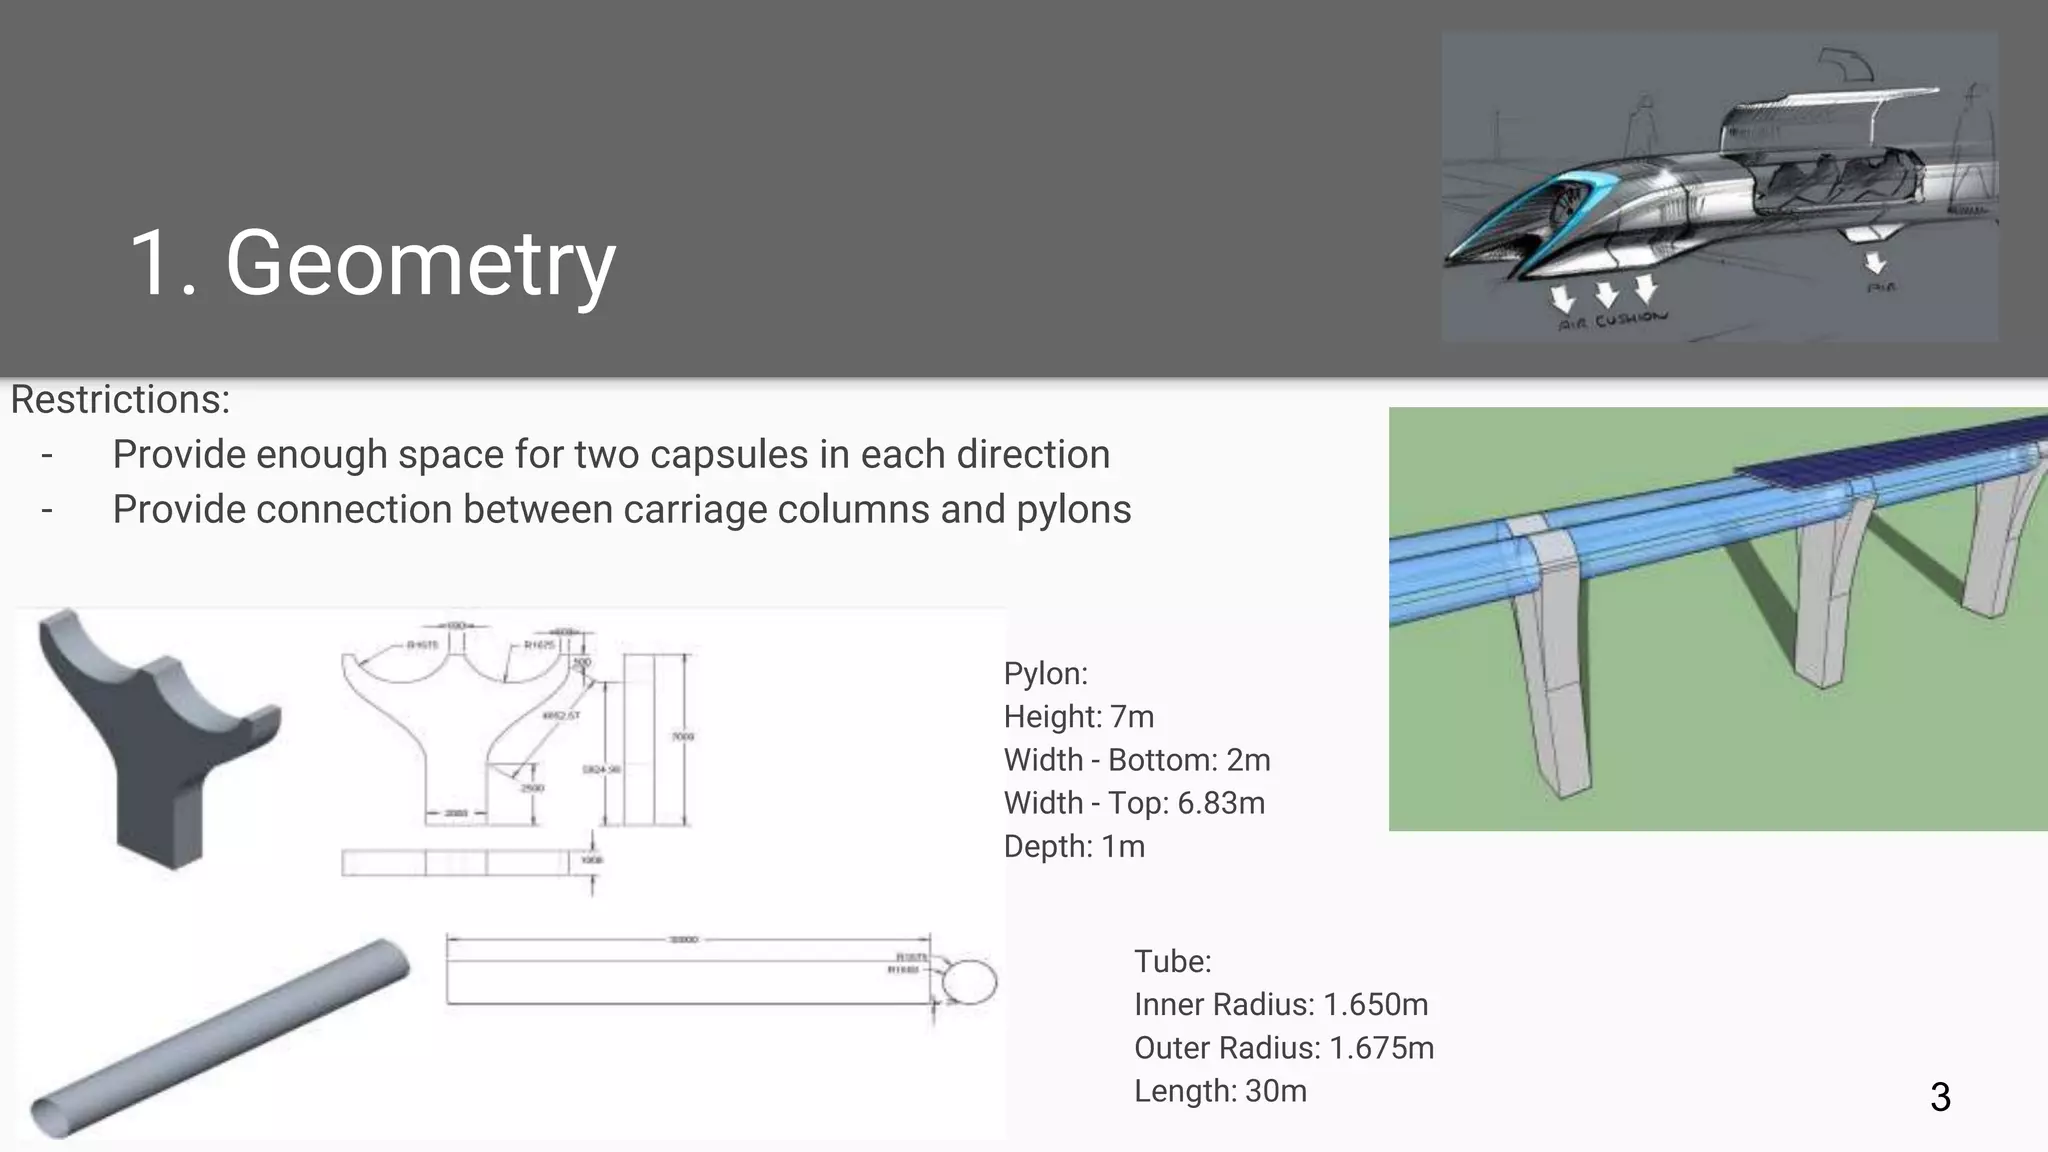
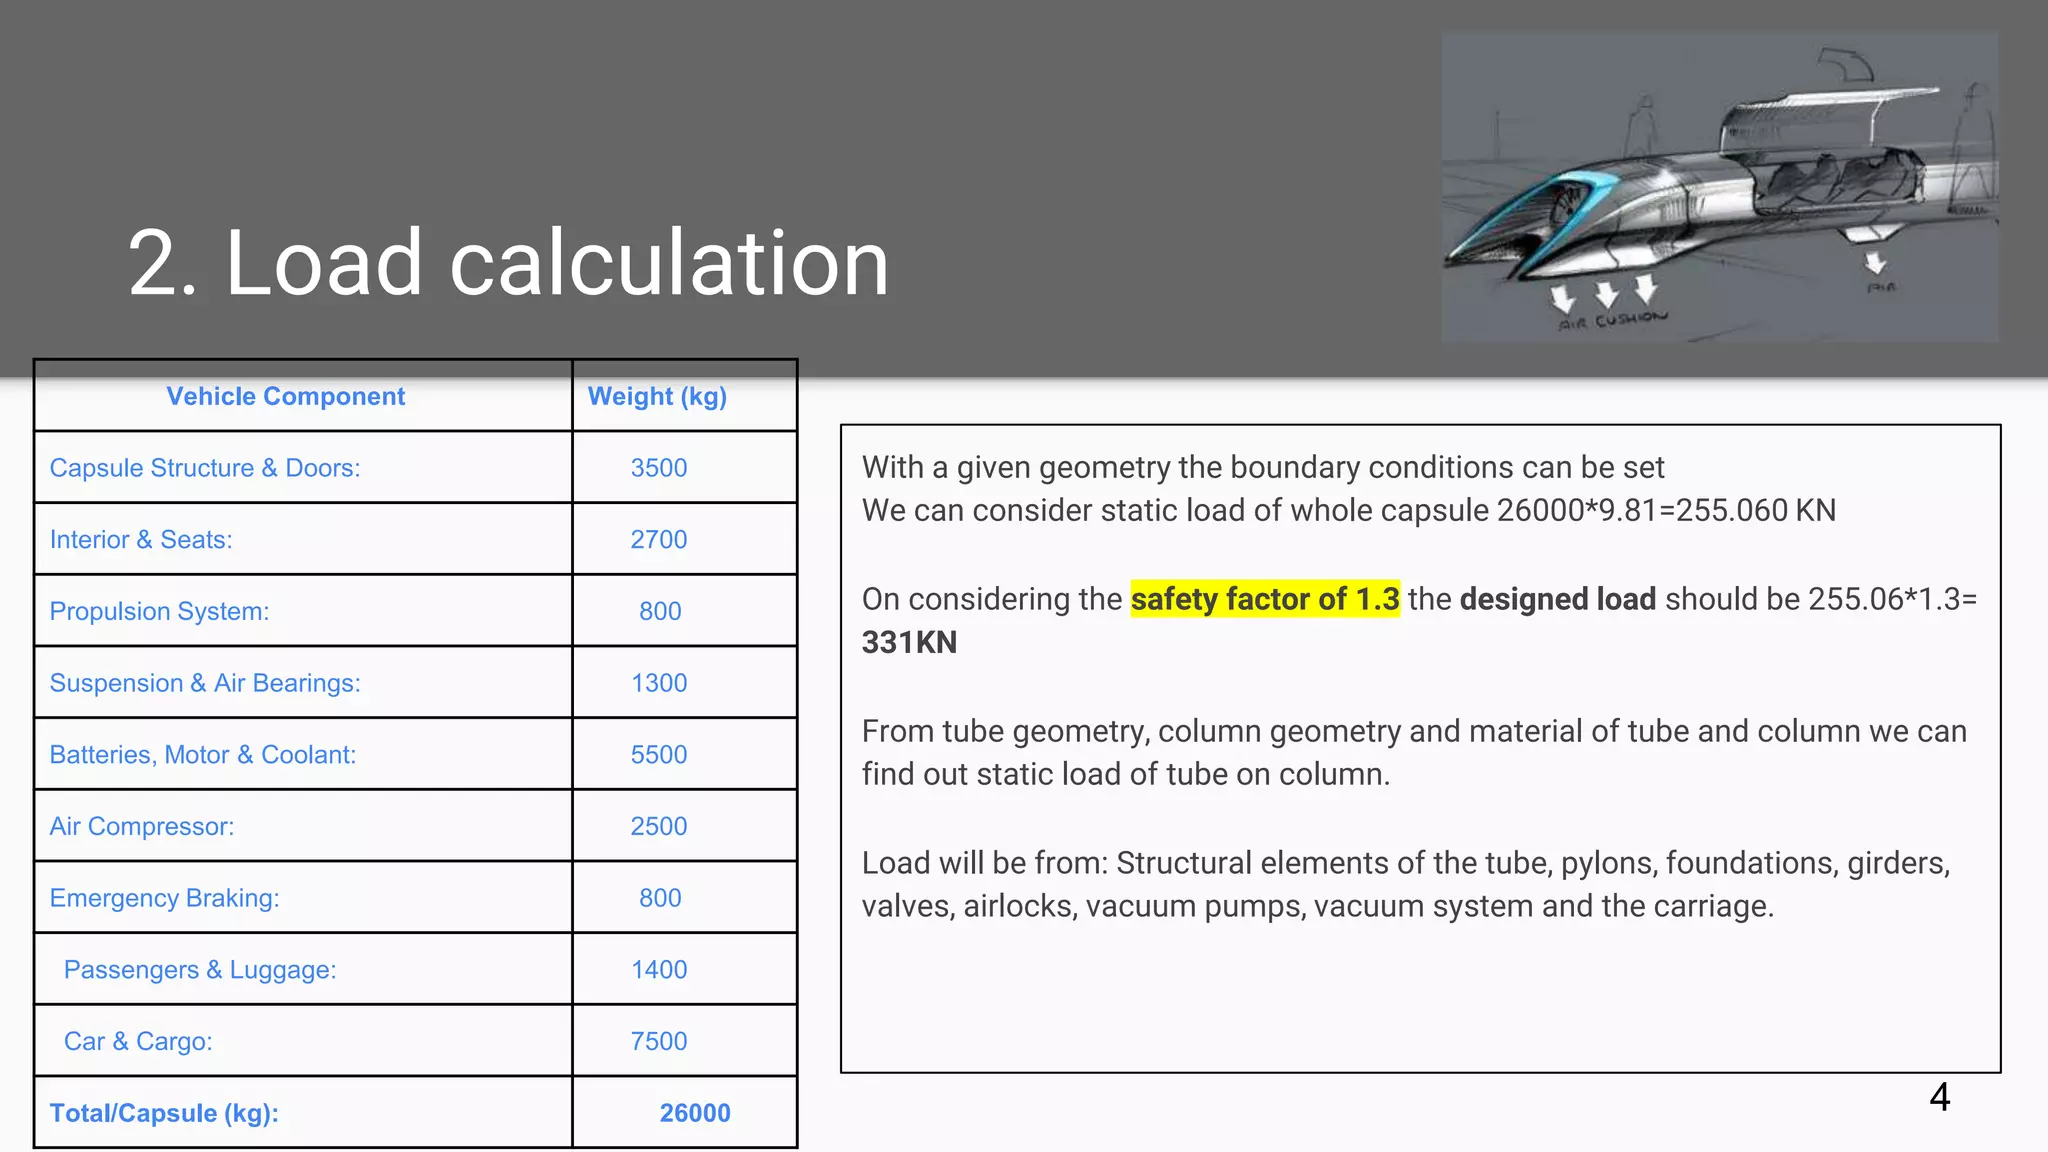
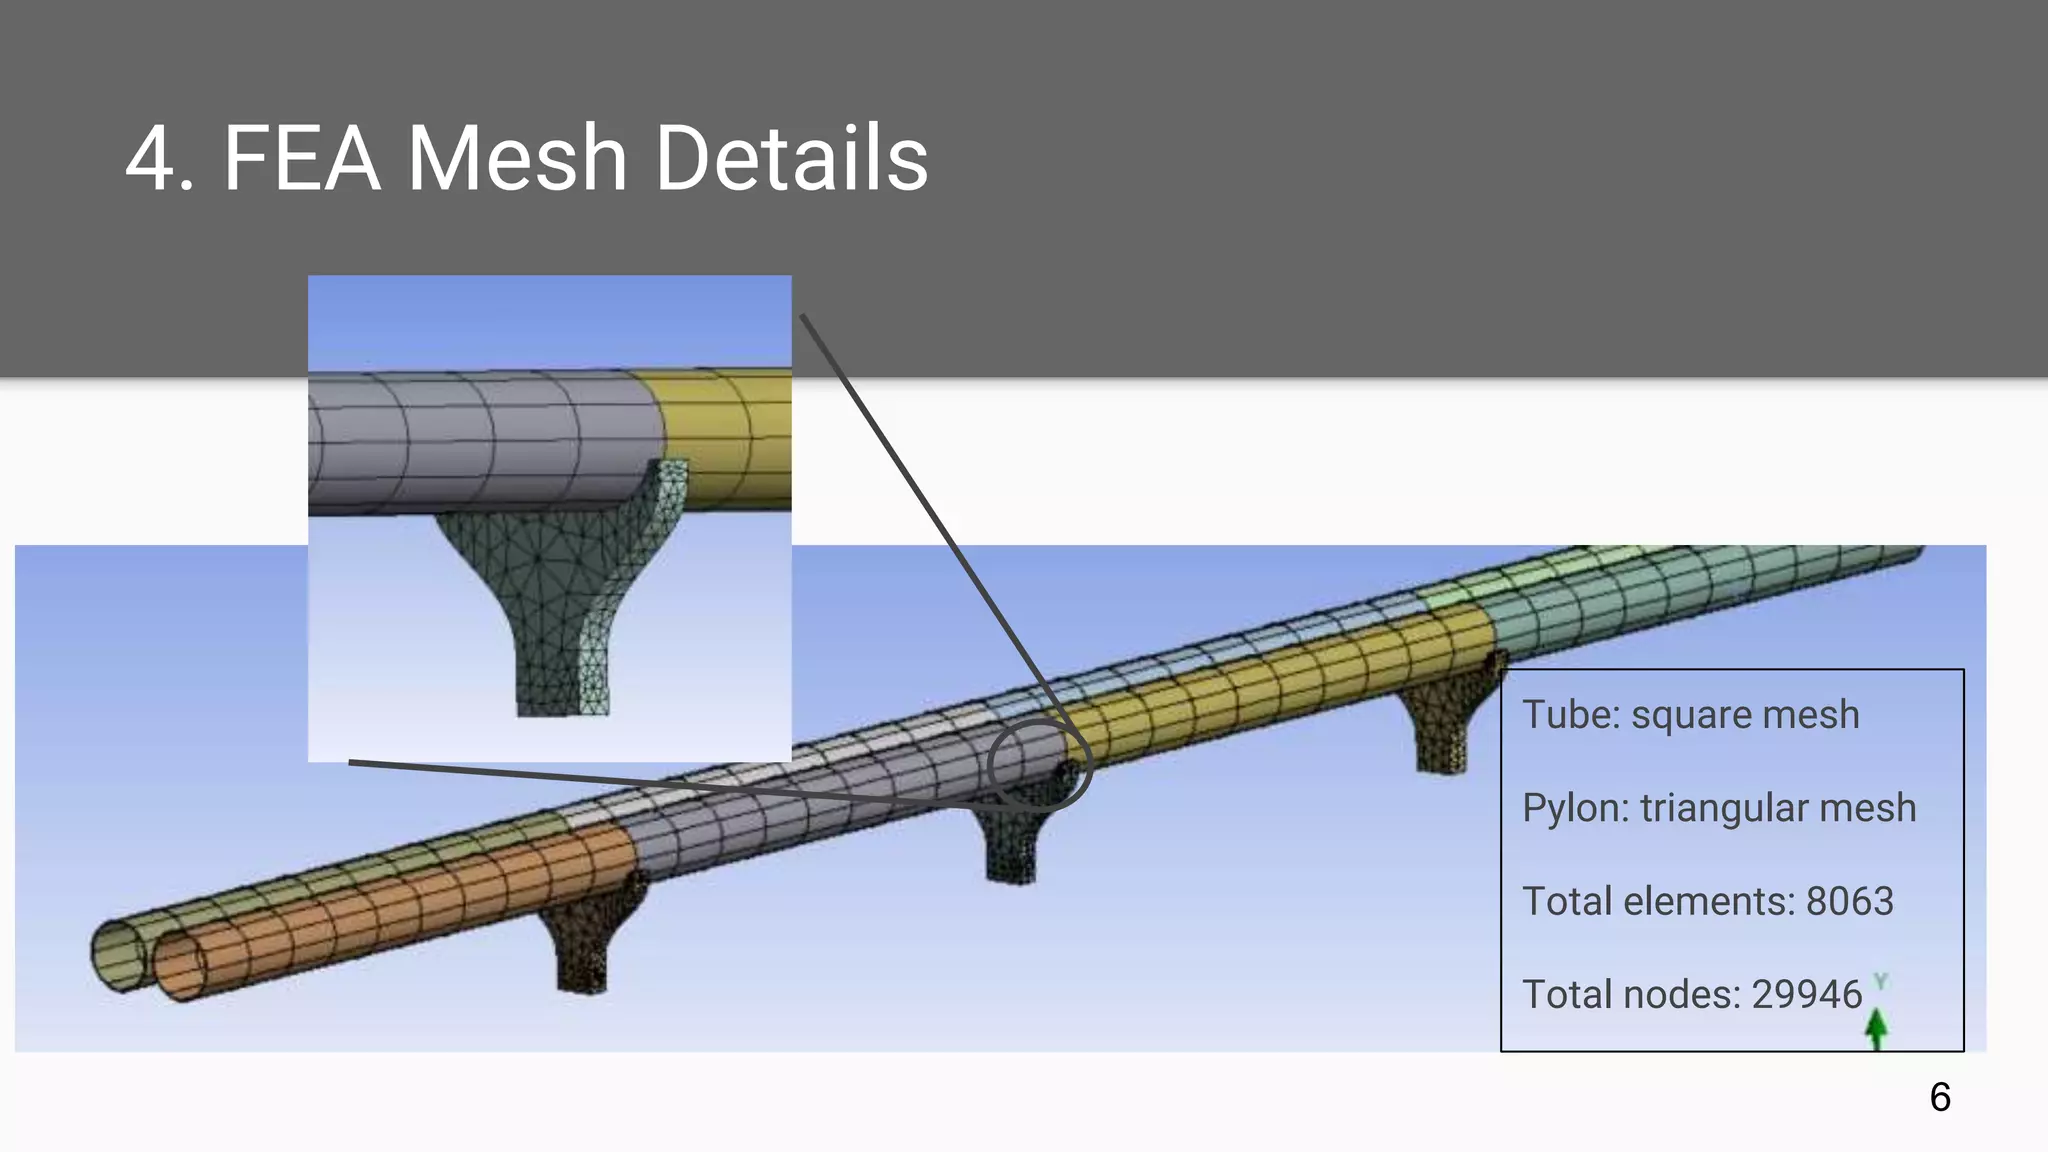
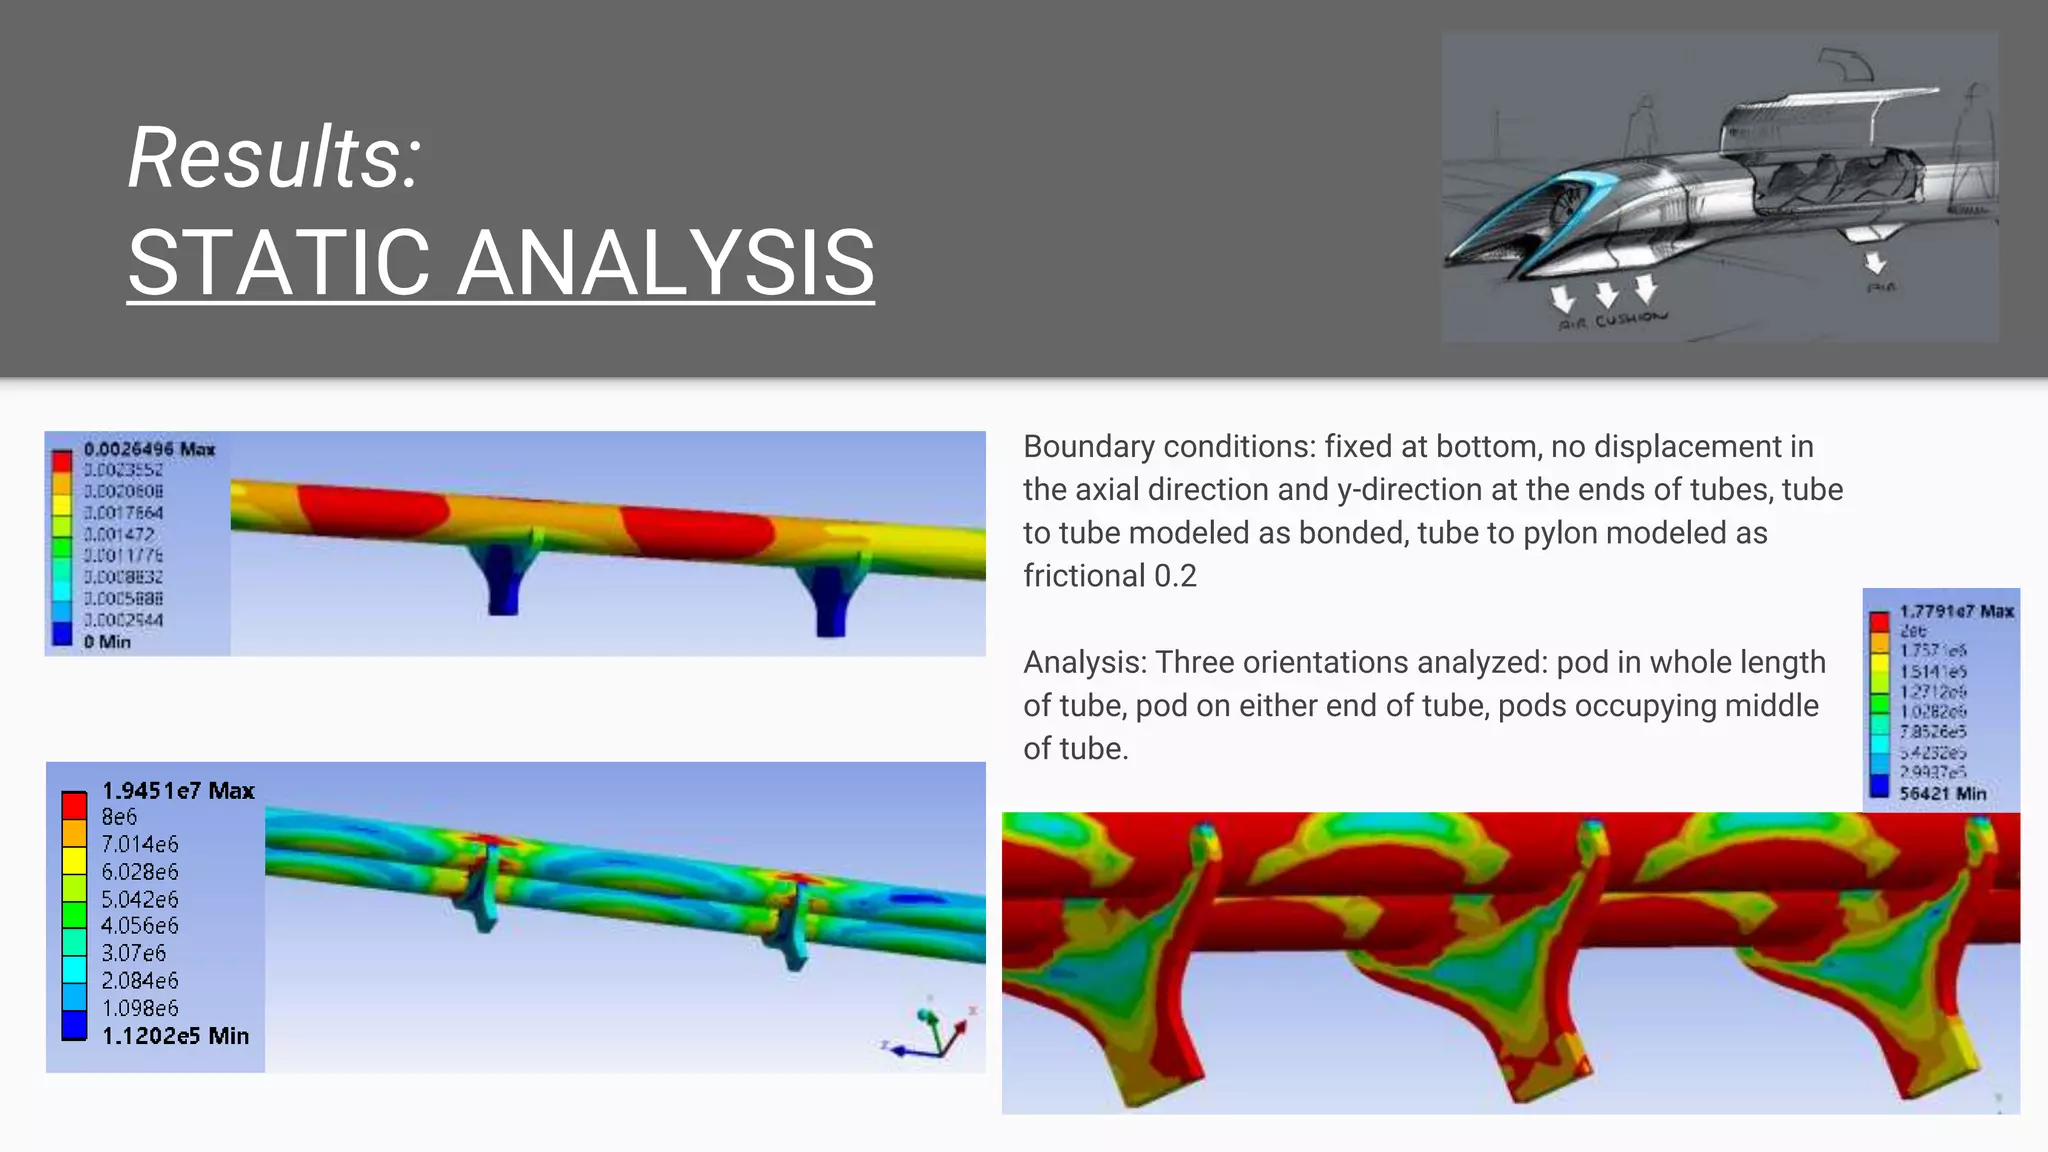
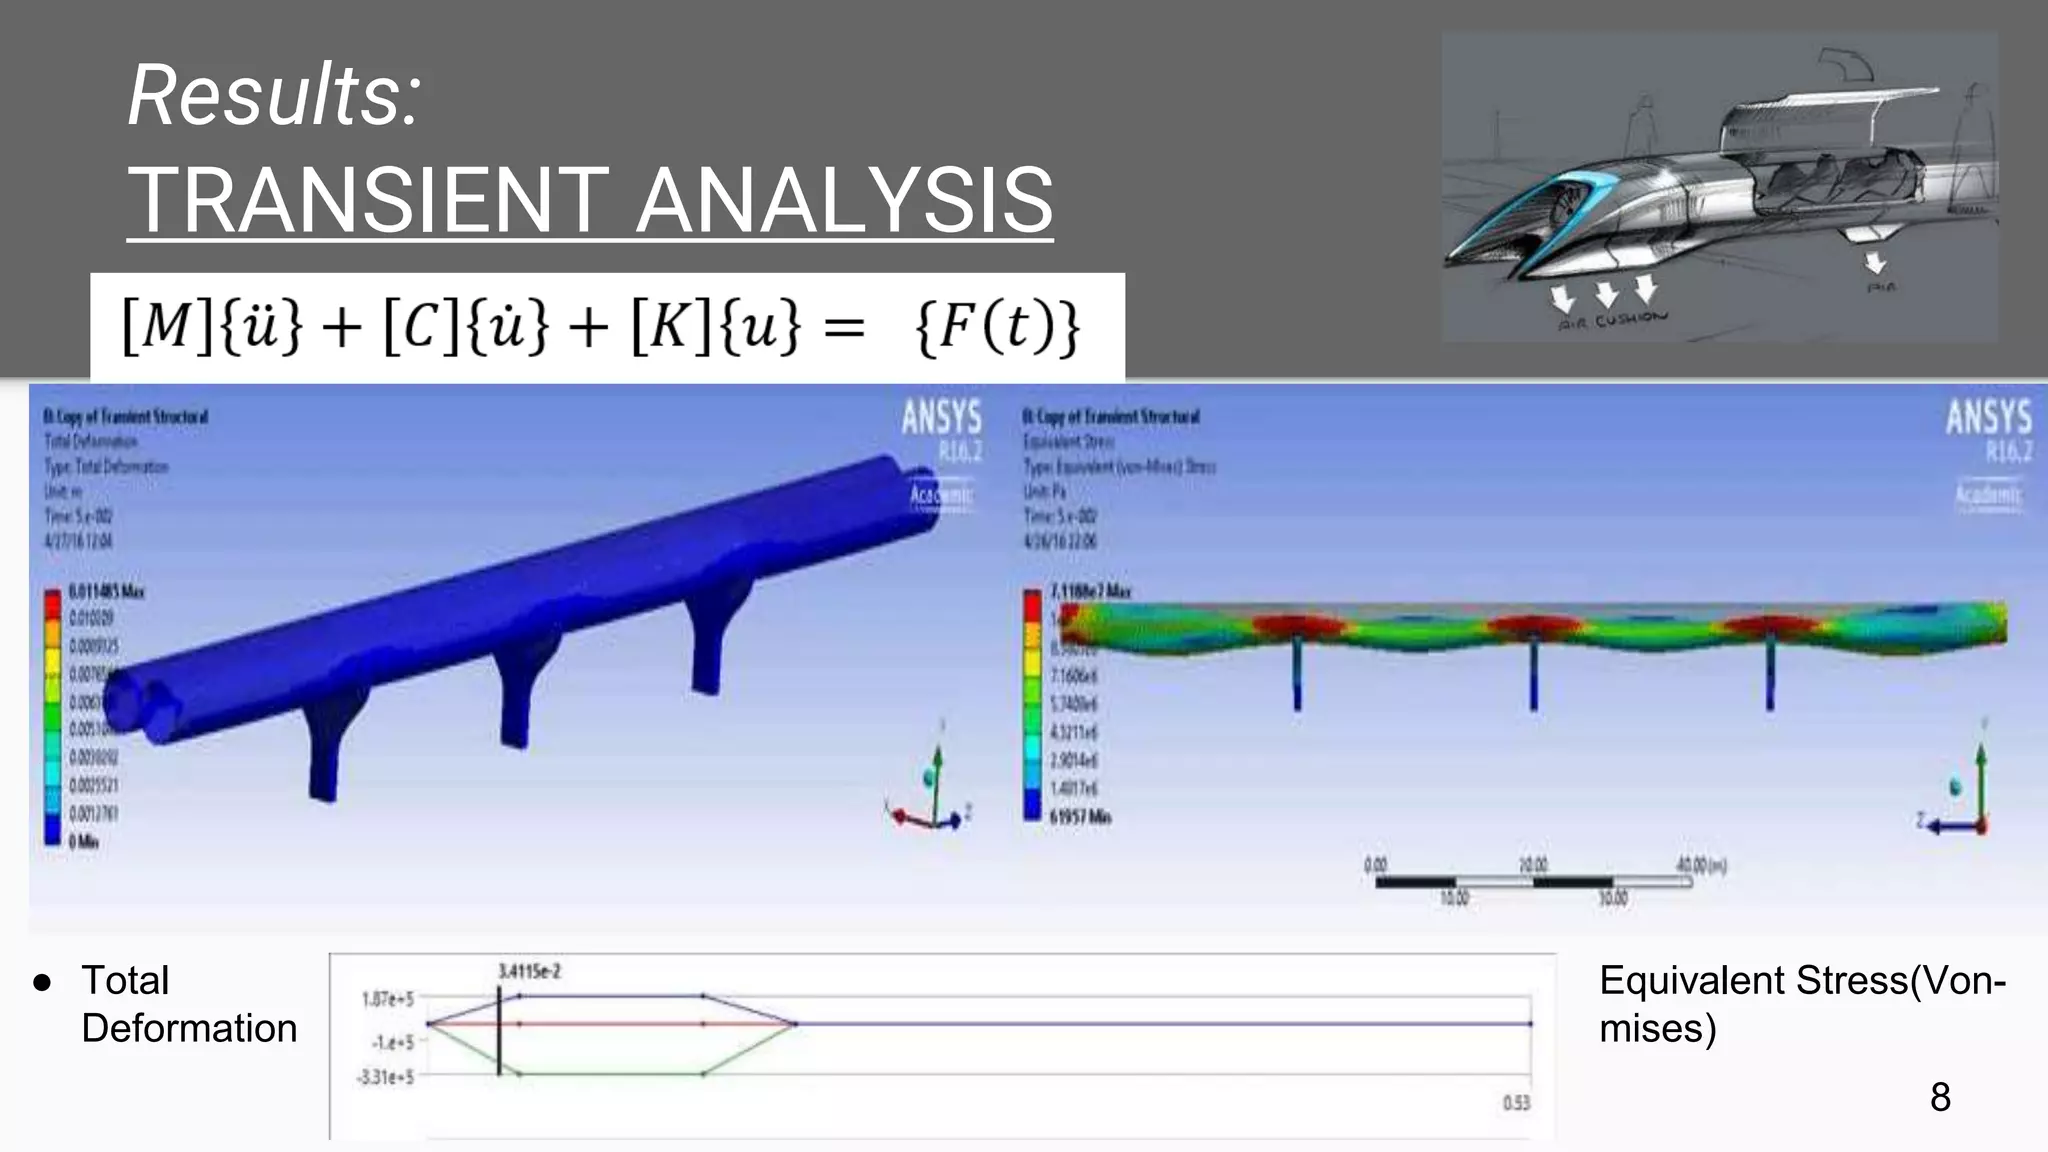
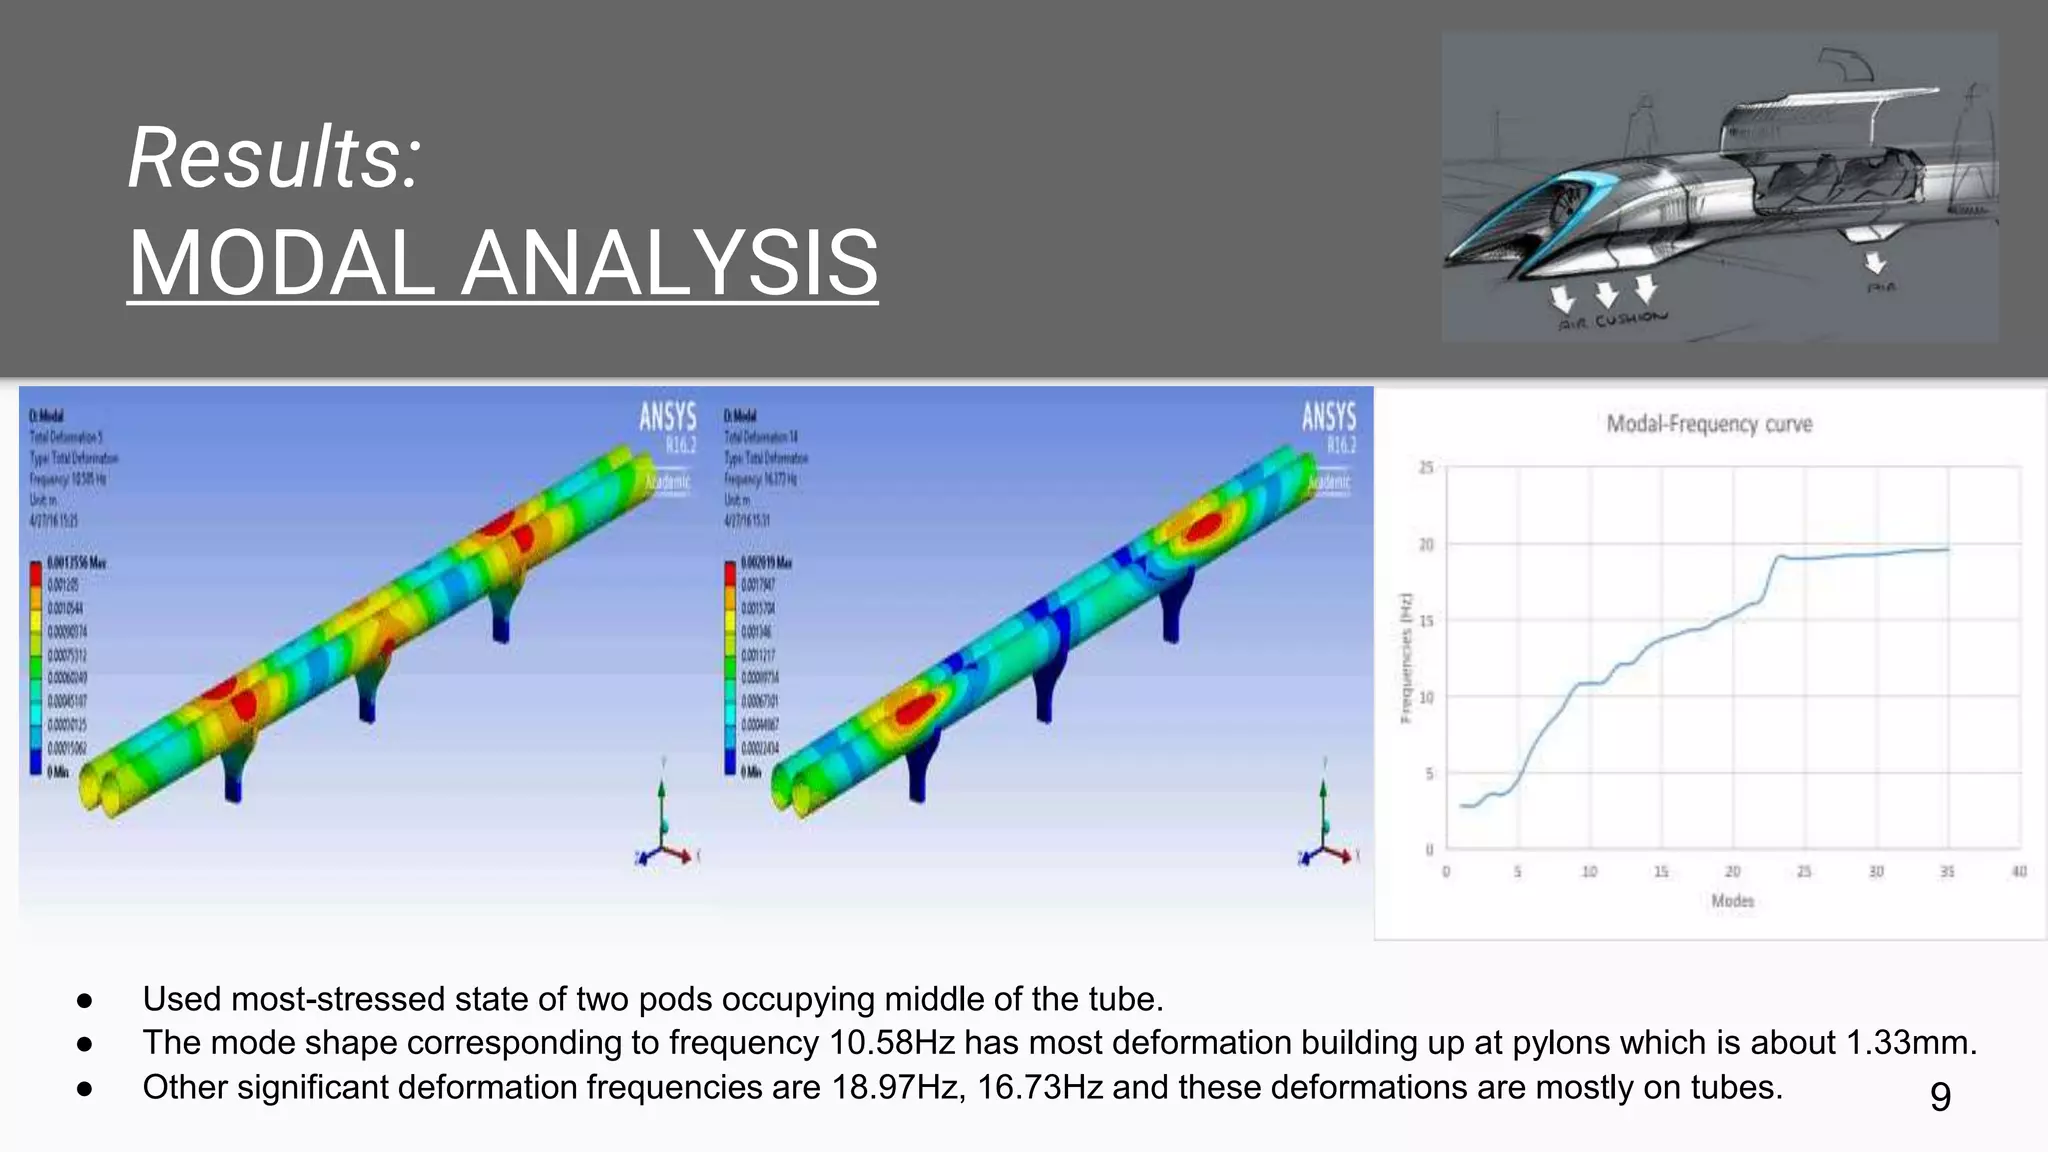
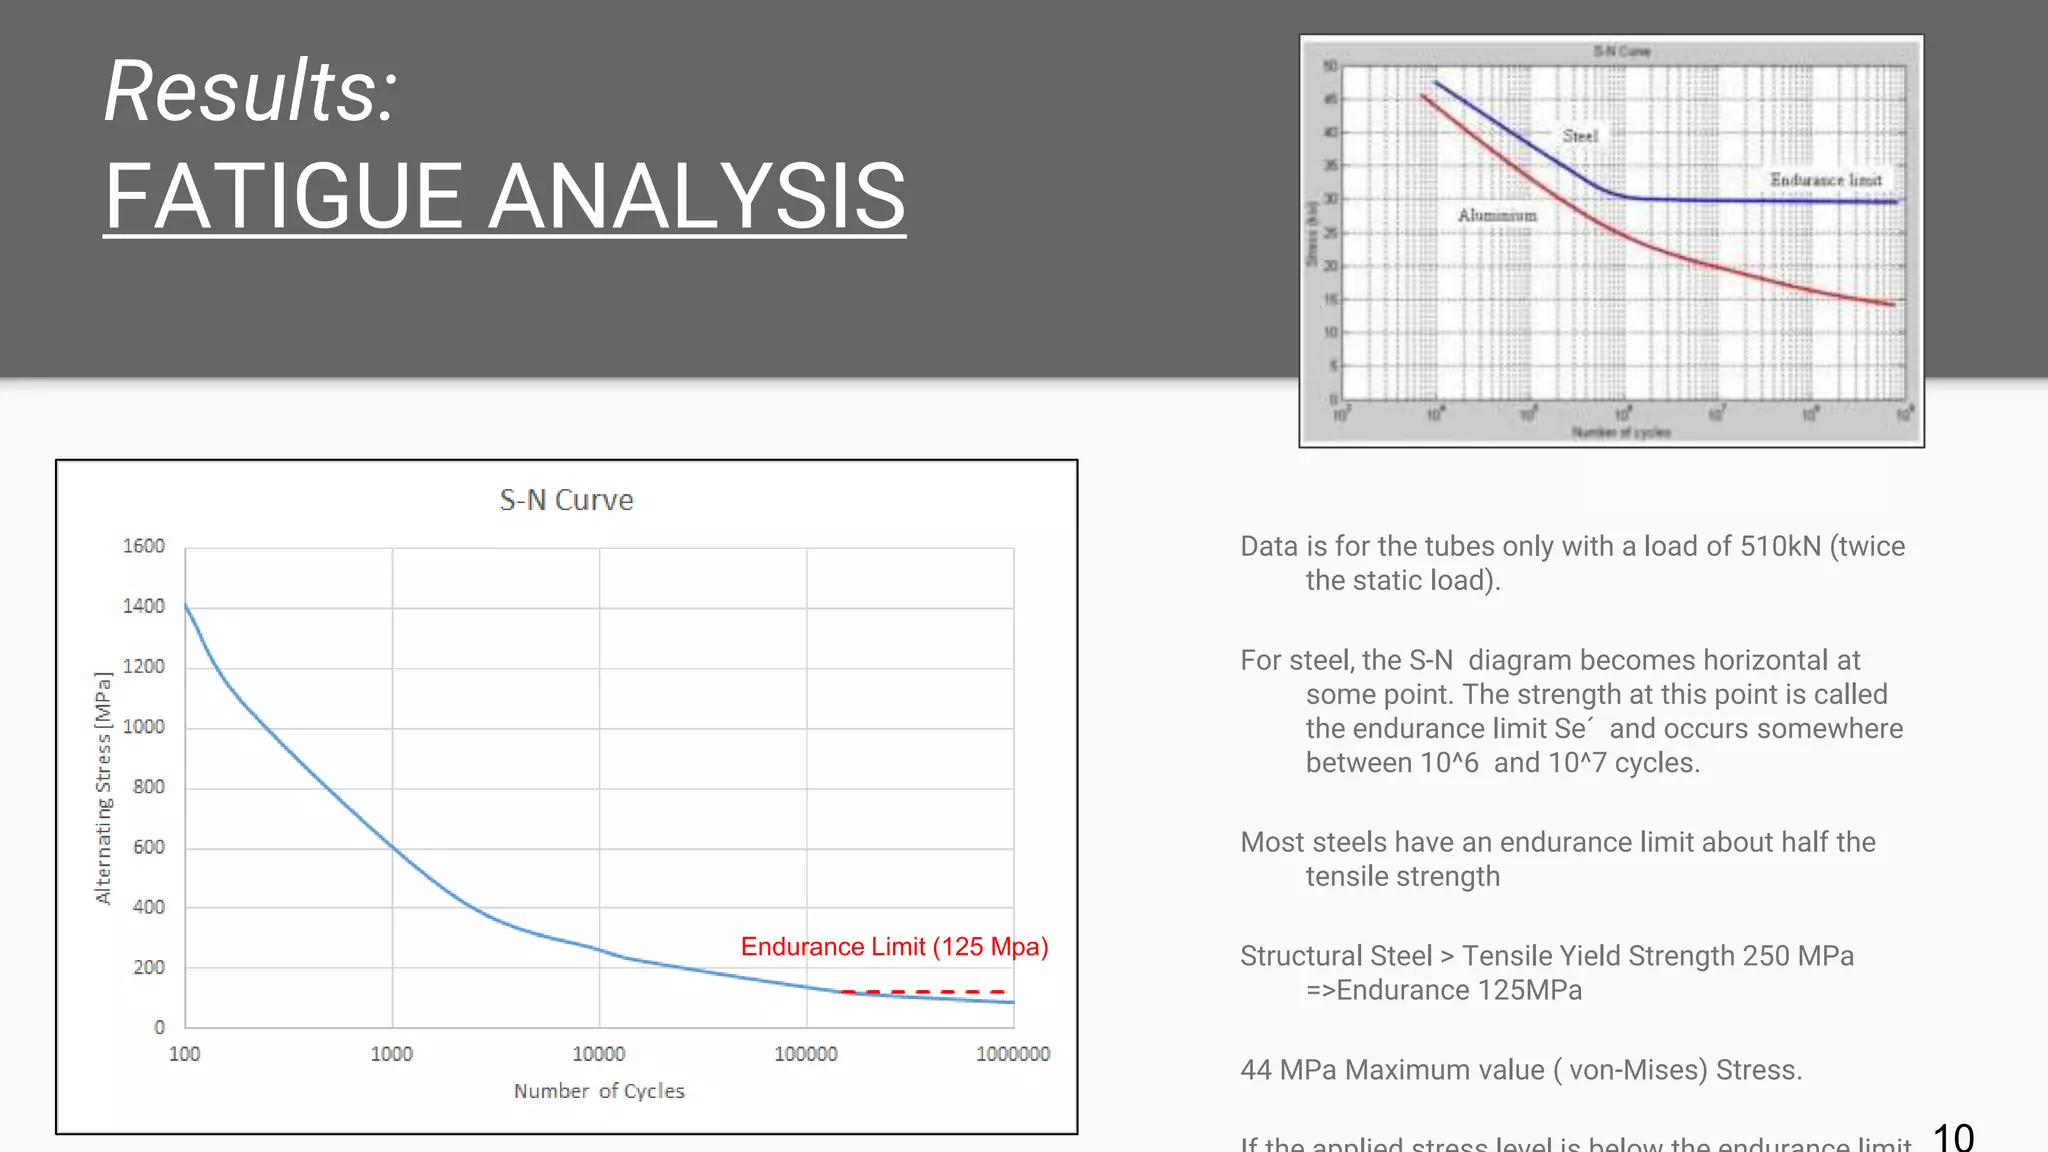
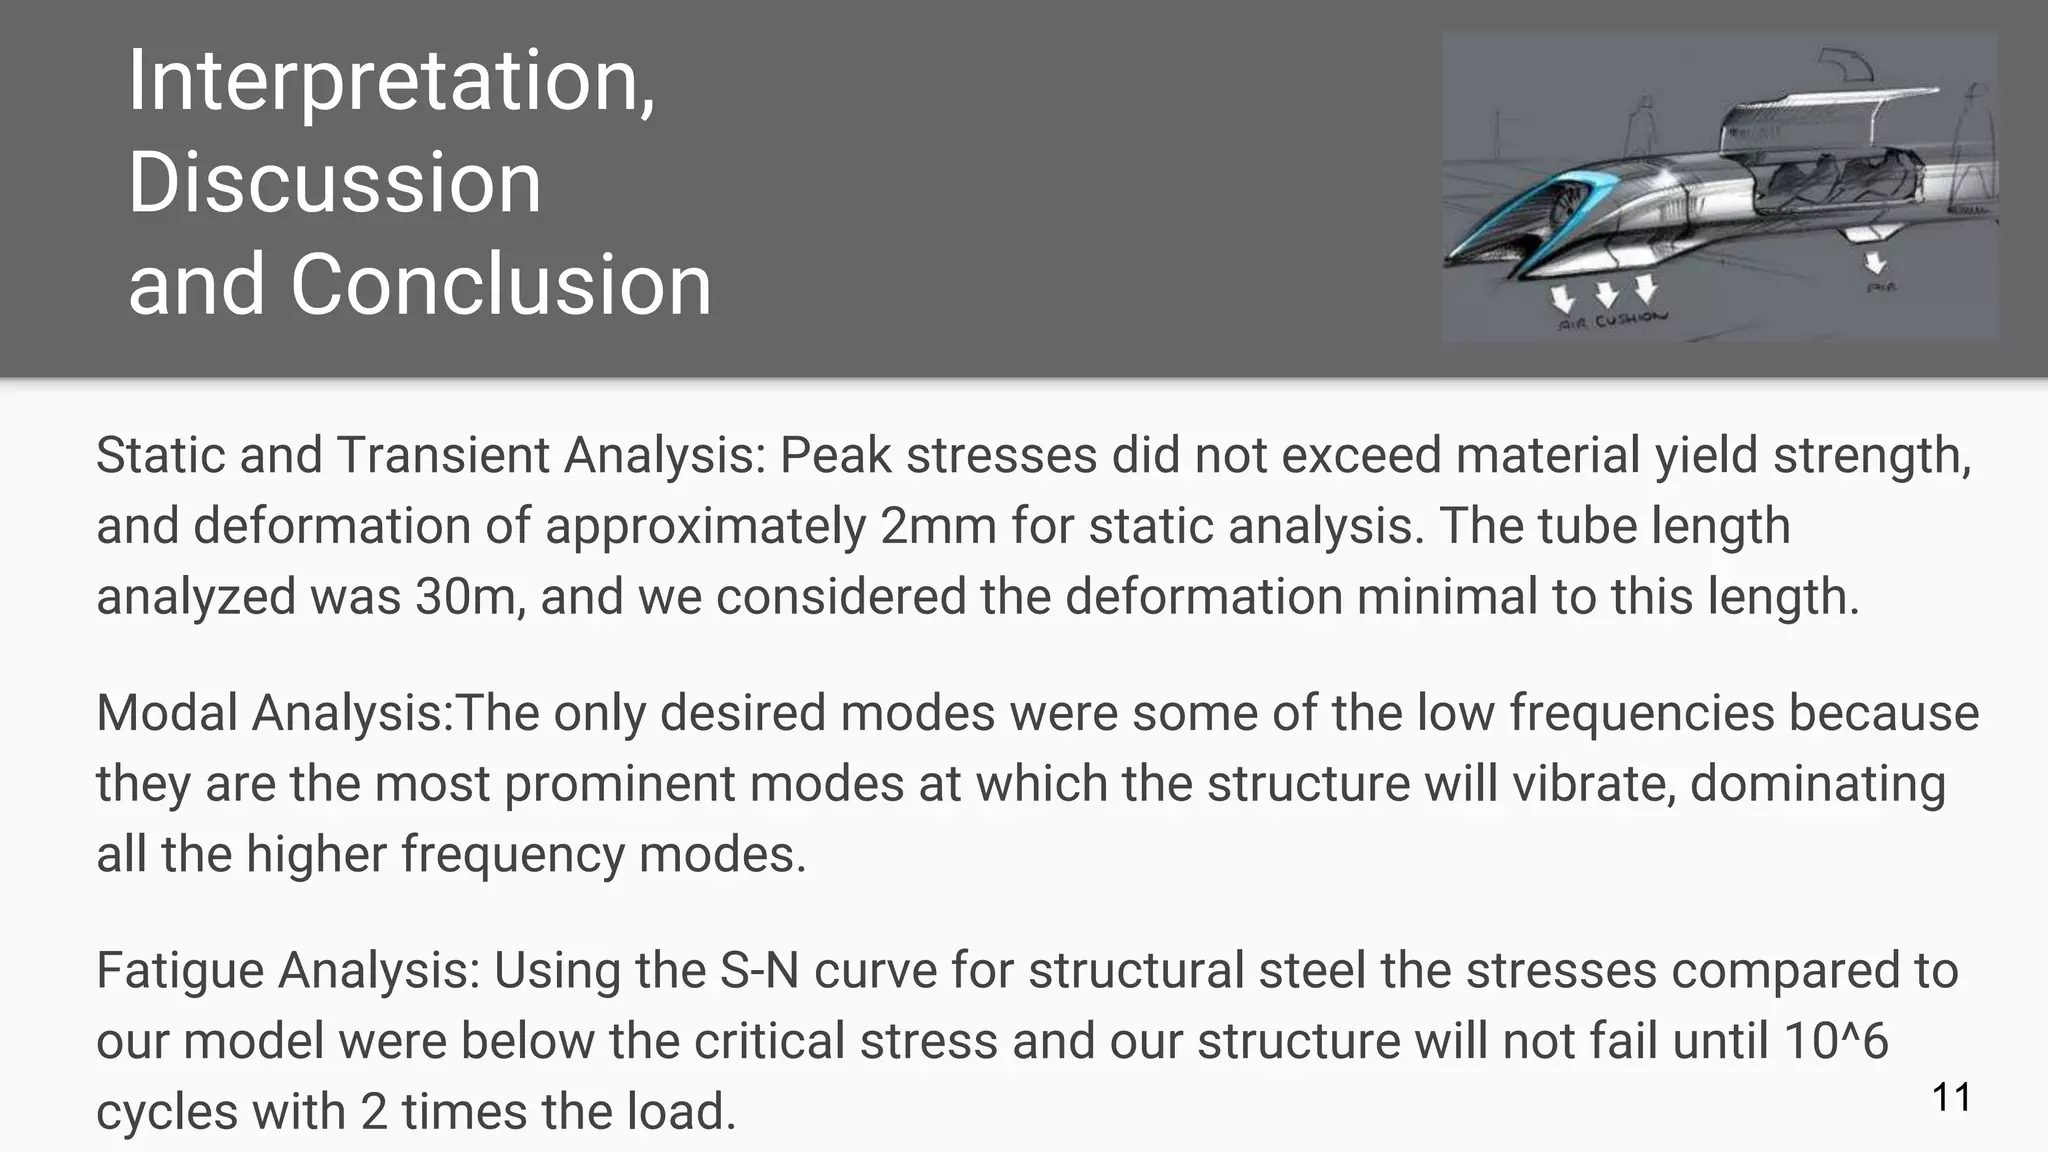
Structural Analysis of Pylons, Columns and Carriage
Elisa Buckner - Mehul Chauhan - Uliana Doro - Naman Gupta - Johannes Vogt - Alexander Andfossen
Problem Statement and
Definition
Hyperloop is a concept of a high-speed transportation system between Los Angeles and San Francisco.
Some Features:
- Reduced pressure tubes
- Pressurized capsules (ride on an air cushion)
- Distance: 350 miles
- Average speed: 600 mph (Top speed: 760 mph)
The goal of this group is a structural analysis of the pylons and carriage of the hyperloop with the finite element method.
To achieve this goal the following steps have to be solved:
1. Determine geometry of tube and track.
2. Determine the load felt by the pylon/columns from the capsule and determine the boundary conditions.
3. Investigate the stresses and displacement on the pylon and tube from a stationary pod.
4. Investigate the stresses and displacement on the pylon and tube from the pod going over the tracks.
5. Investigate the stresses and displacement on the pylon and tube during an earthquake.
2
1. Geometry
Restrictions:
- Provide enough space for two capsules in each direction
- Provide connection between carriage columns and pylons
3
Pylon:
Height: 7m
Width - Bottom: 2m
Width - Top: 6.83m
Depth: 1m
Tube:
Inner Radius: 1.650m
Outer Radius: 1.675m
Length: 30m
2. Load calculation
4
With a given geometry the boundary conditions can be set
We can consider static load of whole capsule 26000*9.81=255.060 KN
On considering the safety factor of 1.3 the designed load should be 255.06*1.3=
331KN
From tube geometry, column geometry and material of tube and column we can
find out static load of tube on column.
Load will be from: Structural elements of the tube, pylons, foundations, girders,
valves, airlocks, vacuum pumps, vacuum system and the carriage.
Vehicle Component Weight (kg)
Capsule Structure & Doors: 3500
Interior & Seats: 2700
Propulsion System: 800
Suspension & Air Bearings: 1300
Batteries, Motor & Coolant: 5500
Air Compressor: 2500
Emergency Braking: 800
Passengers & Luggage: 1400
Car & Cargo: 7500
Total/Capsule (kg): 26000
3. Material and Physics Used
5
ThrustDrag
mg
Fn ● Pylon: concrete
Yield Strength = 3 MPa (Tensile)
● Tube: structural steel
Yield Strength = 250 MPa
● Thrust obtained from compressor power
output
Compressor Output = 49MW
Force = 144kN (Power Unit
Conversion)
● Drag = 320N (From Alpha Doc)
● Frictional Forces Negligible from Air
Bearings
Direction of Movement
4. FEA Mesh Details
6
Tube: square mesh
Pylon: triangular mesh
Total elements: 8063
Total nodes: 29946
Results:
STATIC ANALYSIS
Boundary conditions: fixed at bottom, no displacement in
the axial direction and y-direction at the ends of tubes, tube
to tube modeled as bonded, tube to pylon modeled as
frictional 0.2
Analysis: Three orientations analyzed: pod in whole length
of tube, pod on either end of tube, pods occupying middle
of tube.
7
Results:
TRANSIENT ANALYSIS
8
● Total
Deformation
Equivalent Stress(Von-
mises)
Results:
MODAL ANALYSIS
9
● Used most-stressed state of two pods occupying middle of the tube.
● The mode shape corresponding to frequency 10.58Hz has most deformation building up at pylons which is about 1.33mm.
● Other significant deformation frequencies are 18.97Hz, 16.73Hz and these deformations are mostly on tubes.
Results:
FATIGUE ANALYSIS
Data is for the tubes only with a load of 510kN (twice
the static load).
For steel, the S-N diagram becomes horizontal at
some point. The strength at this point is called
the endurance limit Se´ and occurs somewhere
between 10^6 and 10^7 cycles.
Most steels have an endurance limit about half the
tensile strength
Structural Steel > Tensile Yield Strength 250 MPa
=>Endurance 125MPa
44 MPa Maximum value ( von-Mises) Stress.
Endurance Limit (125 Mpa)
Interpretation,
Discussion
and Conclusion
11
Static and Transient Analysis: Peak stresses did not exceed material yield strength,
and deformation of approximately 2mm for static analysis. The tube length
analyzed was 30m, and we considered the deformation minimal to this length.
Modal Analysis:The only desired modes were some of the low frequencies because
they are the most prominent modes at which the structure will vibrate, dominating
all the higher frequency modes.
Fatigue Analysis: Using the S-N curve for structural steel the stresses compared to
our model were below the critical stress and our structure will not fail until 10^6
cycles with 2 times the load.
References
http://www.spacex.com/sites/spacex/files/hyperloop_alpha-20130812.pdf
http://www.computationalfluiddynamics.com.au/ansys-multiphysics-elon-musk-
hyperloop
https://www.youtube.com/watch?v=haJD6gPZwGo
http://earthquake.usgs.gov/learn/facts.php
http://forums.thepaceline.net/showthread.php?t=148267&page=4
http://www.ux.uis.no/~hirpa/KdB/ME/S-N%20diagram.pdf
12

FINAL Hyperloop Structure Analysis- Pylon,Columns,and Carriage

  • 1.
    Structural Analysis ofPylons, Columns and Carriage Elisa Buckner - Mehul Chauhan - Uliana Doro - Naman Gupta - Johannes Vogt - Alexander Andfossen
  • 2.
    Problem Statement and Definition Hyperloopis a concept of a high-speed transportation system between Los Angeles and San Francisco. Some Features: - Reduced pressure tubes - Pressurized capsules (ride on an air cushion) - Distance: 350 miles - Average speed: 600 mph (Top speed: 760 mph) The goal of this group is a structural analysis of the pylons and carriage of the hyperloop with the finite element method. To achieve this goal the following steps have to be solved: 1. Determine geometry of tube and track. 2. Determine the load felt by the pylon/columns from the capsule and determine the boundary conditions. 3. Investigate the stresses and displacement on the pylon and tube from a stationary pod. 4. Investigate the stresses and displacement on the pylon and tube from the pod going over the tracks. 5. Investigate the stresses and displacement on the pylon and tube during an earthquake. 2
  • 3.
    1. Geometry Restrictions: - Provideenough space for two capsules in each direction - Provide connection between carriage columns and pylons 3 Pylon: Height: 7m Width - Bottom: 2m Width - Top: 6.83m Depth: 1m Tube: Inner Radius: 1.650m Outer Radius: 1.675m Length: 30m
  • 4.
    2. Load calculation 4 Witha given geometry the boundary conditions can be set We can consider static load of whole capsule 26000*9.81=255.060 KN On considering the safety factor of 1.3 the designed load should be 255.06*1.3= 331KN From tube geometry, column geometry and material of tube and column we can find out static load of tube on column. Load will be from: Structural elements of the tube, pylons, foundations, girders, valves, airlocks, vacuum pumps, vacuum system and the carriage. Vehicle Component Weight (kg) Capsule Structure & Doors: 3500 Interior & Seats: 2700 Propulsion System: 800 Suspension & Air Bearings: 1300 Batteries, Motor & Coolant: 5500 Air Compressor: 2500 Emergency Braking: 800 Passengers & Luggage: 1400 Car & Cargo: 7500 Total/Capsule (kg): 26000
  • 5.
    3. Material andPhysics Used 5 ThrustDrag mg Fn ● Pylon: concrete Yield Strength = 3 MPa (Tensile) ● Tube: structural steel Yield Strength = 250 MPa ● Thrust obtained from compressor power output Compressor Output = 49MW Force = 144kN (Power Unit Conversion) ● Drag = 320N (From Alpha Doc) ● Frictional Forces Negligible from Air Bearings Direction of Movement
  • 6.
    4. FEA MeshDetails 6 Tube: square mesh Pylon: triangular mesh Total elements: 8063 Total nodes: 29946
  • 7.
    Results: STATIC ANALYSIS Boundary conditions:fixed at bottom, no displacement in the axial direction and y-direction at the ends of tubes, tube to tube modeled as bonded, tube to pylon modeled as frictional 0.2 Analysis: Three orientations analyzed: pod in whole length of tube, pod on either end of tube, pods occupying middle of tube. 7
  • 8.
  • 9.
    Results: MODAL ANALYSIS 9 ● Usedmost-stressed state of two pods occupying middle of the tube. ● The mode shape corresponding to frequency 10.58Hz has most deformation building up at pylons which is about 1.33mm. ● Other significant deformation frequencies are 18.97Hz, 16.73Hz and these deformations are mostly on tubes.
  • 10.
    Results: FATIGUE ANALYSIS Data isfor the tubes only with a load of 510kN (twice the static load). For steel, the S-N diagram becomes horizontal at some point. The strength at this point is called the endurance limit Se´ and occurs somewhere between 10^6 and 10^7 cycles. Most steels have an endurance limit about half the tensile strength Structural Steel > Tensile Yield Strength 250 MPa =>Endurance 125MPa 44 MPa Maximum value ( von-Mises) Stress. Endurance Limit (125 Mpa)
  • 11.
    Interpretation, Discussion and Conclusion 11 Static andTransient Analysis: Peak stresses did not exceed material yield strength, and deformation of approximately 2mm for static analysis. The tube length analyzed was 30m, and we considered the deformation minimal to this length. Modal Analysis:The only desired modes were some of the low frequencies because they are the most prominent modes at which the structure will vibrate, dominating all the higher frequency modes. Fatigue Analysis: Using the S-N curve for structural steel the stresses compared to our model were below the critical stress and our structure will not fail until 10^6 cycles with 2 times the load.
  • 12.

Editor's Notes

  • #3 Uliana
  • #4 Johannes
  • #5 Alex
  • #6 Uliana
  • #7 Elisa
  • #8 Elisa For static analysis we took into consideration 4 cases: the structure without the weight of the pod, the tube completely filled with pods, the pod at either end, and the pod in the middle. The pictures on the left show the pods in the whole length of the tube seen with the circular radiating stress under the tube. The most deformation is between pylons where it is least supported. The picture on the right shows the pod at either end, therefore the stress on the pylons are biased toward the side the pod is sitting on and the middle pylon the stress is symmetric. Max due to gravity: 5MPa 2.2mm Max due to pod in every tube:7.52 MPa 2.6mm Max due to pod at ends: 7.53 MPa 2.1 mm Max due to pod in the middle: 8.76 MPa 2.46mm
  • #9 Mehul
  • #10 Naman
  • #11 Johannes/Alex the S-N curve and some FEA pictures from Ansys with some writing.
  • #12 Naman