TỔNG HỢP HƠN 100 ĐỀ THI THỬ TỐT NGHIỆP THPT TOÁN 2024 - TỪ CÁC TRƯỜNG, TRƯỜNG...
W9 Notes.docx
1. KLISH EDUCATION | IELTS BUD WRITING BAR CHARTS & TABLES
1
WRITING TASK 1 | Bar Charts & Tables
Similar / Opposite patterns
Categories
Legends
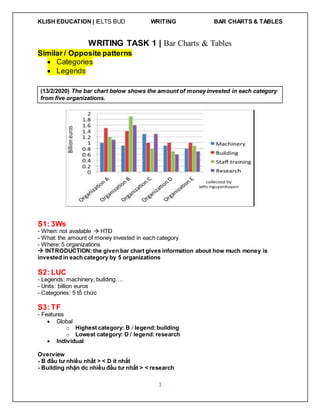
(13/2/2020) The bar chart below shows the amount of money invested in each category
from five organizations.
S1: 3Ws
- When: not available HTĐ
- What: the amount of money invested in each category
- Where: 5 organizations
INTRODUCTION:the given bar chart gives information about how much money is
invested in each category by 5 organizations
S2: LUC
- Legends: machinery, building….
- Units: billion euros
- Categories: 5 tổ chức
S3: TF
- Features
Global
o Highest category: B / legend:building
o Lowest category: D / legend:research
Individual
Overview
- B đầu tư nhiều nhất > < D ít nhất
- Building nhận dc nhiều đầu tư nhất > < research
2. KLISH EDUCATION | IELTS BUD WRITING BAR CHARTS & TABLES
2
Body 1: A – B Body 2: C – D – E
- machinery A > B: 0.1
- building A > B: 0.1
- An opposite pattern is seen
in the investment in staff
training and research
- Staff training B > A: 0.7
- Research B > A: 0.5
3 so sánh hơn kém
3 số liệu
- building (C = D = E) = 1
billion
- staff training: quite similar,
averaging 0.8 billion euros
- machinery + research (D =
E) 1.5 billion euros < 2.6
billion of company C
3 so sánh bằng
1 so sánh hơn kém
4 số liệu
7/20 số
3. KLISH EDUCATION | IELTS BUD WRITING PIE CHARTS
3
WRITING TASK 1 | Pie Charts
I. Types of pie charts
1. Changes over time ~ Line graphs
Languages of Trends (increase, decrease, fluctuate….)
Grouping methods: Legends & Time period
2. Comparison ~ Bar charts & tablese
Languages of Comparison (higher, lower, double, highest….)
Grouping methods: Similar & Opposite
II. The 3-step approach
1. Changes over time
S1: 3Ws
S2: LUC
- Legends: manufacturing & sales & services
- Units: % đa dạng ngôn từ = A / B
+ The percentage / proportion of employees working as salespeople in town A in 1960 was
49%
X + be + number (1)
X = the number of students studying in ___
X = beef consumption
X = spending on clothes….
+ The percentage / proportion of employees working as salespeople in town A in 1960 was
49%
The percentage / proportion of employees working as salespeople in town A in 1960 was
about a half
There + be + number + noun + MDQH (2)
There were 49%of employees working as salespeople in town Ain 1960
There were about a half of employees working as salespeople in town Ain 1960
Number + noun + verb (3)
49% of employees worked as salespeople in town A in 1960
about a half of employees worked as salespeople in town Ain 1960
% = A / B (4)
25% a quarter
50% a half
75% 3 quarters
49 about a half
51 about a half
Higher: quy về số đẹp gần nhất & cao hơn: (just) under / less than
4. KLISH EDUCATION | IELTS BUD WRITING PIE CHARTS
4
Lower: quy về số đẹp gần nhất & thấp hơn: (just) over / more than
Both: about, around, approximately, roughly, nearly…
*trong phạm vi 2-3%
*chỉ dùng với công thức viết 2 – 3
52-53 50
59 50
47 – 48 50
39 – 40 50
A account for / amount to / take up / make up / comprise of
…% of B (5)
+ The percentage / proportion of employees working as salespeople in town A in 1960 was
49%
A = salespeople
B = all employees
Salespeople accounted for 49% of all employees in town A in 1960
1960
comparison
2010
comparison & trends
- service: A = 30%, higher than
20% of B
- manufacturing A; 29% while B:
8%
- Sales: highest,in both towns. B:
72 % and A: 41%
- service A halved to 16%,6%
lower than B
- manufacturing A more than
doubled to 64% whereas
manufacturing B experienced a
three-fold increase
- sales A was half of its previous
level while sales B reduced by
18%
5 cấu trúc mô tả trend
1960 – 2010
sales A reduced by 21%
5. KLISH EDUCATION | IELTS BUD WRITING PIE CHARTS
5
sales B fell to 54% in 2010
help people a lot informal help people
enormously / significantly
people can find a lot of numerous/ various / a
great number of… materials on the Internet
Percentage & Fraction
Percentage Fraction
80% four-fifths
75% three-quarters
70% seven in ten
65% two-thirds
6. KLISH EDUCATION | IELTS BUD WRITING PIE CHARTS
6
Percentage Qualifier
77% just over three quarters
77% approximately three quarters
49% just under a half
49% nearly a half
32% almost a third
Age & Age Groups
One person:
He is 10 years old.
He is a 10-year-old.
He is aged 10.
More than one person:
The children in the class are all 10 years old.
It is a class of 10-year-olds (or "10-year-old children").
The children in the class are all aged 10.
Age groups with more than one person:
60% three-fifths
55% more than half
50% half
45%
more than two
fifths
40% two-fifths
35% more than a third
30% less than a third
25% a quarter
20% a fifth
15% less than a fifth
10% one in ten
5% one in twenty
7. KLISH EDUCATION | IELTS BUD WRITING PIE CHARTS
7
The 10-12 age group
The chart shows the preferred hobbies of children (who are) between 10 and 12 years
old (or “10 and 12 years of age”)
The chart shows the preferred hobbies of 10- to 12-year-olds (or "10- to 12-year-old
children").
The chart shows the preferred hobbies of children aged 10 to 12.