Download to read offline
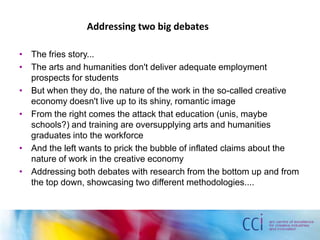

The document discusses the tensions surrounding education in the arts and humanities, particularly regarding employment prospects and the perception of work in the creative economy. It highlights the need for deeper analysis of career outcomes for graduates and argues for the importance of articulating the public benefits of the arts and humanities. The findings suggest that graduates often find relevant employment, though the nature of work is complex and varied within the creative sectors.


