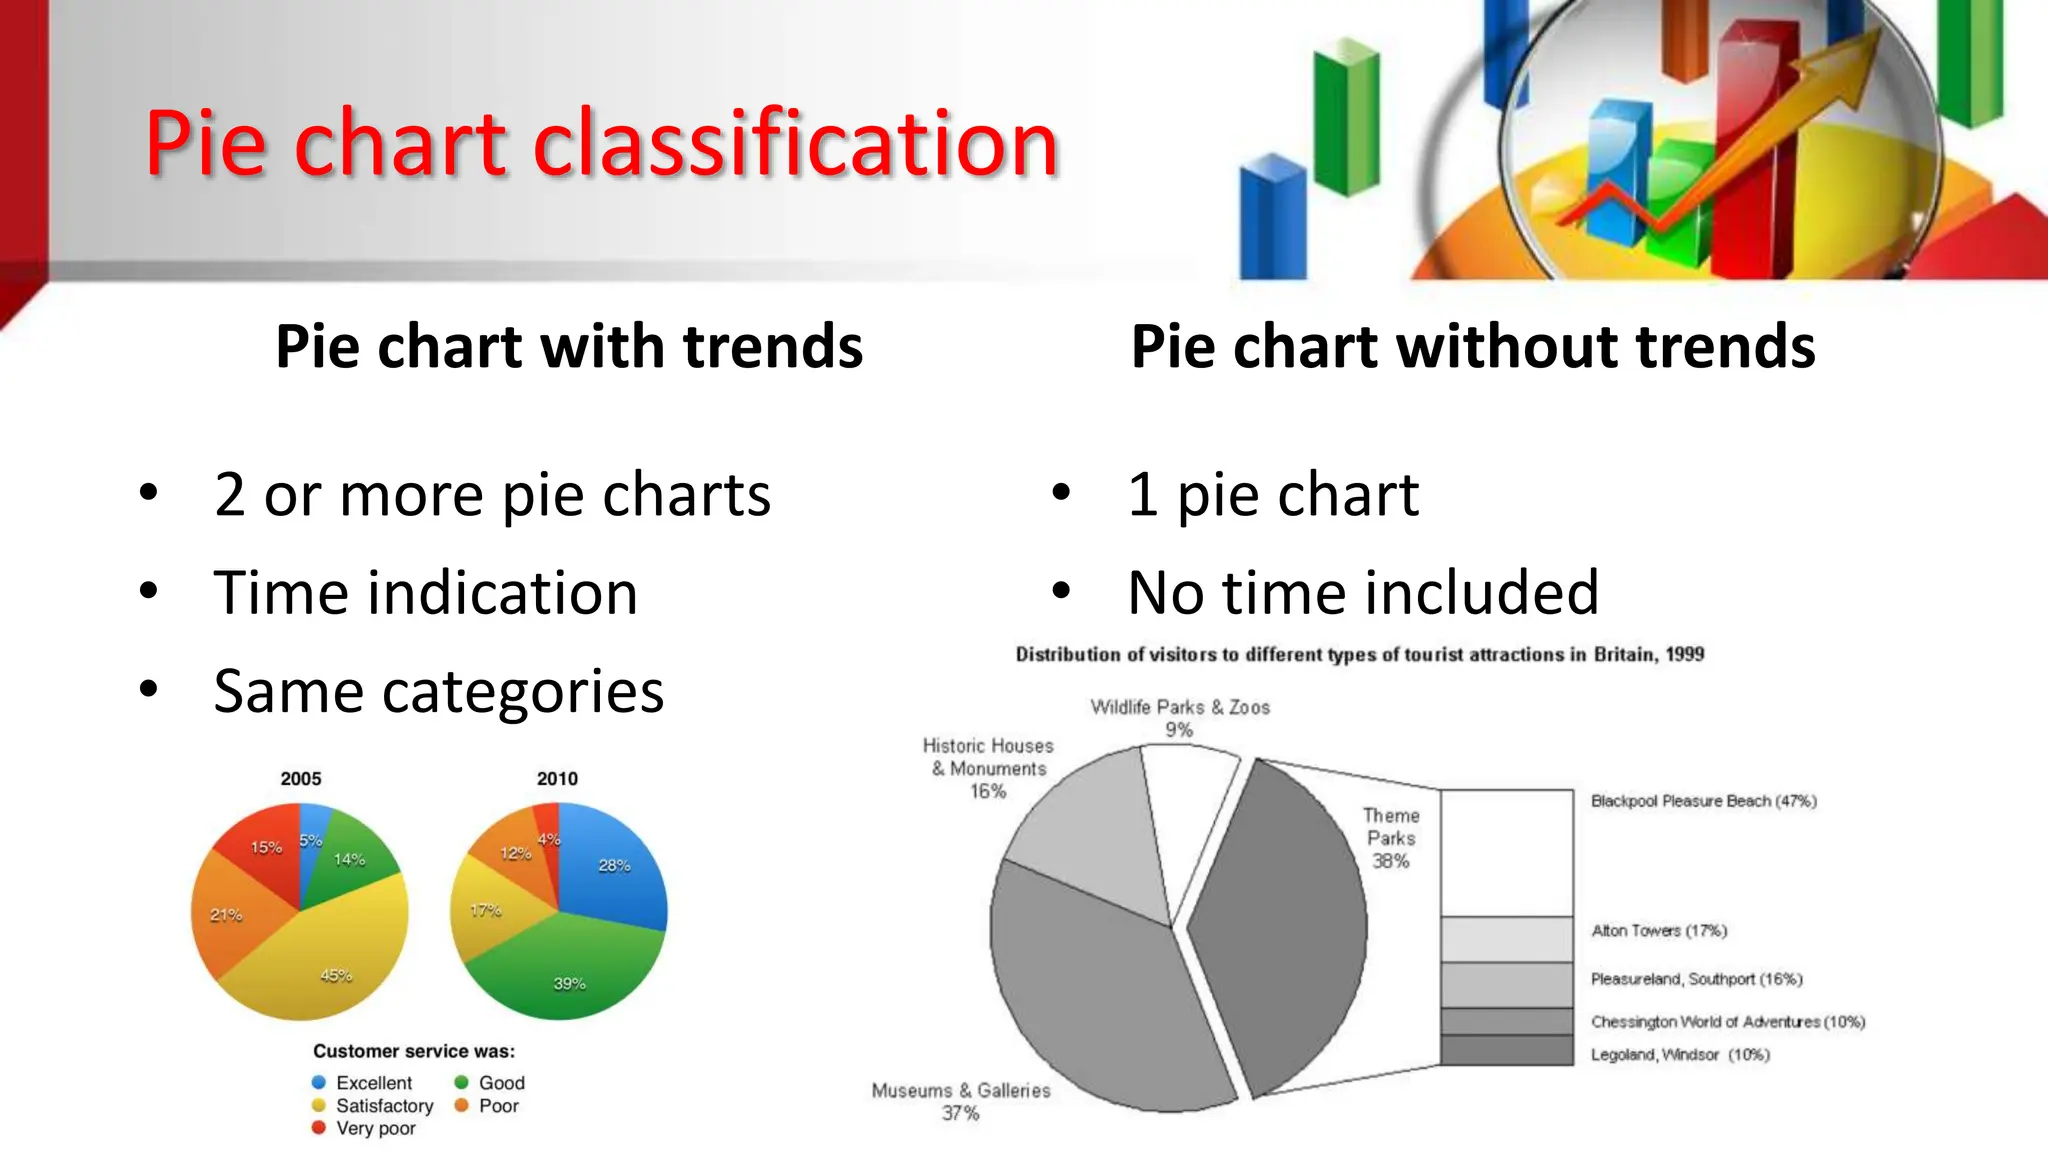
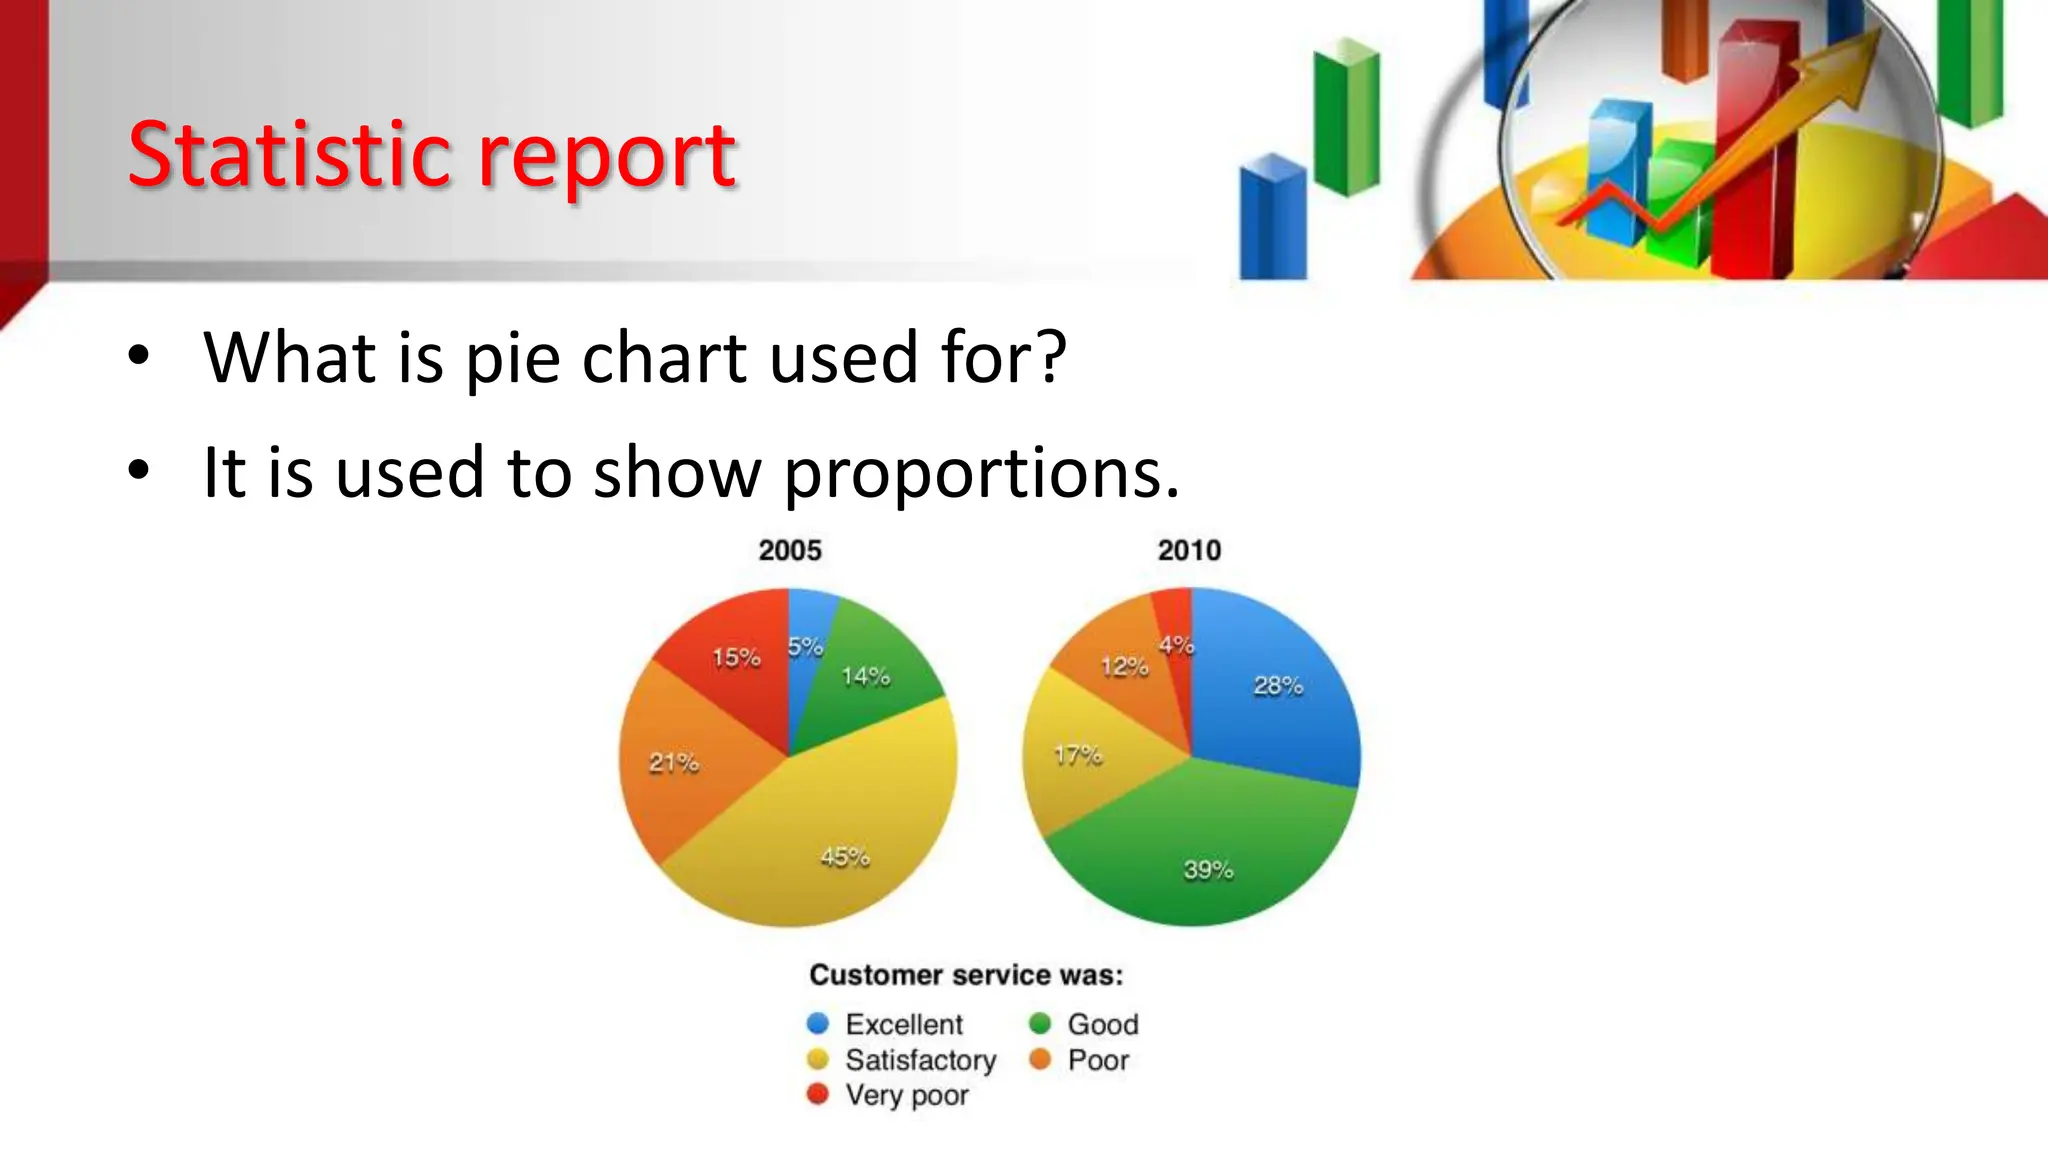
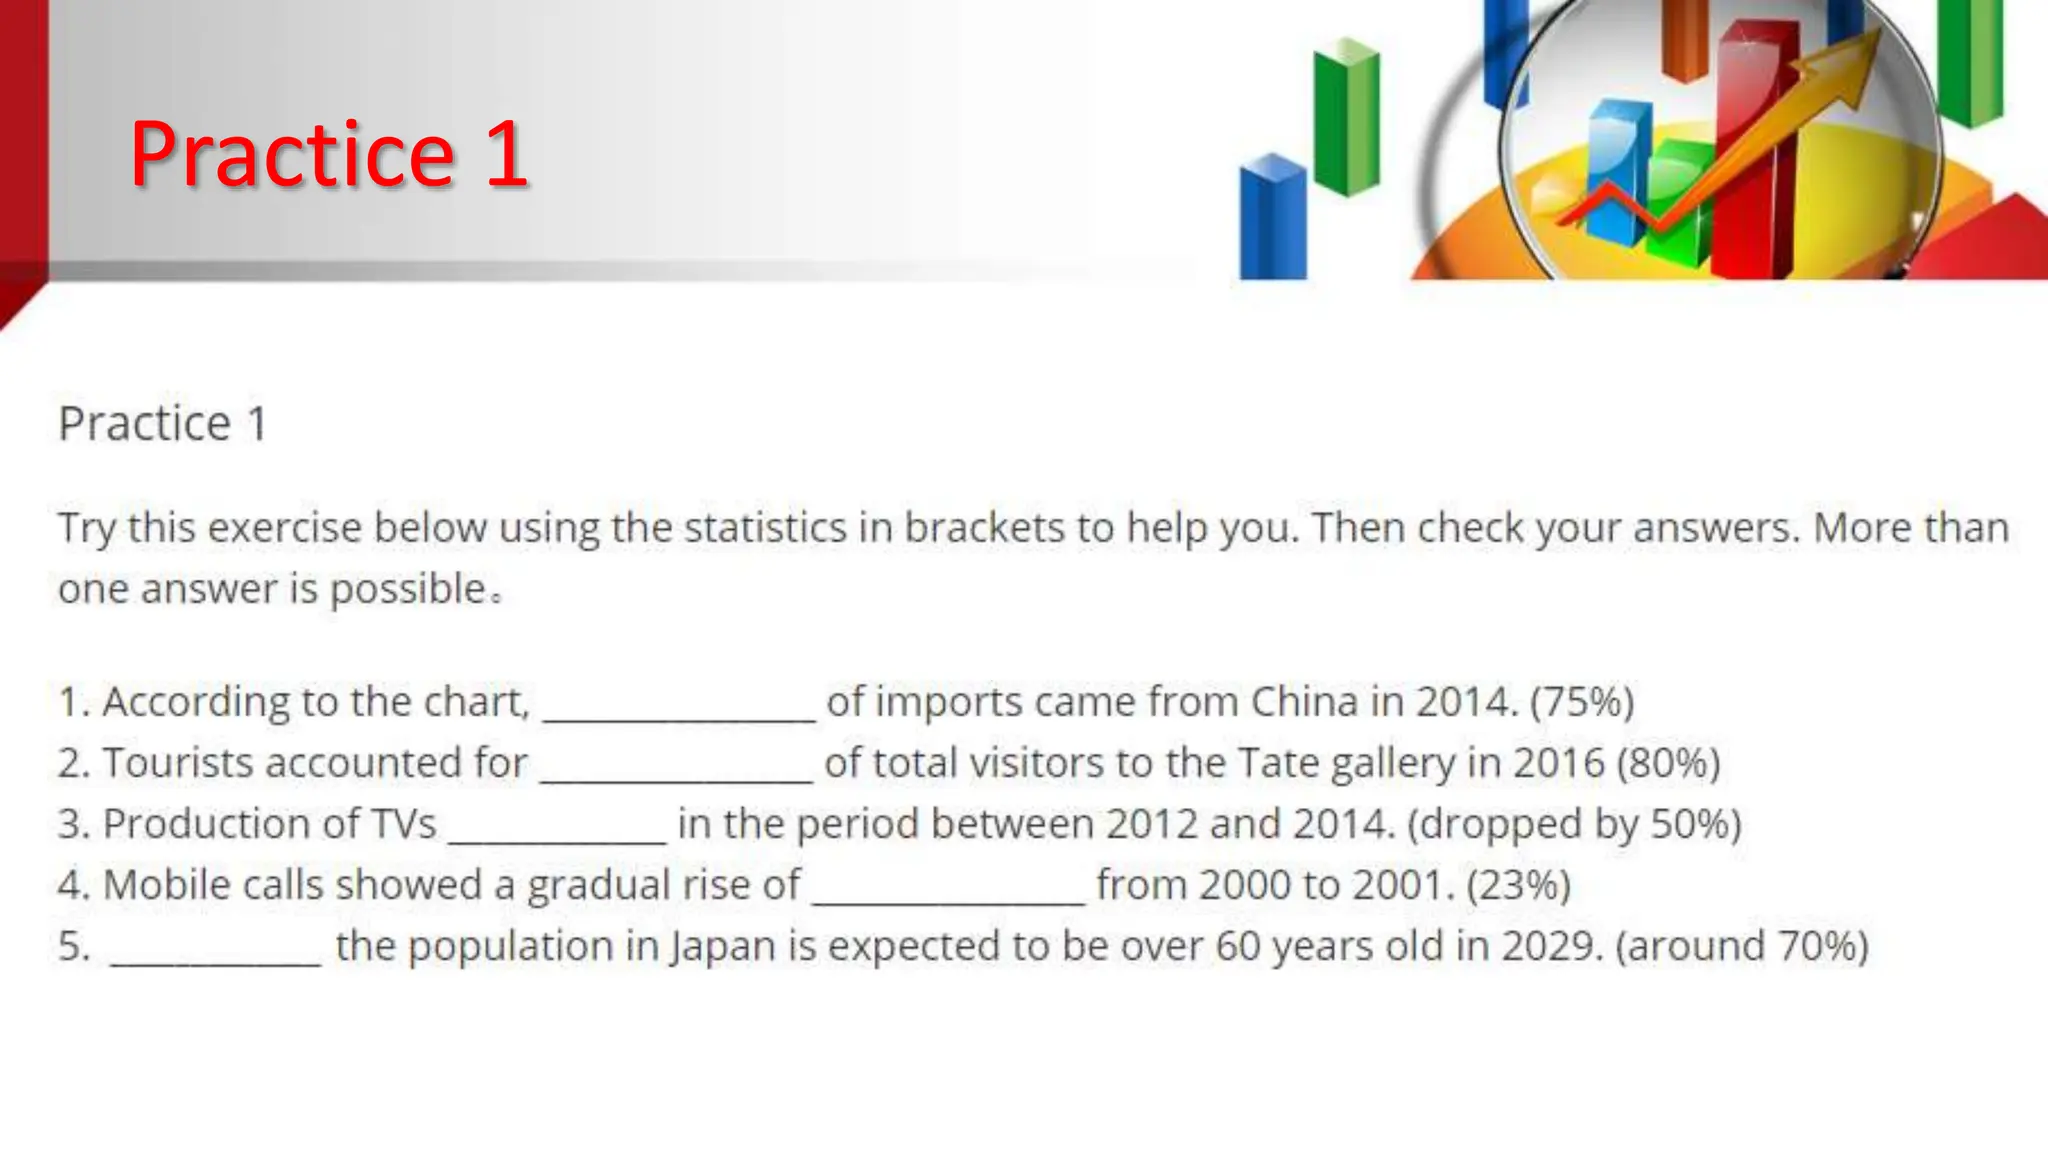
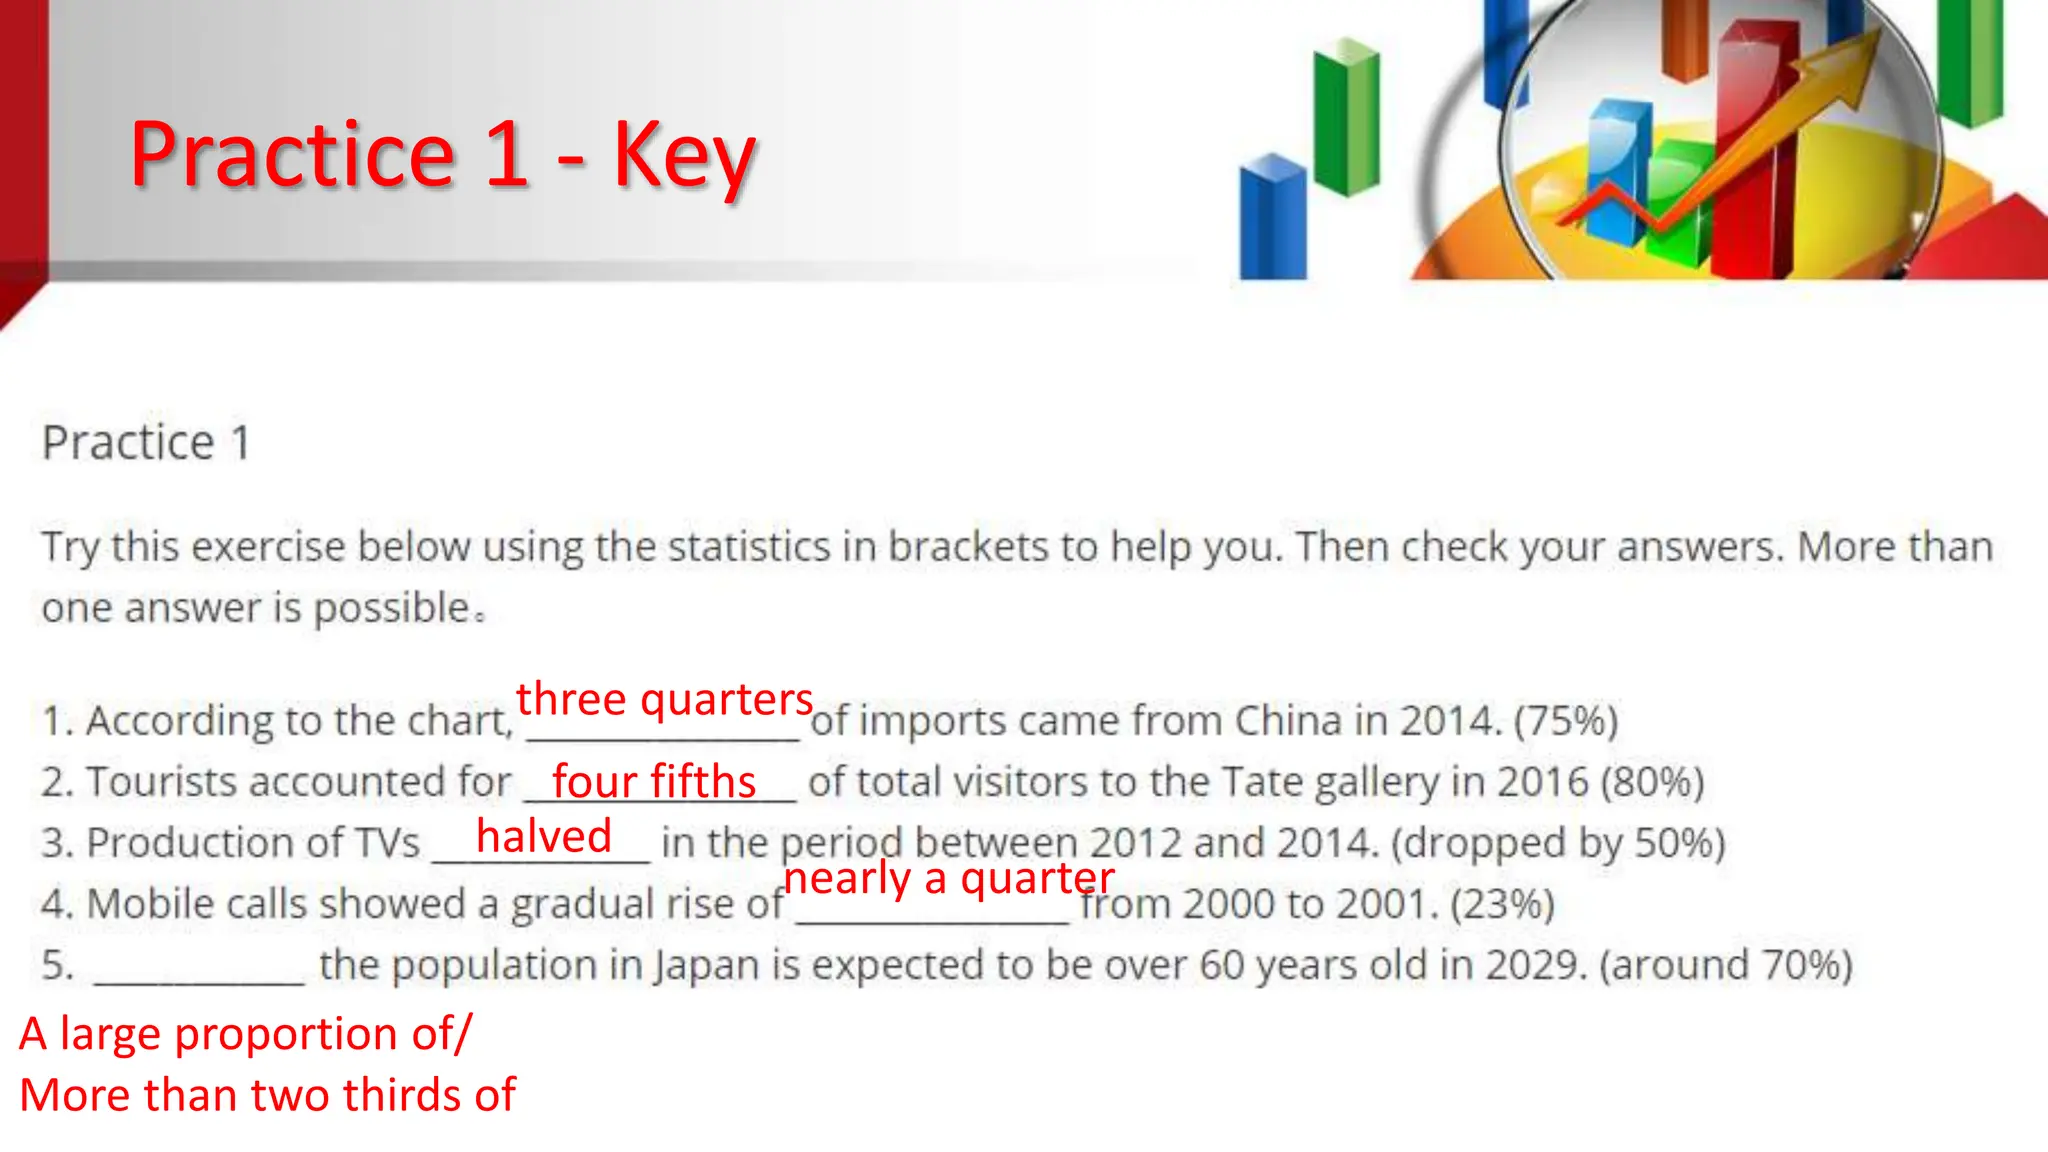
IELTS WRITING TASK 1:
PIE CHART
Lesson procedure
• Pie chart classification
• Statistics report
• Pie chart language
• Practice
Pie chart classification
Pie chart with trends
• 2 or more pie charts
• Time indication
• Same categories
Pie chart without trends
• 1 pie chart
• No time included
Statistic report
• What is pie chart used for?
• It is used to show proportions.
Statistic report
1) One third = 1/3 = 33.33%
33% of students preferred studying
English
Almost ONE THIRD of students
preferred studying English.
2) A quarter = 1/4 = 25%
It can be seen from the graph that
only 25% of women in VN were single.
It can be seen from the graph that
only A QUARTER of women in VN
were single.
3) Two thirds = 2/3 = 66.66 %
64% of women said they went
shopping once a month
Just under TWO THIRDS of women
said they went shopping once a
month
4) Half = 1/2 = 50%
It is clearly seen from the pie chart
that 50% of women in Vietnam
liked shopping
It is clearly seen from the graph
that HALF of women in Vietnam
liked shopping
Statistic report
• One in ten = 10% (used for people or objects)
10% people reported that they went to fast food
restaurants at least once a month.
One in ten people reported that they went to fast food
restaurants at least once a month.
Practice 1
Practice 1 - Key
three quarters
four fifths
halved
nearly a quarter
A large proportion of/
More than two thirds of
Pie chart language
• Percentage = proportion = volume = figure
• The percentages of patients older than 75 years were
61% among women and 21% among men.
• In 1907, the proportions/figures were just 3 per cent
and 9 per cent.
• Retail sales volumes rose by 5.4% in the year to May
in Sweden
Pie chart language
• Modifying numbers: exactly, about, around, almost,
nearly, close to, precisely, more than, approximate,
roughly, under, over, less than.
exactly, precisely about, around,
close to,
approximate,
roughly,
Under, less than,
almost, nearly
Over, more than
Pie chart language
• Account for = make up = take up = consist of =
comprise = include = contribute = constitute +
percentage: chiếm … phần trăm
Practice 2
The two pie charts below show the percentages of industry sectors' contribution to the economy
of Turkey in 2000 and 2016.
Practice 2
• Introduction:
The two pie charts below show the percentages of industry
sectors' contribution to the economy of Turkey in 2000 and
2016.
show → illustrate
the percentages of industry sectors' contribution to the
economy of Turkey → how different industry sectors
contributed to the economy of Turkey, displayed as percentages
in 2000 and 2016 → in the years 2000 and 2016.
Overview
• find the biggest and smallest slices of each pie chart
• find which slices became bigger/smaller or didn't change
Overall, at the beginning of the period construction
contributed the least to the economy of Turkey and
agriculture was the most significant economic sector. In
comparison, at the end of the period healthcare and
education became the largest economic segment and the
lowest contribution was made by financial, business and
other services.
Practice 2
• Do exercise in the handout attached to the email.

Pie chart for IELTS Writing task 1 - New

  • 1.
    IELTS WRITING TASK1: PIE CHART
  • 2.
    Lesson procedure • Piechart classification • Statistics report • Pie chart language • Practice
  • 3.
    Pie chart classification Piechart with trends • 2 or more pie charts • Time indication • Same categories Pie chart without trends • 1 pie chart • No time included
  • 4.
    Statistic report • Whatis pie chart used for? • It is used to show proportions.
  • 5.
    Statistic report 1) Onethird = 1/3 = 33.33% 33% of students preferred studying English Almost ONE THIRD of students preferred studying English. 2) A quarter = 1/4 = 25% It can be seen from the graph that only 25% of women in VN were single. It can be seen from the graph that only A QUARTER of women in VN were single. 3) Two thirds = 2/3 = 66.66 % 64% of women said they went shopping once a month Just under TWO THIRDS of women said they went shopping once a month 4) Half = 1/2 = 50% It is clearly seen from the pie chart that 50% of women in Vietnam liked shopping It is clearly seen from the graph that HALF of women in Vietnam liked shopping
  • 6.
    Statistic report • Onein ten = 10% (used for people or objects) 10% people reported that they went to fast food restaurants at least once a month. One in ten people reported that they went to fast food restaurants at least once a month.
  • 7.
  • 8.
    Practice 1 -Key three quarters four fifths halved nearly a quarter A large proportion of/ More than two thirds of
  • 9.
    Pie chart language •Percentage = proportion = volume = figure • The percentages of patients older than 75 years were 61% among women and 21% among men. • In 1907, the proportions/figures were just 3 per cent and 9 per cent. • Retail sales volumes rose by 5.4% in the year to May in Sweden
  • 10.
    Pie chart language •Modifying numbers: exactly, about, around, almost, nearly, close to, precisely, more than, approximate, roughly, under, over, less than. exactly, precisely about, around, close to, approximate, roughly, Under, less than, almost, nearly Over, more than
  • 11.
    Pie chart language •Account for = make up = take up = consist of = comprise = include = contribute = constitute + percentage: chiếm … phần trăm
  • 12.
    Practice 2 The twopie charts below show the percentages of industry sectors' contribution to the economy of Turkey in 2000 and 2016.
  • 13.
    Practice 2 • Introduction: Thetwo pie charts below show the percentages of industry sectors' contribution to the economy of Turkey in 2000 and 2016. show → illustrate the percentages of industry sectors' contribution to the economy of Turkey → how different industry sectors contributed to the economy of Turkey, displayed as percentages in 2000 and 2016 → in the years 2000 and 2016.
  • 14.
    Overview • find thebiggest and smallest slices of each pie chart • find which slices became bigger/smaller or didn't change Overall, at the beginning of the period construction contributed the least to the economy of Turkey and agriculture was the most significant economic sector. In comparison, at the end of the period healthcare and education became the largest economic segment and the lowest contribution was made by financial, business and other services.
  • 15.
    Practice 2 • Doexercise in the handout attached to the email.