More Related Content
Similar to Daily livestock report nov 26 2012
Similar to Daily livestock report nov 26 2012 (20)
More from joseleorcasita (20)
Daily livestock report nov 26 2012
- 1. Vol. 10, No. 228 November 26, 2012
What about that “worldwide bacon shortage” and ex-
pected massive sow herd liquidation? We all know that the
MPR SOW PURCHASES
#REF! Avg. '06-'10 2011 2012
“shortage” idea was overblown from the beginning but what about the
latter? We doubt that the possibility of a large reduction in the breeding 55000
herd and lower hog supplies in late 2013 is zero yet but the probabilities
are, in our opinion, getting lower with each passing week. 50000
Sow slaughter has certainly slowed since early October, falling
far short of year-ago levels in 3 of the past 4 weeks for which actual 45000
slaughter data are available. The most recent of those, the week of
November 9, saw sow slaughter of 64,190 head, only 0.8% larger than 40000
the same week in 2011. The previous three weeks’ sow slaughters
were 2.2%, 4% and 8.9% lower than last year. 35000
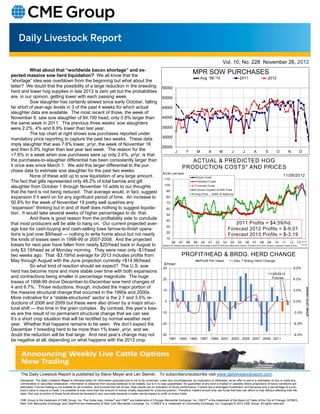
The top chart at right shows sow purchases reported under
30000
mandatory price reporting to capture the past two weeks. These data
imply slaughter that was 7.6% lower, yr/yr, the week of November 16
25000
and then 6.9% higher than last year last week. The reason for the J F M A M J J A S O N D
+7.6% in a week when sow purchases were up only 2.4%, yr/yr, is that
the purchases-to-slaughter differential has been consistently larger than ACTUAL & PREDICTED HOG
it once was since March 1. We add this larger differential to the pur- PRODUCTION COSTS* AND PRICES
chase data to estimate sow slaughter for the past two weeks.
$/cwt carcass
None of these add up to sow liquidation of any large amount. Actual Costs
11/26/2012
110
The fact that gilts represented only 48.2% of total barrow and gilt Predicted Costs
100
slaughter from October 1 through November 10 adds to our thoughts Forecast Costs
90 Futures-Implied IA-MN Price
that the herd is not being reduced. That average would, in fact, suggest Hog Price -- Ia/Mn & National
expansion if it went on for any significant period of time. An increase to 80
50.8% for the week of November 19 pretty well quashes any 70
“expansion” thinking but in and of itself does nothing to suggest liquida- 60
tion. It would take several weeks of higher percentages to do that. 50
And there is good reason from the profitability side to conclude 40
that most producers will be able to hang on. Our current projected aver- 2011 Profits = $4.59/hd.
30
age loss for cash-buying and cash-selling Iowa farrow-to-finish opera- Forecast 2012 Profits = $-9.01
20
tions is just over $9/head — nothing to write home about but not nearly Forecast 2013 Profits = $-3.19
the kinds of losses seen in 1998-99 or 2007-2008. And the projected 10
96 97 98 99 00 01 02 03 04 05 06 07 08 09 10 11 12 13 ‐25.07
losses for next year have fallen from nearly $20/head back in August to *Based on relationsip between ISU Estimated Costs & Returns data and historic Omaha corn and Decatur soybean meal prices ‐$3.20
only $3.19/head as of Monday morning. They were near only -$1/head
two weeks ago. That -$3.19/hd average for 2013 includes profits from PROFIT/HEAD & BRDG. HERD CHANGE
May through August with the June projection currently +$14.96/head. Profit Per Head Dec 1 Brdng Herd Change
$/Head
So what kind of reaction should we expect? The U.S. sow 30 9.0%
herd has become more and more stable over time with both expansions
11/26/2012
and contractions being smaller in percentage magnitude. The huge Futures
20 6.0%
losses of 1998-99 drove December-to-December sow herd changes of
4 and 6.7%. Those reductions, though, included the major portion of e
g
10 3.0% n
the massive structural change that occurred in the 1990s and 2000s. a
h
More indicative for a “stable-structured” sector is the 2.7 and 3.5% re- C
d
0 0.0% r
ductions of 2008 and 2009 but these were also driven by a major struc- e
H
tural shift — this time in the grain complex. By contrast, this year’s loss- g
n
-10 -3.0% d
r
es are the result of no permanent structural change that we can see. B
It’s a short crop situation that will be rectified by normal weather next
year. Whether that happens remains to be seen. We don’t expect the -20 -6.0%
December 1 breeding herd to be more than 1% lower, yr/yr, and we
doubt the reduction will be that large. And next year’s change may not -30 -9.0%
be negative at all, depending on what happens with the 2013 crop. 1991 1993 1995 1997 1999 2001 2003 2005 2007 2009 2011
The Daily Livestock Report is published by Steve Meyer and Len Steiner. To subscribe/unsubscribe visit www.dailylivestockreport.com.
Disclaimer: The Daily Livestock Report is intended solely for information purposes and is not to be construed, under any circumstances, by implication or otherwise, as an offer to sell or a solicitation to buy or trade any
commodities or securities whatsoever. Information is obtained from sources believed to be reliable, but is in no way guaranteed. No guarantee of any kind is implied or possible where projections of future conditions are
attempted. Futures trading is not suitable for all investors, and involves the risk of loss. Past results are no indication of future performance. Futures are a leveraged investment, and because only a percentage of a con-
tract’s value is require to trade, it is possible to lose more than the amount of money initially deposited for a futures position. Therefore, traders should only use funds that they can afford to lose without affecting their life-
style. And only a portion of those funds should be devoted to any one trade because a trader cannot expect to profit on every trade.
CME Group is the trademark of CME Group, Inc. The Globe logo, Globex® and CME® are trademarks of Chicago Mercantile Exchange, Inc. CBOT® is the trademark of the Board of Trade of the City of Chicago. NYMEX,
New York Mercantile Exchange, and ClearPort are trademarks of New York Mercantile Exchange. Inc. COMEX is a trademark of Commodity Exchange, Inc. Copyright © 2012 CME Group. All rights reserved.