More Related Content Similar to Daily livestock report oct 16 2012 Similar to Daily livestock report oct 16 2012 (20) More from joseleorcasita (20) 1. Vol. 10, No. 200 October 16, 2012
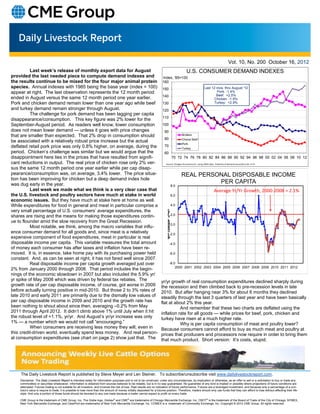
Last week’s release of monthly export data for August U.S. CONSUMER DEMAND INDEXES
provided the last needed piece to compute demand indexes and Index, '85=100
the results continue to be mixed for the four major animal protein 160
species. Annual indexes with 1985 being the base year (index = 100) 150 Last 12 mos. thru August '12
appear at right. The last observation represents the 12 month period Pork: -1.4%
140 Beef: +2.5%
ended in August versus the same 12 month period one year earlier. Chicken: -1.9%
Pork and chicken demand remain lower than one year ago while beef 130 Turkey: +2.9%
and turkey demand remain stronger through August. 120
The challenge for pork demand has been lagging per capita
110
disappearance/consumption. This key figure was 2% lower for the
September-August period. As readers well know, lower consumption 100
does not mean lower demand — unless it goes with price changes 90
that are smaller than expected. That 2% drop in consumption should Broilers
80 Choice Beef
be associated with a relatively robust price increase but the actual
Pork
deflated retail pork price was only 0.8% higher, on average, during the 70
Turkey
period. Chicken’s challenge was similar but we would argue that the 60
disappointment here lies in the prices that have resulted from signifi- 70 72 74 76 78 80 82 84 86 88 90 92 94 96 98 00 02 04 06 08 10 12
cant reductions in output. The real price of chicken rose only 2% ver- Source: Paragon Economics,Inc. using USDA data. Elasticity of demand assumed to be ‐0.75
sus the same 12 month period one year earlier while per cap disap-
pearance/consumption was, on average, 3.4% lower. The price situa- REAL PERSONAL DISPOSABLE INCOME
tion has been improving for chicken but a deep demand index hole
was dug early in the year. PER CAPITA
8.0
Last week we made what we think is a very clear case that Average Yr/Yr Growth, 2000‐2008 = 2.1%
the U.S. livestock and poultry sectors have much at stake in world 6.0
economic issues. But they have much at stake here at home as well.
While expenditures for food in general and meat in particular comprise a 4.0
very small percentage of U.S. consumers’ average expenditures, the r
Y
/
r 2.0
shares are rising and the means for making those expenditures contin- Y
,
ue to flounder amid the slow recovery from the Great Recession. e
g
n 0.0
Most notable, we think, among the macro variables that influ- a
h
ence consumer demand for all goods and, since meat is a relatively C
. -2.0
t
expensive component of food expenditures, meat in particular is real c
P
disposable income per capita. This variable measures the total amount -4.0
of money each consumer has after taxes and inflation have been re-
moved. It is, in essence, take home pay with its purchasing power held -6.0
constant. And, as can be seen at right, it has not fared well since 2007.
Real disposable income per capita growth averaged just over -8.0
2000 2001 2002 2003 2004 2005 2006 2007 2008 2009 2010 2011 2012
2% from January 2000 through 2008. That period includes the begin-
nings of the economic slowdown in 2007 but also included the 5.9% yr/
yr spike of May 2008 which was driven by federal tax rebates. The yr/yr growth of real consumption expenditures declined sharply during
growth rate of per cap disposable income, of course, got worse in 2009 the recession and then climbed back to pre-recession levels in late
before actually turning positive in mid-2010. But those 2 to 3% rates of 2010. But after hanging near 3% for about 6 months they declined
late 2010 and early 2011 are primarily due to the dismally low values of steadily through the last 3 quarters of last year and have been basically
per cap disposable income in 2009 and 2010 and the growth rate has flat at about 2% this year.
been nothing to shout about since then, averaging –0.2% from May And remember that these two charts are deflated using the
2011 through April 2012. It didn’t climb above 1% until July when it hit inflation rate for all goods — while prices for beef, pork, chicken and
the robust level of +1.1%, yr/yr. And August’s yr/yr increase was only turkey have risen at a much higher rate.
1% — a number which we would not call “encouraging.” Why is per capita consumption of meat and poultry lower?
When consumers are receiving less money they will, even in Because consumers cannot afford to buy as much meat and poultry at
this credit-driven world, eventually spend less money. And real person- prices that producers and processors now require in order to bring them
al consumption expenditures (see chart on page 2) show just that. The that much product. Short version: It’s costs, stupid.
The Daily Livestock Report is published by Steve Meyer and Len Steiner. To subscribe/unsubscribe visit www.dailylivestockreport.com.
Disclaimer: The Daily Livestock Report is intended solely for information purposes and is not to be construed, under any circumstances, by implication or otherwise, as an offer to sell or a solicitation to buy or trade any
commodities or securities whatsoever. Information is obtained from sources believed to be reliable, but is in no way guaranteed. No guarantee of any kind is implied or possible where projections of future conditions are
attempted. Futures trading is not suitable for all investors, and involves the risk of loss. Past results are no indication of future performance. Futures are a leveraged investment, and because only a percentage of a con-
tract’s value is require to trade, it is possible to lose more than the amount of money initially deposited for a futures position. Therefore, traders should only use funds that they can afford to lose without affecting their life-
style. And only a portion of those funds should be devoted to any one trade because a trader cannot expect to profit on every trade.
CME Group is the trademark of CME Group, Inc. The Globe logo, Globex® and CME® are trademarks of Chicago Mercantile Exchange, Inc. CBOT® is the trademark of the Board of Trade of the City of Chicago. NYMEX,
New York Mercantile Exchange, and ClearPort are trademarks of New York Mercantile Exchange. Inc. COMEX is a trademark of Commodity Exchange, Inc. Copyright © 2012 CME Group. All rights reserved.
2. Vol. 10, No. 200 October 16, 2012
REAL PERSONAL CONSUMPTION
EXPENDITURES
4.0
3.0
o
g 2.0
A
r
a
e
Y 1.0
.
s
v
e
g 0.0
n
a
h
C
. -1.0
t
c
P
-2.0
-3.0
-4.0
J-06 J-07 J-08 J-09 J-10 J-11 J-12