More Related Content
Similar to Daily livestock report sep 28 2012
Similar to Daily livestock report sep 28 2012 (20)
More from joseleorcasita (20)
Daily livestock report sep 28 2012
- 1. Vol. 10, No. 188 September 28, 2012
While we will get a read on the size of the swine breeding
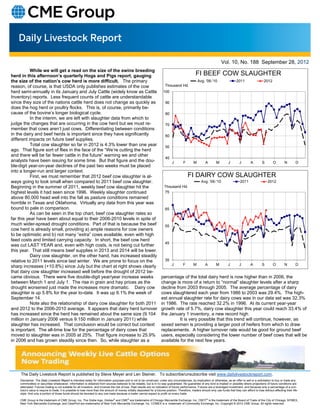
herd in this afternoon’s quarterly Hogs and Pigs report, gauging FI BEEF COW SLAUGHTER
the size of the nation’s cow herd is more difficult. The primary Avg. '06-'10 2011 2012
reason, of course, is that USDA only publishes estimates of the cow Thousand Hd.
herd semi-annually in its January and July Cattle (widely know as Cattle 100
Inventory) reports. Less frequent counts of cattle are understandable
since they size of the nations cattle herd does not change as quickly as 90
does the hog herd or poultry flocks. This is, of course, primarily be-
cause of the bovine’s longer biological cycle. 80
In the interim, we are left with slaughter data from which to
judge the changes that are occurring in the cow herd but we must re- 70
member that cows aren’t just cows. Differentiating between conditions
in the dairy and beef herds is important since they have significantly 60
different impacts on future beef supplies.
Total cow slaughter so far in 2012 is 4.3% lower than one year 50
ago. That figure sort of flies in the face of the “We’re cutting the herd
and there will be far fewer cattle in the future” warning we and other
40
analysts have been issuing for some time. But that figure and the dou- J F M A M J J A S O N D
ble-digit year-on-year declines of the past two weeks must be placed
into a longer-run and larger context.
First, we must remember that 2012 beef cow slaughter is al- FI DAIRY COW SLAUGHTER
ways going to look small when compared to 2011 beef cow slaughter. Avg. '06-'10 2011 2012
Beginning in the summer of 2011, weekly beef cow slaughter hit the Thousand Hd.
highest levels it had seen since 1996. Weekly slaughter continued 75
above 80,000 head well into the fall as pasture conditions remained
horrible in Texas and Oklahoma. Virtually any data from this year was
bound to pale in comparison. 65
As can be seen in the top chart, beef cow slaughter rates so
far this year have been about equal to their 2006-2010 levels in spite of
much wider-spread drought conditions. Part of that is because the beef 55
cow herd is already small, providing a) ample reasons for cow owners y
to be optimistic and b) not many “extra” cows available, even with high
feed costs and limited carrying capacity. In short, the beef cow herd
45
was cut LAST YEAR and, even with high costs, is not being cut further
this year. That still means beef supplies in 2013 and 2014 will be lower.
Dairy cow slaughter, on the other hand, has increased steadily
relative to 2011 levels since last winter. We are prone to focus on the 35
J F M A M J J A S O N D
sharp increases (+10.8%) since July but the chart at right shows clearly
that dairy cow slaughter increased well before the drought of 2012 be-
came obvious. There were five double-digit year/year increase weeks percentage of the total dairy herd is now higher than in 2006, the
between March 1 and July 1. The rise in grain and hay prices as the change is more of a return to “normal” slaughter levels after a sharp
drought worsened just made the increases more dramatic. Dairy cow decline from 2003 through 2005. The average percentage of dairy
slaughter is up 5.8% for the year to-date. It was up 6.1% the week of cows slaughtered each year from 1986 to 2003 was 29.4%. The high-
September 14. est annual slaughter rate for dairy cows was in our data set was 32.3%
Note also the relationship of dairy cow slaughter for both 2011 in 1986. The rate reached 32.2% in 1996. At its current year-year
and 2012 to the 2006-2010 average. It appears that dairy herd turnover growth rate of 5.7%, dairy cow slaughter this year could reach 33.4% of
has increased since the herd has remained about the same size (9.104 the January 1 inventory, a new record high.
million in January 2006 versus 9.150 million in January 2011) while It is very possible that this trend will continue, however, as
slaughter has increased. That conclusion would be correct but context sexed semen is providing a larger pool of heifers from which to draw
is important. The all-time low for the percentage of dairy cows that replacements. A higher turnover rate would be good for ground beef
moved to slaughter was in 2005 at 25%. That figure increase to 25.9% users, especially considering the lower number of beef cows that will be
in 2006 and has grown steadily since then. So, while slaughter as a available for the next few years.
The Daily Livestock Report is published by Steve Meyer and Len Steiner. To subscribe/unsubscribe visit www.dailylivestockreport.com.
Disclaimer: The Daily Livestock Report is intended solely for information purposes and is not to be construed, under any circumstances, by implication or otherwise, as an offer to sell or a solicitation to buy or trade any
commodities or securities whatsoever. Information is obtained from sources believed to be reliable, but is in no way guaranteed. No guarantee of any kind is implied or possible where projections of future conditions are
attempted. Futures trading is not suitable for all investors, and involves the risk of loss. Past results are no indication of future performance. Futures are a leveraged investment, and because only a percentage of a con-
tract’s value is require to trade, it is possible to lose more than the amount of money initially deposited for a futures position. Therefore, traders should only use funds that they can afford to lose without affecting their life-
style. And only a portion of those funds should be devoted to any one trade because a trader cannot expect to profit on every trade.
CME Group is the trademark of CME Group, Inc. The Globe logo, Globex® and CME® are trademarks of Chicago Mercantile Exchange, Inc. CBOT® is the trademark of the Board of Trade of the City of Chicago. NYMEX,
New York Mercantile Exchange, and ClearPort are trademarks of New York Mercantile Exchange. Inc. COMEX is a trademark of Commodity Exchange, Inc. Copyright © 2012 CME Group. All rights reserved.