More Related Content
More from joseleorcasita (20)
Daily livestock report jan 4 2013
- 1. Vol. 11, No. 3 January 4, 2013
Just how far will beef output fall over the next two years?
That question has been pondered considerably on many fronts since COMMERCIAL BEEF PRODUCTION
the drought of 2011 developed in the key cow-calf states of Texas and Quarterly
Oklahoma. And what started as a serious situation in those two key
Bil. Pounds
states has, as most readers know, spread to a far larger portion of the 7.0
U.S. and is now impacting a far larger proportion of the cow herd. Avg.
Based on USDA’s final range and pasture conditions ratings 6.8 2007/11
for 2012 which were released on October 28, states with 40% or more 6.6
of range/pasture lands rated as in poor or very poor condition account- 2012
6.4
ed for 70.5% of the nation’s beef cows. That figure was 46.1% on Octo-
ber 30, 2011. Only 21.6% of the nation’s cow herd cow herd resided in 6.2
2013
states with 40% or more of their range/pasture lands rated in good or
6.0
excellent condition. That compares to 36.7% one year ago.
And the impact has not been felt just in the cow herd. The 5.8 2014
disruption that has occurred in the timing of feedlot placements over the 5.6
past couple of years is going to come home to roost (please excuse the JAN-MAR APR-JUN JUL-SEP OCT-DEC
chicken analogy) over the next few months. We commented after last
month’s Cattle on Feed report about the relatively large number of light-
weight placements being driven by poor wheat pasture conditions. The U.S. MEAT/POULTRY PRODUCTION,
same will likely be true for December and then look out — there does ANNUAL
not appear to be many feeder cattle behind those since a high propor-
Beef Pork Broilers Turkey
tion of those light calves have already moved to feedyards.
40000
All of this has been discussed — likely ad nauseum — over
the past two years but we think it bears reviewing relative to likely beef 35000
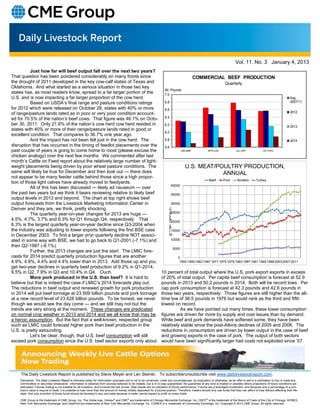
output levels in 2013 and beyond. The chart at top right shows beef
output forecasts from the Livestock Marketing Information Center in 30000
Denver and they are, we think, pretty shocking. C
T
The quarterly year-on-year changes for 2013 are huge — / 25000
R
c
r
4.5%, 4.7%, 3.7% and 6.3% for Q1 through Q4, respectively. That a
C
6.3% is the largest quarterly year-on-year decline since Q3-2004 when , 20000
.
s
b
l
the industry was adjusting to lower exports following the first BSE case . 15000
l
i
in December 2003. To find a larger yr/yr quarterly decline NOT associ- M
ated in some way with BSE, we had to go back to Q1-2001 (-7.1%) and 10000
then Q2-1987 (-8.1%).
5000
Further, the 2013 changes are just the start. The LMIC fore-
casts for 2014 predict quarterly production figures that are another 0
4.9%, 4.8%, 4.4% and 4.4% lower than in 2013. Add those up and you 1955 1959 1963 1967 1971 1975 1979 1983 1987 1991 1995 1999 2003 2007 2011
get two-year declines in quarterly beef production of 9.2% in Q1-2014,
9.5% in Q2, 7.9% in Q3 and 10.4% in Q4. Ouch. 10 percent of total output where the U.S. pork export exports in excess
More pork produced in the U.S. than beef? It is hard to of 20% of total output. Per capita beef consumption is forecast at 52.9
believe but that is indeed the case if LMIC’s 2014 forecasts play out. pounds in 2013 and 50.2 pounds in 2014. Both will be record lows. Per
The reductions in beef output and renewed growth for pork production cap pork consumption is forecast at 42.3 pounds and 42.6 pounds in
in 2014 will put beef tonnage at 23.509 billion pounds and pork tonnage those two years, respectively. Those figures are still higher than the all-
at a new record level of 23.628 billion pounds. To be honest, we never time low of 38.5 pounds in 1976 but would rank as the third and fifth
though we would see the day come — and we still may not but the lowest on record.
trends are very strong at the moment. These changes are predicated As we have pointed out many times, these lower consumption
on normal crop weather in 2013 and 2014 and we all know that may be figures are driven far more by supply and cost issues than by demand.
a heroic assumption. But the fact that a well-known, respected group While beef and pork demands have softened some, they have been
such as LMIC could forecast higher pork than beef production in the relatively stable since the post-Atkins declines of 2005 and 2006. The
U.S. is pretty astounding. reductions in consumption are driven by lower output in the case of beef
Let’s be clear, though, that U.S. beef consumption will still and growing exports in the case of pork. The output of both sectors
exceed pork consumption since the U.S. beef sector exports only about would have been significantly larger had costs not exploded since ‘07.
The Daily Livestock Report is published by Steve Meyer and Len Steiner. To subscribe/unsubscribe visit www.dailylivestockreport.com.
Disclaimer: The Daily Livestock Report is intended solely for information purposes and is not to be construed, under any circumstances, by implication or otherwise, as an offer to sell or a solicitation to buy or trade any
commodities or securities whatsoever. Information is obtained from sources believed to be reliable, but is in no way guaranteed. No guarantee of any kind is implied or possible where projections of future conditions are
attempted. Futures trading is not suitable for all investors, and involves the risk of loss. Past results are no indication of future performance. Futures are a leveraged investment, and because only a percentage of a con-
tract’s value is require to trade, it is possible to lose more than the amount of money initially deposited for a futures position. Therefore, traders should only use funds that they can afford to lose without affecting their life-
style. And only a portion of those funds should be devoted to any one trade because a trader cannot expect to profit on every trade.
CME Group is the trademark of CME Group, Inc. The Globe logo, Globex® and CME® are trademarks of Chicago Mercantile Exchange, Inc. CBOT® is the trademark of the Board of Trade of the City of Chicago. NYMEX,
New York Mercantile Exchange, and ClearPort are trademarks of New York Mercantile Exchange. Inc. COMEX is a trademark of Commodity Exchange, Inc. Copyright © 2013 CME Group. All rights reserved.