More Related Content
Similar to Daily livestock report aug 6 2012
Similar to Daily livestock report aug 6 2012 (20)
More from joseleorcasita (20)
Daily livestock report aug 6 2012
- 1. Vol. 10, No. 151 August 6, 2012
We can only hope that markets — and news reporters — TOTAL SOW PURCHASES, MPR DATA
look at the facts of the new swine flu strain that grabbed some
headlines over the weekend. The Centers for Disease Control Thous. Head
announced on Friday that they have now identified 29 cases of H3N2v 60
influenza in humans since July 2011. That total includes 12 new cas- Avg. '06-'010
es, 10 of which were found in Ohio. All of the 12 new cases were re- 55
2011
ported in people who had been in direct contact with pigs with the Ohio 50 2012
cases being associated with a fair.
The CDC reports that this strain has a gene from the H1N1 45
virus that caused all the undeserved problems for pork back in 2009.
But so far there is no evidence that the H3N2v virus is spread from 40
human to human. Normal flu symptoms of fever, cough, runny nose,
sore throat, muscle aches are reported. There have been three hospi- 35
talizations and all three of those people had high-risk characteristics.
30
All reported victims have recovered fully.
One point in the CDC information is critical: Influenza viruses 25
have not been shown to be transmissible to people through eating
properly handled and prepared pork. Visitors to fairs or those working 20
around pigs were warned to take normal flue prevention steps: watch J F M A M J J A S O N D
animals for signs of illness, wash hands frequently, don’t eat or drink in
animal areas. FI SOW SLAUGHTER, U.S.
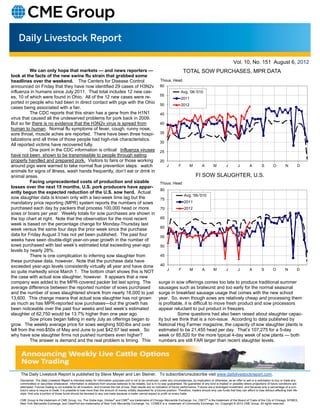
Facing unprecedented costs of production and sizable Thous. Head
losses over the next 15 months, U.S. pork producers have appar-
80
ently begun the expected reduction of the U.S. sow herd. Actual
Avg. '06-'010
sow slaughter data is known only with a two-week time lag but the 75
mandatory price reporting (MPR) system reports the numbers of sows 2011
purchased each day by packers that process 100,000 head or more 70 2012
sows or boars per year. Weekly totals for sow purchases are shown in
the top chart at right. Note that the observation for the most recent 65
week is based on the percentage change for Monday-Thursday last
60
week versus the same four days the prior week since the purchase
data for Friday August 3 has not yet been published. The past four 55
weeks have seen double-digit year-on-year growth in the number of
sows purchased with last week’s estimated total exceeding year-ago 50
levels by nearly 28%.
There is one complication to inferring sow slaughter from 45
these purchase data, however. Note that the purchase data have
exceeded year-ago levels consistently virtually all year and have done 40
J F M A M J J A S O N D
so quite markedly since March 1. The bottom chart shows this is NOT
the case with actual sow slaughter, however. It appears that a new
company was added to the MPR-covered packer list last spring. The surge in sow offerings comes too late to produce traditional summer
average difference between the reported number of sows purchased sausages such as bratwurst and too early for the normal seasonal
and the number of sows slaughtered shrank from nearly 18,000 to just surge in breakfast sausage usage that comes with the new school
13,600. This change means that actual sow slaughter has not grown year. So, even though sows are relatively cheap and processing them
as much as has MPR-reported sow purchases—but the growth has is profitable, it is difficult to move fresh product and sow processors
been noticeable over the past four weeks and last week’s estimated appear reluctant to put product in freezers.
slaughter of 62,750 would be 13.7% higher than one year ago. Some questions had also been raised about slaughter capac-
Sow prices began falling in early July as offerings began to ity but we think that is a non-issue. According to data published by
grow. The weekly average price for sows weighing 500-lbs and over National Hog Farmer magazine, the capacity of sow slaughter plants is
fell from the mid-$50s of May and June to just $42.67 last week. So estimated to be 21,455 head per day. That’s 107,275 for a 5-day
why have sow slaughter firms not pushed numbers even higher? week or 85,820 for the more typical 4-day week of sow plants — both
The answer is demand and the real problem is timing. This numbers are still FAR larger than recent slaughter levels.
The Daily Livestock Report is published by Steve Meyer and Len Steiner. To subscribe/unsubscribe visit www.dailylivestockreport.com.
Disclaimer: The Daily Livestock Report is intended solely for information purposes and is not to be construed, under any circumstances, by implication or otherwise, as an offer to sell or a solicitation to buy or trade any
commodities or securities whatsoever. Information is obtained from sources believed to be reliable, but is in no way guaranteed. No guarantee of any kind is implied or possible where projections of future conditions are
attempted. Futures trading is not suitable for all investors, and involves the risk of loss. Past results are no indication of future performance. Futures are a leveraged investment, and because only a percentage of a con-
tract’s value is require to trade, it is possible to lose more than the amount of money initially deposited for a futures position. Therefore, traders should only use funds that they can afford to lose without affecting their life-
style. And only a portion of those funds should be devoted to any one trade because a trader cannot expect to profit on every trade.
CME Group is the trademark of CME Group, Inc. The Globe logo, Globex® and CME® are trademarks of Chicago Mercantile Exchange, Inc. CBOT® is the trademark of the Board of Trade of the City of Chicago. NYMEX,
New York Mercantile Exchange, and ClearPort are trademarks of New York Mercantile Exchange. Inc. COMEX is a trademark of Commodity Exchange, Inc. Copyright © 2012 CME Group. All rights reserved.
- 2. Vol. 10, No. 151 August 6, 2012
PRODUCTION AND PRICE SUMMARY Week Ending 8/4/2012
Current Pct. Pct. Pct.
Item Units Week Last Week Change Last Year Change YTD Change
Total Meat & Poultry Prod. Million lbs. 1680.5 1694.1 -0.80% 1679.9 0.04% 51,188 -1.65%
C FI Slaughter Thou. Head 647 637 1.57% 660 -1.93% 19,235 -4.18%
A FI Cow Slaughter Thou. Head 132.4 124.8 6.02% 127.7 3.64% 3,445 -3.18%
T Avg. Live Weight Lbs. 1300 1297 0.23% 1271 2.28% 1,296 1.70%
T Avg. Dressed Weight Lbs. 792 793 -0.13% 774 2.33% 786 1.98%
L Beef Production Million Lbs. 511.4 504.4 1.39% 509.3 0.41% 15,084 -2.16%
E Live Fed Steer $/cwt live wt. 117.58 114.16 3.00% 112.35 4.66%
Dressed Steer $/cwt carcass 184.94 180.16 2.65% 178.36 3.69%
& OKC Feeder Steer 600-700 Lbs. 140.88 139.20 1.21% 140.35 0.38%
Beef Cutout 600-750 Choice 177.88 178.06 -0.10% 173.40 2.58%
B Hide/Offal $/cwt live wt. 13.26 13.32 -0.45% 13.75 -3.56%
E Rib Choice 261.70 263.64 -0.74% 242.78 7.79%
E Round Choice 158.92 158.05 0.55% 151.92 4.61%
F Chuck Choice 142.86 139.94 2.09% 139.95 2.08%
Trimmings, 50% Fresh 44.05 45.85 -3.93% 80.17 -45.05%
Trimmings, 90% Fresh 206.90 208.75 -0.89% 179.86 15.03%
H FI Slaughter Thou. Head 2025 2003 1.10% 1969 2.86% 64,040 1.28%
O FI Sow Slaughter Thou. Head 56.5 57.7 -2.07% 54.6 3.46% 1,608 -1.94%
G Avg. Dressed Weight Lbs. 202 203 -0.49% 198 2.02% 207 0.42%
S Pork Production Million Lbs. 408.4 405.3 0.76% 390.2 4.66% 13,258 1.75%
Iowa-S. Minn. Direct Avg. 92.92 94.40 -1.60% 104.48 -11.10%
& Natl. Base Carcass Price Weighted Avg. 92.62 93.11 -0.50% 98.99 -6.40%
Natl. Net Carcass Price Weighted Avg. 95.03 95.60 -0.60% 102.29 -7.10%
P Pork Cutout 185 Lbs. 92.76 92.27 0.50% 107.38 -13.60%
O Hams Primal Cutout 77.57 74.46 4.20% 87.61 -11.50%
R Loins Primal Cutout 99.70 104.00 -4.10% 127.14 -21.60%
K Bellies Primal Cutout 148.79 139.54 6.60% 151.88 -2.00%
C Young Chicken Slaughter* Million Head 157.18 158.65 -0.93% 159.05 -1.17% 4,561 -4.73%
H Avg. Weight Lbs., RTC 4.17 4.22 -1.23% 4.26 -2.10% 4.3 -0.23%
I Broiler Production Million Lbs., RTC 655.8 670.2 -2.15% 677.8 -3.25% 19,632 -3.95%
C Eggs Set Million 196.6 195.2 0.73% 194.4 1.12% 5,911 -3.60%
K Chicks Placed Million Head 161.1 163.1 -1.20% 162.9 -1.08% 4,924 -3.11%
E 12-City Broiler Composite 79.87 81.89 -2.50% 79.98 -0.10%
N Georgia Dock Broiler 2.5-3 Lbs. 93.81 93.88 -0.10% 86.12 8.90%
Northeast Breast Skinlss/Bonelss 136.2 139.11 -2.10% 123.42 10.40%
Northeast Legs 64.29 63.5 1.20% 62.11 3.50%
T Young Turkey Slaughter* Million Head 4.42 4.74 -6.69% 4.35 1.68% 131.1 -0.39%
U Avg. Weight Lbs. 23.76 24.12 -1.49% 23.62 0.58% 24.5 1.98%
R Turkey Production Million Lbs. 105.0 114.2 -8.09% 102.6 2.27% 3,214 1.77%
K Eastern Region Hen 8-16 Lbs. 108.12 107.50 0.60% 102.15 5.80%
F Corn, Omaha $ per Bushel 7.99 7.78 2.70% 7.14 11.83%
E DDGS, Minnesota $ per ton 302.50 287.50 5.22% 182.50 65.75%
E Wheat, Kansas City $ per Bushel 8.69 8.78 -1.03% 7.50 15.87%
D Soybeans, S. Iowa $ per Bushel 17.02 17.01 0.06% 13.57 25.40%
SB Meal, 48% Central Illinois $ per Ton 554.70 553.30 0.25% 340.60 62.90%
* Chicken & turkey slaughter, production and prices are 1 week earlier than the date at the top of this table. Cow & sow slaughter are for 2 weeks earlier
The Daily Livestock Report is published by Steve Meyer and Len Steiner. To subscribe/unsubscribe visit www.dailylivestockreport.com.
Disclaimer: The Daily Livestock Report is intended solely for information purposes and is not to be construed, under any circumstances, by implication or otherwise, as an offer to sell or a solicitation to buy or trade any
commodities or securities whatsoever. Information is obtained from sources believed to be reliable, but is in no way guaranteed. No guarantee of any kind is implied or possible where projections of future conditions are
attempted. Futures trading is not suitable for all investors, and involves the risk of loss. Past results are no indication of future performance. Futures are a leveraged investment, and because only a percentage of a con-
tract’s value is require to trade, it is possible to lose more than the amount of money initially deposited for a futures position. Therefore, traders should only use funds that they can afford to lose without affecting their life-
style. And only a portion of those funds should be devoted to any one trade because a trader cannot expect to profit on every trade.
CME Group is the trademark of CME Group, Inc. The Globe logo, Globex® and CME® are trademarks of Chicago Mercantile Exchange, Inc. CBOT® is the trademark of the Board of Trade of the City of Chicago. NYMEX,
New York Mercantile Exchange, and ClearPort are trademarks of New York Mercantile Exchange. Inc. COMEX is a trademark of Commodity Exchange, Inc. Copyright © 2012 CME Group. All rights reserved.