More Related Content
Similar to Monthly US cattle slaughter, imports and inventory
Similar to Monthly US cattle slaughter, imports and inventory (20)
More from joseleorcasita (20)
Monthly US cattle slaughter, imports and inventory
- 1. Sponsored by
Vol. 11, No. 27 / February 7, 2013
Here’s a reminder that you do not have to use a credit MONTHLY U.S. STR/HFR SLAUGHTER BY
card to make a contribution to The Daily Livestock Report. If you SOURCE, U.S. INVENTORY & CALF CROP
prefer to pay by check, just send one payable to The Daily Livestock Canada Feeders Canada Fed Cattle
Report to: Mexico Feeders U.S. Calves
Slaughter -- Inventory & Calf
The Daily Livestock Report Thousand Hd. Crop, Mil. Hd.
P.O. Box 2 1800 120
Adel, IA 50003
Be sure to include your e-mail address either in the memo line of your 1500 100
check or on a note. We need that to make sure that your payment is
recorded on your account — especially if you make a contribution of 1200 80
$149 or more and are thus eligible for the Seasonal Trader Reports.
900 60
The first Seasonal Trader Report will be available at The
Daily Livestock Report website tomorrow! “Supporters” who have
600 40
contributed $149 or more will be able to simply log in to their account,
click on Quarterly Report and download the Adobe .pdf file.
300 20
One factor that should have been included in our discus-
sion of U.S. sheep numbers (we actually thought of it but forgot 0 0
to include it — a “senior” moment, we fear) was predator control 90 91 92 93 94 95 96 97 98 99 00 01 02 03 04 05 06 07 08 09 10 11 12
regulation changes. The predator poison “1080” was banned in 1972.
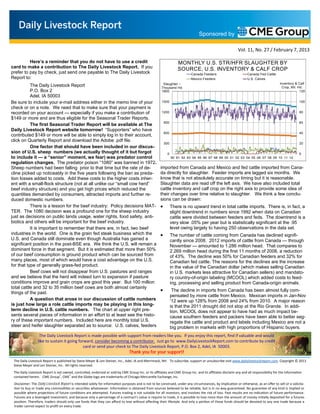
Sheep numbers had been falling prior to that time but the rate of de- imported from Canada and Mexico and fed cattle imported from Cana-
cline picked up noticeably in the five years following the ban as preda- da directly for slaughter. Feeder imports are lagged six months. We
tion losses added to costs. Add these costs to the higher costs inher- know that is not absolutely accurate on timing but it is reasonable.
ent with a small-flock structure (not at all unlike our “small cow herd” Slaughter data are read off the left axis. We have also included total
beef industry structure) and you get high prices which reduced the cattle inventory and calf crop on the right axis to provide some idea of
quantities demanded by consumers, attracted imports and further re- their changes over time relative to slaughter. We think a few conclu-
duced domestic numbers. sions can be drawn:
There is a lesson for the beef industry: Policy decisions MAT- • There is no upward trend in total cattle imports. There is, in fact, a
TER. The 1080 decision was a profound one for the sheep industry slight downtrend in numbers since 1992 when data on Canadian
just as decisions on public lands usage, water rights, food safety, anti- cattle were divided between feeders and feds. The downtrend is a
biotics and others will be important for the beef industry. very slow .05% per year but is statistically significant at the .95
It is important to remember that there are, in fact, two beef level owing largely to having 250 observations in the data set.
industries in the world. One is the grain fed steak business which the • The number of cattle coming from Canada has declined signifi-
U.S. and Canada still dominate even though Australia has gained a cantly since 2008. 2012 imports of cattle from Canada — through
significant position in the post-BSE era. We think the U.S. will remain a November — amounted to 1.286 million head. That compares to
dominant force in that segment. But it is estimated that more than 50% 2.269 million head during the first 11 months of 2008, a reduction
of our beef consumption is ground product which can be sourced from of 43%. The decline was 50% for Canadian feeders and 32% for
many places, most of which would have a cost advantage on the U.S. Canadian fed cattle. The reasons for the declines are the increase
for that type of generally grass-fed product. in the value of the Canadian dollar (which makes selling Canadian
Beef cows will not disappear from U.S. pastures and ranges in U.S. markets less attractive for Canadian sellers) and mandato-
and we believe that the herd will indeed turn to expansion if pasture ry country-of-origin labeling (MCOOL) which added costs to feed-
conditions improve and grain crops are good this year. But 100 million ing, processing and selling product from Canada-origin animals.
total cattle and 32 to 35 million beef cows are both almost certainly
things of the past.
• The decline in imports from Canada has been almost fully com-
pensated by more cattle from Mexico. Mexican imports in Jan-Nov
A question that arose in our discussion of cattle numbers ‘12 were up 128% from 2008 and 24% from 2010. A major reason
is just how large a role cattle imports may be playing in this long- is that the 2011 drought did not stop at the Rio Grande. In addi-
term decline in U.S. cattle numbers. The chart at upper right pre- tion, MCOOL does not appear to have had as much impact be-
sents several pieces of information in an effort to at least see the histo- cause southern feeders and packers have been able to better seg-
ry of these important numbers. Included here are monthly total U.S. regate the cattle and product and labels including Mexico are not a
steer and heifer slaughter separated as to source: U.S. calves, feeders big problem in markets with high proportions of Hispanic buyers.
The Daily Livestock Report is made possible with support from readers like you. If you enjoy this report, find if valuable and would
like to sustain it going forward, consider becoming a contributor. Just go to www.DailyLivestockReport.com to contribute by credit
card or send your check to The Daily Livestock Report, P.O. Box 2, Adel, IA 50003.
Thank you for your support!
The Daily Livestock Report is published by Steve Meyer & Len Steiner, Inc., Adel, IA and Merrimack, NH. To subscribe, support or unsubscribe visit www.dailylivestockreport.com. Copyright © 2013
Steve Meyer and Len Steiner, Inc. All rights reserved.
The Daily Livestock Report is not owned, controlled, endorsed or sold by CME Group Inc. or its affiliates and CME Group Inc. and its affiliates disclaim any and all responsibility for the informa on
contained herein. CME Group®, CME® and the Globe logo are trademarks of Chicago Mercan le Exchange, Inc.
Disclaimer: The Daily Livestock Report is intended solely for informa on purposes and is not to be construed, under any circumstances, by implica on or otherwise, as an offer to sell or a solicita-
on to buy or trade any commodi es or securi es whatsoever. Informa on is obtained from sources believed to be reliable, but is in no way guaranteed. No guarantee of any kind is implied or
possible where projec ons of future condi ons are a empted. Futures trading is not suitable for all investors, and involves the risk of loss. Past results are no indica on of future performance.
Futures are a leveraged investment, and because only a percentage of a contract’s value is require to trade, it is possible to lose more than the amount of money ini ally deposited for a futures
posi on. Therefore, traders should only use funds that they can afford to lose without affec ng their lifestyle. And only a por on of those funds should be devoted to any one trade because a
trader cannot expect to profit on every trade.