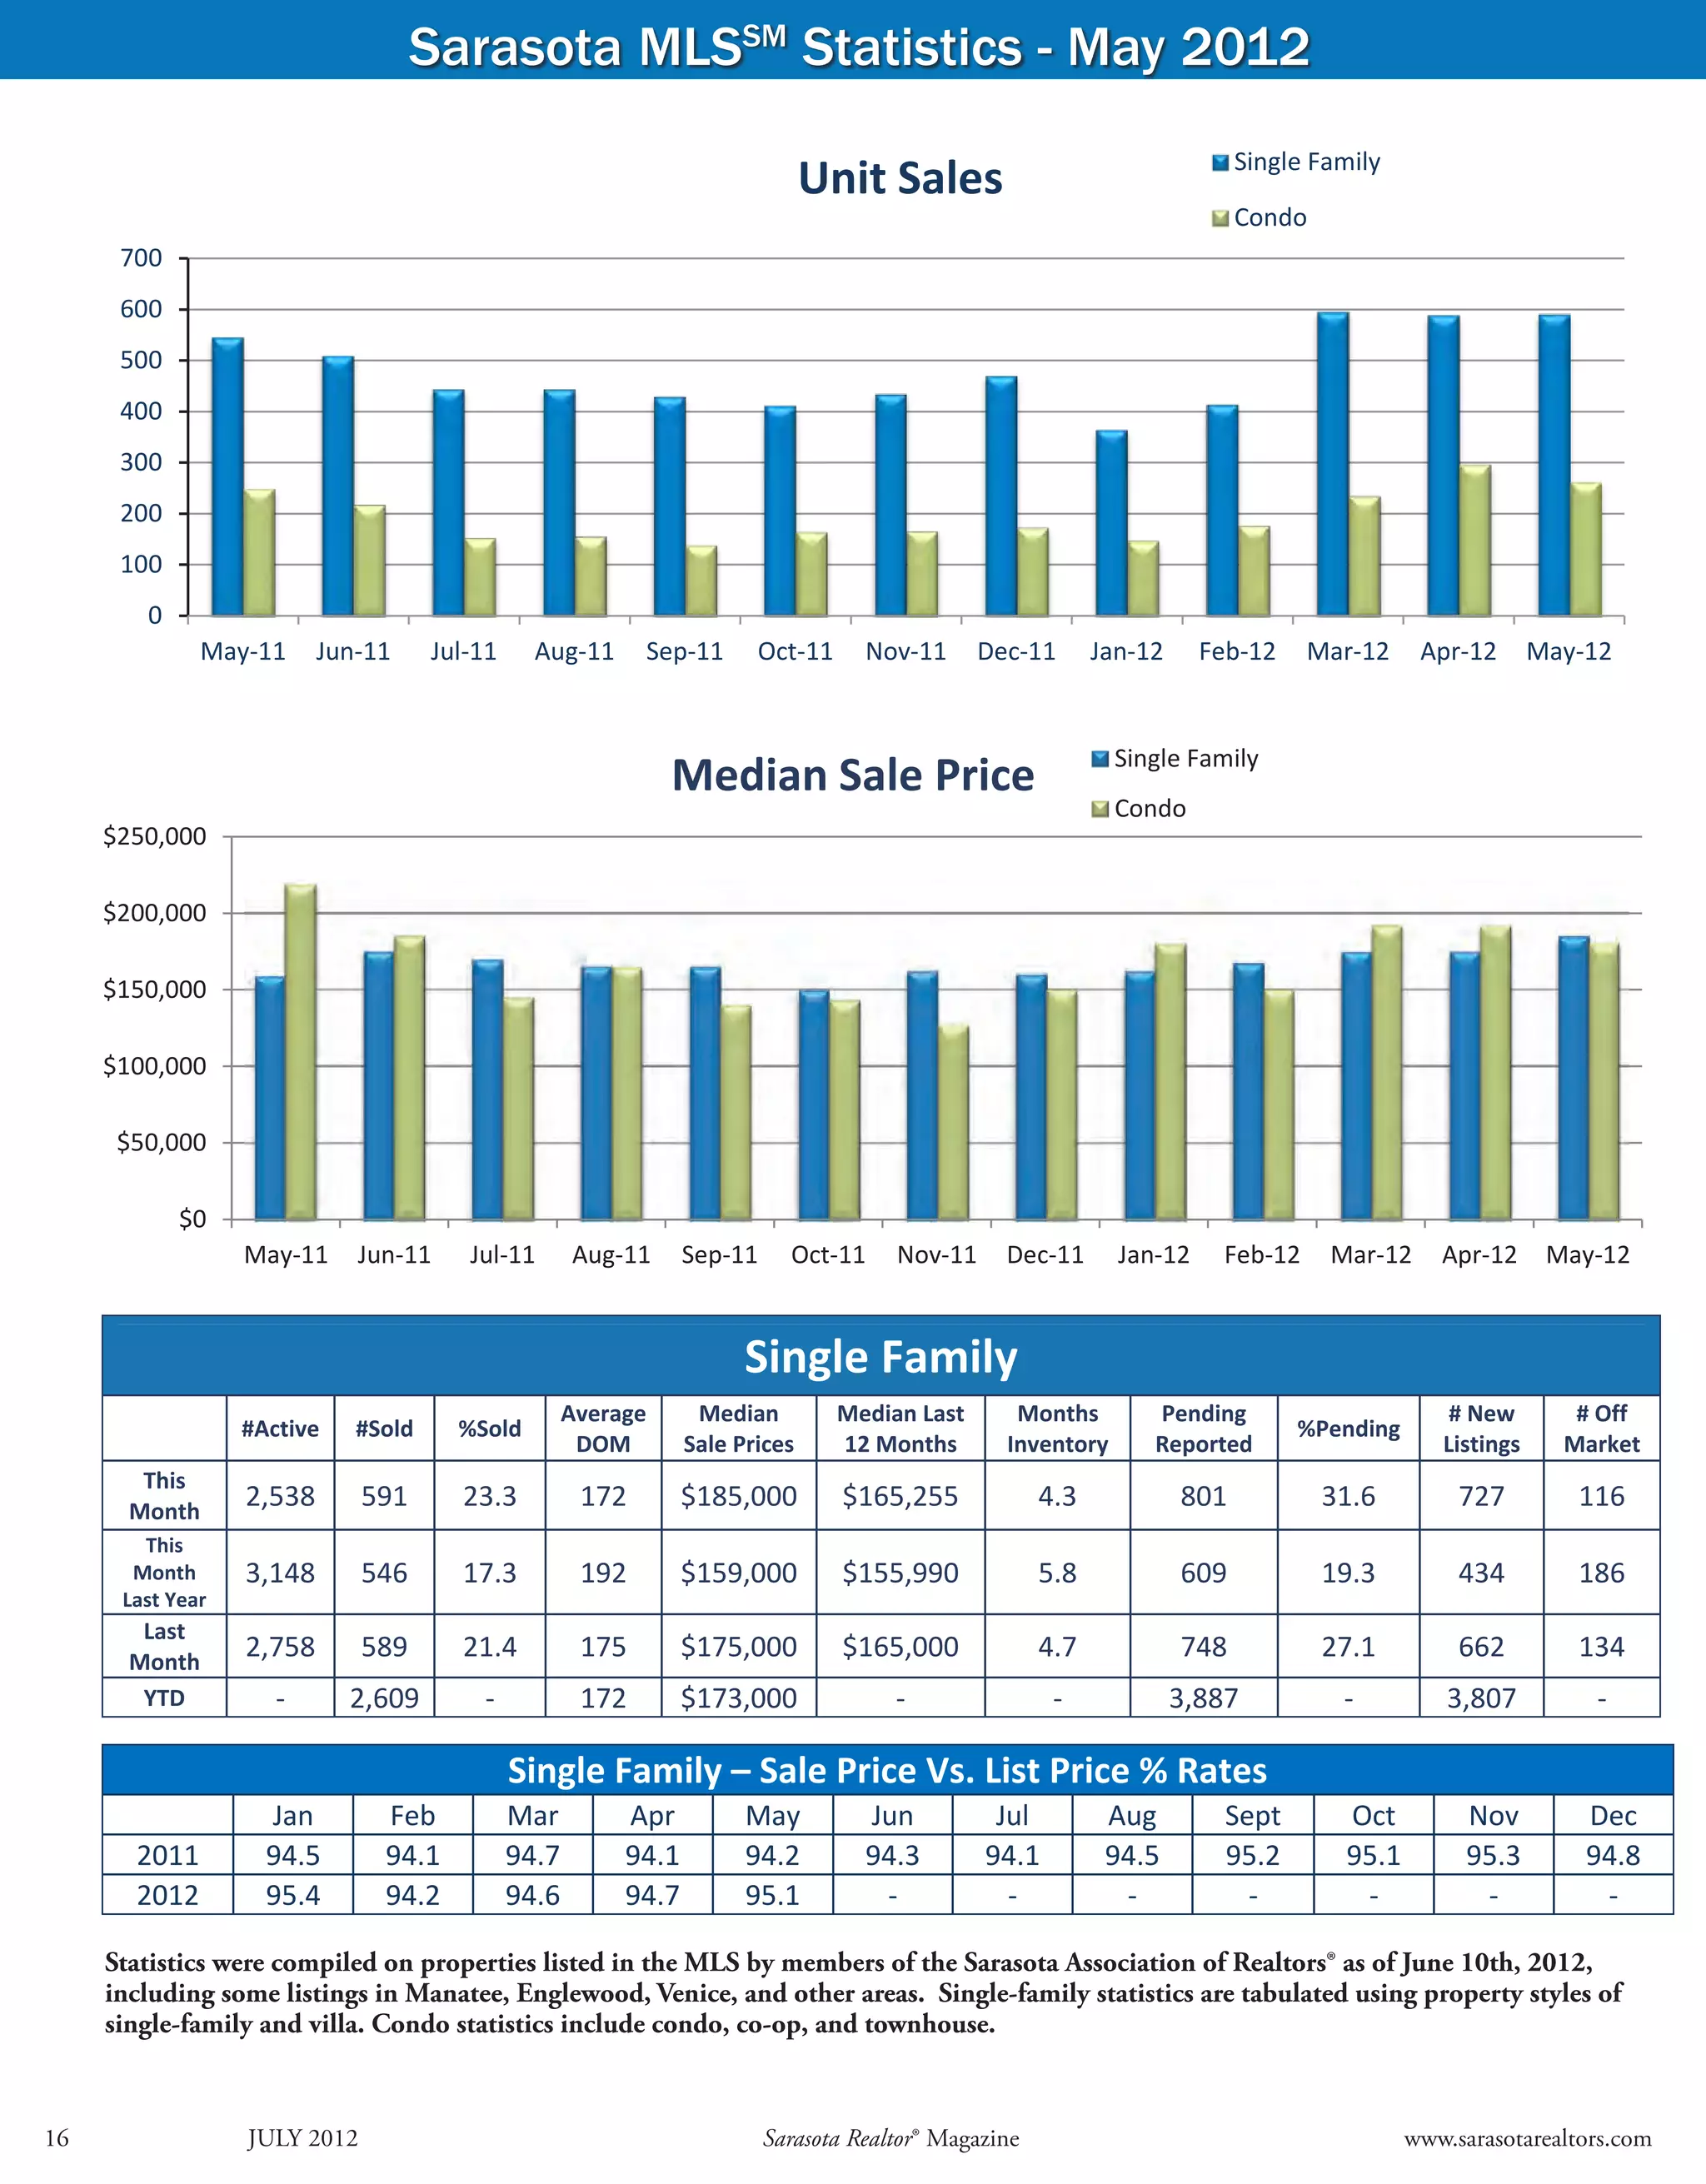
The document summarizes real estate statistics for Sarasota, Florida for May 2012. It shows that:
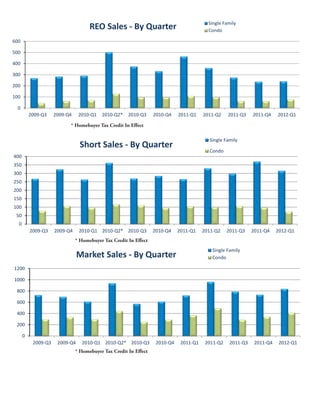
- 591 single family homes and 263 condo units were sold in May 2012. Median sale prices were $185,000 for single family homes and $180,750 for condos.
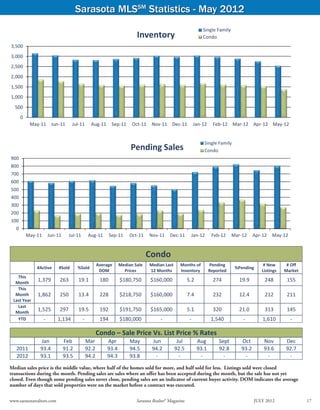
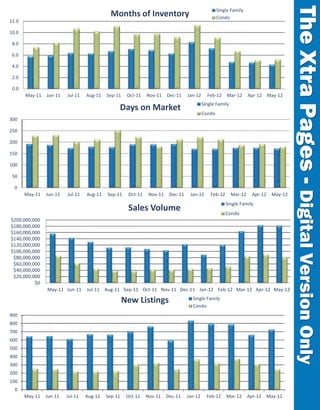
- Inventory levels decreased slightly for both single family homes and condos compared to the previous month. Months of inventory remained around 4-5 months.
- Pending sales and new listings also decreased slightly compared to April 2012. Days on market and sale to list price ratios remained steady.