More Related Content
Similar to Daily livestock report oct 5 2012
Similar to Daily livestock report oct 5 2012 (20)
More from joseleorcasita (20)
Daily livestock report oct 5 2012
- 1. Vol. 10, No. 193 October 5, 2012
Errata — we hope no one is keeping score on these BEEF PACKERS' EST'D GROSS MARGIN
items this week! Yesterday’s chart of the Canadian breeding herd
$/hd.
and all hogs and pigs inventories by quarter since 1996 did not include 275
a legend and did not indicate which scale each series represented. A 2011
2012
corrected chart appears on page 2.
225 Avg. '06-'10
Our mentions of Statistics Canada’s elimination of its
October and April Hog Statistics report prompted a number of e-
mail concerning the status of U.S. agricultural statistics reports. 175
There is well-founded concern that budget pressures will eventually
impact the amount of information provided by federal agencies, espe- 125
cially in light of cuts made last year. Joe Prusacki, the Director of the
Statistics Division at the National Agricultural Statistics Service 75
(NASS) said “NASS has attempted to spare the major (Principal Eco-
nomic Indicator) reports. There may come a time when we will 25
be forced to look at products such as hogs and pigs, grain stocks,
cattle-on-feed, crop production, etc. I hope not.”
-25
We hope not, too. While far more concentrated than in the J F M A M J J A S O N D
past, agricultural production enterprises are still generally much small-
er than are the buyers of their products. Most would have far less
information available to them than would their counter-parties if it were
PORK PACKERS' EST'D GROSS MARGIN
not for USDA data. $/Head
On this topic — USDA will hold a Data Users’ Meeting on 50.00
October 22 at the Crowne Plaza Hotel Chicago Metro. This meeting is 45.00
2011
held annually “To update data users on recent and pending changes 2012
40.00
in the various statistical and information programs important to agricul- Average '06-'10
ture, and to seek comments and input on these programs.” For full 35.00
information and to register for the meeting, go to www.nass.usda.gov/ 30.00
Education_and_Outreach/Meeting/index.asp.
25.00
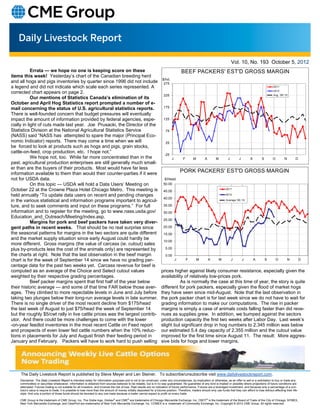
Margins for pork and beef packers have taken very diver-
gent paths in recent weeks. That should be no real surprise since 20.00
the seasonal patterns for margins in the two sectors are quite different 15.00
and the market supply situation since early August could hardly be
10.00
more different. Gross margins (the value of carcass (ie. cutout) sales
plus by-products less the cost of the animals only) are represented by 5.00
the charts at right. Note that the last observation in the beef margin 0.00
chart is for the week of September 14 since we have no grading per- J F M A M J J A S O N D
centage data for the past two weeks yet. Carcass revenue for beef is
computed as an average of the Choice and Select cutout values prices higher against likely consumer resistance, especially given the
weighted by their respective grading percentages. availability of relatively low-prices pork.
Beef packer margins spent that first half of the year below As is normally the case at this time of year, the story is quite
their historic average — and some of that time FAR below those aver- different for pork packers, especially given the flood of market hogs
ages. They climbed to more repectable levels in June and July before they have seen since mid-August. Note that the last observation in
taking two plunges below their long-run average levels in late summer. the pork packer chart is for last week since we do not have to wait for
There is no single driver of the most recent decline from $175/head grading information to make our computations. The rise in packer
the last week of August to just $75/head the week of September 14 margins is simply a case of animals costs falling faster than did reve-
but the roughly $5/cwt rally in live cattle prices was the largest contrib- nues as supplies grew. In addition, we bumped against the sectors
utor. And there could be more challenges to come with the lower production capacity the first two weeks after Labor Day. Last week’s
-on-year feedlot inventories in the most recent Cattle on Feed report slight but significant drop in hog numbers to 2.345 million was below
and prospects of even lower fed cattle numbers when the 10% reduc- our estimated 5.4 day capacity of 2.355 million and the cutout value
tions in placements for July and August finish their feeding period in improved for the first time since August 11. The result: More aggres-
January and February. Packers will have to work hard to push selling sive bids for hogs and lower margins.
The Daily Livestock Report is published by Steve Meyer and Len Steiner. To subscribe/unsubscribe visit www.dailylivestockreport.com.
Disclaimer: The Daily Livestock Report is intended solely for information purposes and is not to be construed, under any circumstances, by implication or otherwise, as an offer to sell or a solicitation to buy or trade any
commodities or securities whatsoever. Information is obtained from sources believed to be reliable, but is in no way guaranteed. No guarantee of any kind is implied or possible where projections of future conditions are
attempted. Futures trading is not suitable for all investors, and involves the risk of loss. Past results are no indication of future performance. Futures are a leveraged investment, and because only a percentage of a con-
tract’s value is require to trade, it is possible to lose more than the amount of money initially deposited for a futures position. Therefore, traders should only use funds that they can afford to lose without affecting their life-
style. And only a portion of those funds should be devoted to any one trade because a trader cannot expect to profit on every trade.
CME Group is the trademark of CME Group, Inc. The Globe logo, Globex® and CME® are trademarks of Chicago Mercantile Exchange, Inc. CBOT® is the trademark of the Board of Trade of the City of Chicago. NYMEX,
New York Mercantile Exchange, and ClearPort are trademarks of New York Mercantile Exchange. Inc. COMEX is a trademark of Commodity Exchange, Inc. Copyright © 2012 CME Group. All rights reserved.
- 2. Vol. 10, No. 192 October 4, 2012
SWINE BREEDING HERD - CANADA
Canada Breeding Herd All Hogs & Pigs
Thous. Breeding Thous. Head, All
Animals Hogs & Pigs
1,800 18,000
1,700 17,000
1,600 16,000
1,500 15,000
1,400 14,000
1,300 13,000
1,200 12,000
1,100 11,000
1,000 10,000
1996 1998 2000 2002 2004 2006 2008 2010 2012