1. Wind Energy Conversion Systems
Lecture Notes by
Prof. Shireesh B. Kedare
Adjunct Assistant Professor
ENERGY SYSTEMS ENGINEERING
INDIAN INSTITUTE OF TECHNOLOGY, BOMBAY
Powai, Mumbai 400076, INDIA
Contents
1. Background..................................................................................................................................................2
2. Introduction .................................................................................................................................................4
3. Historical aspects.........................................................................................................................................5
4. Wind machine parameters ...........................................................................................................................6
5. CP - λ characteristics for wind machines.....................................................................................................7
6. Aerodynamic theories for wind machines.................................................................................................10
7. Airfoil section............................................................................................................................................11
8. Wind analysis ............................................................................................................................................14
9. Wind machine mechanics..........................................................................................................................16
10. Power output of wind machine................................................................................................................20
11. Annual Energy Output (AEO) for the site of interest..............................................................................21
12. Wind machine design ..............................................................................................................................23
13. Controls ...................................................................................................................................................25
14. Siting........................................................................................................................................................25
15. Economics ...............................................................................................................................................26
Bibliography..................................................................................................................................................27
2. Energy Systems Engineering, IIT-B
Wind Energy Conversion Systems – Prof. S.B.Kedare 2
1. Background
Wind energy is a large renewable energy source. Global wind power potential is of the order of 11,000
GW. It is about 5 times the global installed power generation capacity. This excludes offshore potential as
it is yet to be properly estimated.
About 25,000 MW is the global installed wind power capacity. It is about 1% of global installed power
generation capacity. Wind produces about 50 billion kWh per year globally with the average utilization
factor of 2000 hours per year. Global wind power growth trends from 1980 to 1995 are shown in Figure 1
and the country wise details of installed wind power capacity from 1998 to 2001 is given in Table 1.
Figure 1 : Global wind power growth trends from 1980 to 1995
Table 1 : Installed wind power capacity from 1998 to 2001
Country Installed
capacity,
Dec. 1998
(MW)
Installed
capacity,
Dec. 1999
(MW)
Installed
capacity,
Dec. 2000
(MW)
Installed
capacity,
Dec. 2001
(MW)
Growth rate
2001-2002
(%)
3 year
average
growth (%)
1. Germany 2874 4442 6107 8734 43% 45%
2. USA 2141 2445 2610 4245 63% 26%
3. Spain 880 1812 2836 3550 25% 59%
4. Denmark 1420 1738 2341 2456 5% 20%
5. India 992 1035 1220 1456 19% 14%
6. Italy 197 277 424 700 65% 53%
7. Netherlands 379 433 473 523 11% 11%
8. U.K. 338 362 425 525 24% 16%
9. China 200 262 352 406 15% 27%
10. Greece 55 158 274 358 31% 87%
11. Japan 25 ? 140 357 155% ?
Total Global 9476 12964 17062 24927 35% 34%
Wind Force 12, European Wind Energy Association and Green Peace,
http://www.choose-positive-energy.org/docs/wind-force-12-2002.pdf, 2002
3. Energy Systems Engineering, IIT-B
Wind Energy Conversion Systems – Prof. S.B.Kedare 3
Wind energy is economically viable renewable energy source today. It costs about 5 cents per kWh
globally. It is the fastest growing energy market today with the growth rate of 35% per year.
In India, gross potential and technical potentials are estimated to be 45,195 MW and 12,8375 MW
respectively. Figure 2 shows distribution of wind power potential in India. It indicates wind power density
in W/m2
.
Figure 2 : Wind power density distribution in India (in W/m2
at 30 m hub height)
Major efforts towards installation of wind machines in India started in the late 1980’s and about 1,700
MW wind power capacity is installed by September 2002. Installed wind power capacity growth in India is
shown in Figure 3.
Figure 3 : Installed wind power capacity growth in India
4. Energy Systems Engineering, IIT-B
Wind Energy Conversion Systems – Prof. S.B.Kedare 4
India is ranking 5th
in the world based on the installed wind power capacity. It is producing about 2 billion
kWh per year from wind with the average utilization factor of 1175 hours per year. Cost of energy from
wind is about Rs.4 to 5 per kWh in India. India has also started exporting 1 MW capacity machines.
2. Introduction
Wind is an indirect solar energy source. Its characteristics can be summarized as follows.
• It is environmentally clean source of energy.
• It is a dilute source of energy.
• It is perennially available.
• Its availability is unpredictable.
• Data are available about its availability pattern around the day for different months of the year.
Wind Machine : The machine that converts kinetic energy in the wind into usable form of mechanical
energy (usually shaft power). Wind machines are typically used for mechanical applications like water
pumping, grinding, woodcutting, or for AC or DC power generation in grid connected or isolated mode.
Details of different types of wind machines are given in Table 2. Figure 4 shows typical wind machines.
Table 2 : Different types of Wind Machines
Type of machine No. of
Blades
Axis of
rotation
Rotor position
wrt tower
Starting
torque
Rotor
speed
Power
Propeller machine 2 or 3 Horizontal Upwind or
downwind
Moderate Fast Electrical
Multi-bladed machine 6 to 24 Horizontal Upwind High Slow Mechanical
Savonius machine 2 or 3 Vertical - Very high Slow Mechanical
Darrius machine 2 or 3 Vertical - Very low Fast Electrical
Study of wind machines is called Molinology. It cuts across various fields including Meteorology,
Aerodynamics, Machine Design, Structural Design, Materials Technology, Power Engineering, Reliability
Engineering, Instrumentation and Controls Engineering.
Three bladed propeller deign has evolved as the commercial Wind Energy Conversion System today.
Designs of 225 kW, 450 kW, 650 kW or 1 MW are installed commercially in India. Design and
performance details of a typical 1 MW unit installed by Suzlon are given in Table 3.
Table 3 : Details of a typical 1 MW Wind Energy Conversion System
1. Rotor diameter 61 m
2. Blade length 30 m
3. Rotor speeds 13 RPM / 22 RPM
4. Tower height 60 m
5. Wind speed range 3 m/s to 25 m/s
6. Power control Active blade pitching
7. Type of generator Induction generator
8. Generator Speed 1000 rpm / 1500 rpm
9. Generator rating 1 MW
10. Annual Energy Output 1.8 to 2 GWh
11. Machine cost About Rs. 4.2 Crores
5. Energy Systems Engineering, IIT-B
Wind Energy Conversion Systems – Prof. S.B.Kedare 5
Work on MOD series in US is now leading to the development of 3.2 MW 2-bladed propeller machine. It
will have diameter of around 92 m and will have tower height of about 60 to 70 m.
Figure 4 : Typical wind machine designs
3. Historical aspects
Some milestones in the history of wind machines are given in Table 4. Conceptual understanding of
aerodynamic shape and position of center of forces or zero moment reduced the structural problem of
supporting the blade. This was in the second decade of twentieth century. This is an important mile-stone
in the history of wind machines. Thereafter, longer blades of aerodynamic shape could be designed and
used.
6. Energy Systems Engineering, IIT-B
Wind Energy Conversion Systems – Prof. S.B.Kedare 6
Table 4 : Historical development of Wind Energy Conversion System
Period Machine Application
640 AD Persian wind mills Grinding, etc
Before 1200 AD Chinese sail type wind mill Grinding, water pumping, etc
12th
century AD Dutch wind mills Grinding, water pumping, etc.
1700 AD Dutch w/mill to America
1850 to 1930 AD American Multi-bladed Water pumping, 35 VDC power
1888 AD Brush wind turbine; Dia.17m, Tower 18.3m 12 kW Electric power
1925 AD Jacob’s 3 bladed propeller
Dia.5m, 10-20m/h, 125 to 225 rpm
0.8 to 2.5 kW at 32 VDC
1931 AD Yalta Propeller, Russia; 2 bladed, dia.100 ft 100 kW
1941 AD Smith-Putnam Propeller
2 bladed, dia.175ft, 30 m/h, 28 rpm
1250 kW
1925 AD Savonius Machine Mechanical or Electrical power
1931 AD Darrius Electrical power
1980s AD 2 bladed propeller (Commercially available) 225 kW
2000 AD HAWT, VAWT 400-625kW, 1.2-3.2 MW
4. Wind machine parameters
Power developed by the wind machine is mainly affected by wind speed, u, area swept by the rotor, AS,
density of air, ρ, rotational speed of the machine, Ω, radius of the rotor, R, number of blades, B and total
blade area. It is also affected by lift and drag characteristics of the blade profile. Lift and drag forces acting
on a blade element is shown in Figure 5. Application of dimensional analysis evolves following parameters
for characterizing wind machines.
Figure 5 : Lift and drag forces acting on a blade element
Coefficient of Performance, CP = P / (½ ρ AS u3
)
Where,
P = Power output at rotor shaft (W)
AS = Area swept by the machine (m2
)
ρ = Air density (kg/m3
)
u = Undisturbed wind speed (m/s)
Tip speed ratio, λ = R Ω / u
R = Rotor radius (m), Ω = rotational speed of the rotor (rad/s)
Solidity, σ = blade area / AS = (average chord x blade length x number of blades) / AS
7. Energy Systems Engineering, IIT-B
Wind Energy Conversion Systems – Prof. S.B.Kedare 7
Energy content of the wind
The quantity (½ ρ AS u3
) in the denominator of the definition of CP may be identified as power in the wind.
It is proportional to the cube of wind speed, u as the volume of bottle is to its dimensions. If u = 15 kmph,
power in the wind is 42 W/m2
. For u = 36 and 90 kmph, it is 583 and 9102 W/m2
.
5. CP - λ characteristics for wind machines
Drag translator device
Let a drag translator device shown in Figure 6 be subjected to wind with speed U. This is a device that
utilizes the drag force of the wind acting on it to develop power. Let the device be moving at speed v under
the wind forces acting on it in the direction same as that of the wind.
Figure 6 : A drag translator device
Then, the relative speed of the wind as seen by the device is (U – v) and the drag force of the wind acting
on a unit length of the drag translator device is given by,
D = CD (½ ρ c (U-v)2
)
Where, CD = drag coefficient of the drag translator device
c = width or chord of the drag translator device
And the power developed, P by the drag translator device is given by (D.v) or
P = CD (½ ρ c (U-v)2
) v
Coefficient of Performance, CP can then be written as,
CP = CD (U - v)2
v / U3
Maximizing this with respect to (v/U) gives, (v/U) = ⅓ and CP,max = (4/27) CD.
With CD = 1.5, CP,max = 0.22.
Lift translator device
On the similar lines, let a drag translator device shown in Figure 7 be subjected to wind at speed U. This is
a device that primarily utilizes the lift force of the wind acting on it to develop power. Let the device be
moving at speed v under the wind forces acting on it in the direction perpendicular to that of the wind.
8. Energy Systems Engineering, IIT-B
Wind Energy Conversion Systems – Prof. S.B.Kedare 8
Figure 7 : A lift translator device
Let the chord of the device be inclined at angle θ with respect to the direction of the wind. Then, the
relative speed of the wind as seen by the device is Vr = √(U2
+ v2
) and the driving force of the wind acting
on a unit length of the lift translator device is given by,
F = L cos θ – D sin θ
= (½ ρ c Vr
2
) [CL cos θ – CD sin θ ]
CL = lift coefficient of the lift translator device
CD = drag coefficient of the lift translator device
c = width or chord of the lift translator device
And the power developed, P by the lift translator device is given by (F.v) or
P = (½ ρ c Vr
2
) [CL cos θ – CD sin θ ] v
Coefficient of Performance, CP can then be written as,
CP = [CL cos θ – CD sin θ ] Vr
2
v / U3
= [CL cos θ – CD sin θ ] [1 + (v/U) 2
] (v/U)
Simplifying after substituting cos θ and sin θ in terms of (v/U) and maximizing CP with respect to (v/U)
gives, (v/U) = ⅔ (CL/CD) and CP,max = (2/9) CL (CL/CD) { (4/9) (CL/CD) 2
+ 1 }½
With CL = 1 and (CL/CD) = 10, CP,max = 15.
It is obvious from these results that the lift device has higher speed ratio and CP,max than those for the
drag device.
Betz limit on CP for actuator disc in the stream-tube
For ideal rotor disc or non-participating actuator disc in the stream-tube of air flow as in Figure 8,
maximum limit for power extraction can be derived under the following assumptions.
• No frictional (viscosity) losses
• Axi-symmetric flow, that is, absence of any vortex or rotational flow
9. Energy Systems Engineering, IIT-B
Wind Energy Conversion Systems – Prof. S.B.Kedare 9
Figure 8 : Actuator disc in the stream-tube
Using continuity principle and momentum equation expression can be derived for thrust acting on the
actuator disc and the power developed as wind flow retards across the rotor disc. CP is maximum (= 16 / 27
= 0.593) for an optimum value of flow retardation, a i.e., for an optimum value of λ. This limit is called
‘Betz limit’.
CP - λ characteristics for practical wind machines
CP - λ curves for typical wind machines are shown in Figure 9. Please note the positions of the curves for
Savonious machines and multi-bladed machines. Contrary to belief, the Savonious machines have been
shown to have high CP of the order of 0.3.
Figure 9 : Cp-λ curves for practical wind machines
10. Energy Systems Engineering, IIT-B
Wind Energy Conversion Systems – Prof. S.B.Kedare 10
Effect of solidity (range 0.03 to 1)
• Torque increases as solidity increases
• Wake in the downwind flow increases as solidity increases
• Maximum power decreases as wake increases
Hence, maximum power decreases as solidity increases
Effect of tip speed ratio
ƒ Tip speed ratio increases as solidity decreases
ƒ Maximum power increases as tip speed ratio increases
6. Aerodynamic theories for wind machines
Equation for CP as function of λ for axi-symmetric disc rotor considering wake effect
CP = (16/27) exp(-0.3538 λ-1.2946
)
Equation for CP as function of λ for rotor considering wake as well as drag effect with ε = CD / CL
(Blade Element Theory)
CP = (16/27) { exp(-0.3538 λ-1.2946
) - ε λ }
where, ε = CD / CL = Ratio of drag coefficient and lift coefficient for the airfoil
Equation for maximum power coefficient, CP,max as function of λ with ε = CD / CL and B = number of blade
CP, max = (16/27) { λ B0.67
/ [1.48 + (B0.67
– 0.04) λ + 0.0025 λ 2
] – ε [(1.92 λ 2
B)/ (1 + 2 λ B)] }
where, B = number of blade
This equation plotted for different combinations of number of blades, B and ratio of drag coefficient and
lift coefficient for the airfoil, ε is shown in Figure 10.
Figure 10 : CP, max as function of λ for different combinations of B and ε
11. Energy Systems Engineering, IIT-B
Wind Energy Conversion Systems – Prof. S.B.Kedare 11
7. Airfoil section
Airfoil is profiled to have very small drag. A typical airfoil having 200 mm chord and 15% thickness has
drag equivalent to a wire of 1mm diameter. It is characterized by coefficient of lift, CL and coefficient of
drag, CD that are function of angle of attack. Refer Figure 11. CL and CD are defined as,
CL = L / (½ ρ A u2
); CD = D / (½ ρ A u2
)
Figure 11 : Definition of chord and angle of attack for an airfoil section
Different types of airfoil sections are shown in Figure 12a and typical lift and drag characteristics are
shown in Figure 12b. Value of CL can go as high as 1.2 after which an airfoil stalls, typically at the angle
of attack 150
. Minimum value of CD / CL is typically in the range of 0.01 to 0.1.
Figure 12a : Types of airfoils
12. Energy Systems Engineering, IIT-B
Wind Energy Conversion Systems – Prof. S.B.Kedare 12
Figure 12b : Typical curves of Cl vs α and Cl vs Cd
SERI blade sections
The design requirements for airfoil sections of a wind machine are different from those of airplanes.
In wind machines fouling is a major problem because once the machine goes on line it has to run round the
day and round the year preferably without any break. Also the blades of wind machine are inaccessible
once installed and cannot be easily cleaned. Further, dirt deposited on the blades affect the performance of
the blade and in turn that of the machine significantly as shown in Figure 13.
Figure 13 : Effect of dirt on blade on the performance of the machine
Another consideration is the thickness of the blade at root. Typical NACA sections, common for
airoplanes, used for wind machine are shown in Figure 14a. They have high CL and high (CL/CD) ratio.
But, they are comparatively thinner. Structurally, a thick blade at root will always be easier to design to
take loads.
Based on these considerations, blades have been designed by Solar Energy Research Institute (now called
National Renewable Laboratory – NREL) in the USA. A set of these blades used for tip, middle span and
root is shown in Figure 14b.
13. Energy Systems Engineering, IIT-B
Wind Energy Conversion Systems – Prof. S.B.Kedare 13
Figure 14a : NACA Airfoils Figure 14b : SERI Airfoils
The comparative performance of wind machine with NACA and SERI blades when they are clean and
fouled (dirty) is shown in Figures 15a and 15b.
Figure 15a : Comparative performance of wind machine with clean NACA and SERI blades
Figure 15b : Comparative performance of wind machine with fouled NACA and SERI blades
14. Energy Systems Engineering, IIT-B
Wind Energy Conversion Systems – Prof. S.B.Kedare 14
8. Wind analysis
Wind data collection and analysis suitable for wind energy system siting and designing started since 1980
in India. The annual average and monthly average for July of mean hourly wind speeds for India at 10m
above ground are shown in Figures 16 and 17.
Hourly mean wind speed
Wind speed is typically measured at 10 and 20 m height for 2 second duration at 1 minute interval. These
data are used for calculating frequency distribution. The Hourly Mean Wind Speed is calculated by
averaging the 1 minute data for the hour.
Frequency distribution
Power in the wind cannot be estimated unless its frequency distribution is known. This is recorded as
hourly mean value and plotted for the site of interest. Typical frequency distribution, f(u) as function of
wind speed u and cumulative frequency, F(u) also as function of wind speed u are shown in Figure 18.
Figure 16 : Mean annual wind speed for India
15. Energy Systems Engineering, IIT-B
Wind Energy Conversion Systems – Prof. S.B.Kedare 15
Figure 17 : Mean monthly wind speed for India for July
Figure 18 : Frequency distribution curve and Figure 19 : Weibull density function f(u) for
cumulative frequency scale parameter c = 1
16. Energy Systems Engineering, IIT-B
Wind Energy Conversion Systems – Prof. S.B.Kedare 16
Weibull distribution
The wind speed frequency distribution curve is closely represented by Weibull distribution as given below.
Frequency function in s/m : f(u) = (k / c) (u / c)(k-1)
exp [-(u / c)k
]
Scale factor in m/s, c > 1; Shape factor, k > 0; wind speed in m/s, u >0.
This function has maximum at, u / c = [ (k-1) / k ](1/k)
Effect of k on frequency density curve is shown in Figure 19. Factors c and k can be related to mean wind
speed, umean and standard deviation, σ n-1 for the site of interest.
c / umean = 1.12 for 1.5 < k < 3
and,
k = (σ n-1 / umean)-1.086
Elaborate curve fitting into the wind data at the site can also be done to find c and k. For this, cumulative
frequency data is very useful.
When integrated, Weibull distribution leads to cumulative frequency of occurrence of wind up to speed u
given as,
F(u) = 1 – exp [ - (u / c)k
]
Power density, Pd in the wind in W/m2
, energy pattern factor, EPF and energy content, EC of the wind in
Wh/m2
/yr, defined below serve as useful parameters for assessing prospective wind energy site and are
calculated from the data for the site of interest.
Pd = ½ ρ f(u) u3
du ; EPF = Pd / (½ ρ umean
3
) = (u3
)mean / (umean)3
; EC = 8760 x Pd
where, ρ is air density at the site in kg/m3
.
Rayleigh distribution
Rayleigh distribution has been commonly used for analyzing wind frequency distribution. It is a special
case of Weibull distribution with k = 2 and c = (2 umean / √ π ). It is given by,
Frequency function in s/m : f(u) = (π u / 2 umean
2
) exp [-(π/4) (u/umean
2
)]
Power Law Index
Variation in the wind speed, u along the height, z above ground level is given by the Power Law Index, α
as below. Value of α is typically 0.14 or 1/7. Hence, it is called ‘1/7th
Power Law’.
u1 / u2 = ( z1 / z2 )
α
9. Wind machine mechanics
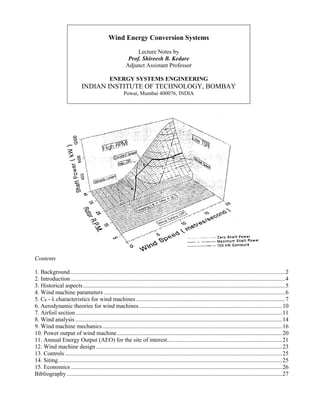
Power developed by wind machine vs its speed of rotation for different wind speed can be calculated for
the given machine from its Cp-λ curve and is shown in Figure 20. Constant speed lines are marked on the
graph.
∞
∫
0
17. Energy Systems Engineering, IIT-B
Wind Energy Conversion Systems – Prof. S.B.Kedare 17
Figure 20 : Shaft power output as function of speed of rotation for 17 m Sandia Darrius
Starting and operating point for wind machine
Refer Figure 21 that shows torque developed by a wind machine as a function of its rotational speed.
• Starting of the machine (propeller type) : Machine starts and stabilizes at high λ under no load
• Operating condition : Machine stabilizes at appropriate λ matching with load conditions
18. Energy Systems Engineering, IIT-B
Wind Energy Conversion Systems – Prof. S.B.Kedare 18
Figure 21 : Torque developed by a wind machine as a function of its rotational speed
Fixed speed and variable speed machines
• Variable speed machines run at different RPM at different wind speeds. Load varies with machine
RPM, e.g., reciprocating pump attached as load.
• Constant speed machines are designed to run at constant RPM. Load varies to match the power
generated or blade angle is changed (pitched) to change the power developed.
• Two speed machines are designed to run at two different constant RPMs. They develop lower
power at low wind speeds running at lower RPM. They develop higher power at high wind speeds
running at higher RPM.
Selection of operating speed is always an important design issue. Figure 22 shows power developed by a
machine at different speeds of rotation. It can be seen that the machine developes more power at higher
spped of rotation at higher wind speeds. However, at low wind speeds which are more frequent, a slower
machine can develop higher power. Therefore, modern machines operate at two different rotational speeds
with different ratings.
Load matching
An ideal load would be that for which the machine always develops maximum power or always operates at
maximum Cp as shown in Figure 23. Any load that develops torque proportional to the square of its
rotational speed can be matched with the machine requirement by appropriate gear selection.
19. Energy Systems Engineering, IIT-B
Wind Energy Conversion Systems – Prof. S.B.Kedare 19
Figure 22 : Power developed by a wind machine at different speeds of rotation
Figure 23 : Torque vs rotational speed for a wind machine with ideal load
20. Energy Systems Engineering, IIT-B
Wind Energy Conversion Systems – Prof. S.B.Kedare 20
10. Power output of wind machine
In practical machines, generator has the rating and it cannot be operated beyond this limit. Hence at higher
wind speeds, wind machine blades are regulated to shed extra power. Thus the machine operates at reduced
Cp as shown in Figure 24.
Figure 24 : Cp vs u showing reduced Cp
Mechanical and electrical power output as function of wind velocity for constant speed machine are shown
in Figure 25. Idealized wind turbine output vs wind speed is shown in Figure 26.
Figure 25 : Mechanical and electrical power Figure 26 : Idealized wind turbine output
output as function of wind speed for vs wind speed
17 m Darrius turbine at 42 rpm
21. Energy Systems Engineering, IIT-B
Wind Energy Conversion Systems – Prof. S.B.Kedare 21
Following characteristic parameters for wind machine are clear from this Figure.
• Rated power of the machine, PeR is the maximum power developed by the rotor and is also the
generator rating.
• Cut-in speed, uc is the minimum wind speed at which the machine starts rotating.
• Rated speed, uR is the minimum wind speed at which the machine develops rated power. This is
the speed at which the blade regulation bcome active.
• Furling speed, uF is the maximum wind speed at which the machine develops power. The machine
is stopped beyond this speed.
Electrical power, Pe developed by wind machine as function of u may be idealized as,
Pe = 0 for u < uc
Pe = a + b uk
for uc < u < uR
Pe = PeR for uR < u < uF
Pe = 0 for u > uF
with, a = PeR uc
k
/ (uc
k
- uR
k
); and, b = PeR / (uR
k
- uc
k
)
11. Annual Energy Output (AEO) for the site of interest
The total energy output of the machine considering the power output at any wind speed and frequency of
occurrence of that wind in a year at the site of interest is AEO. Combining Pe as function of u and wind
speed frequency distribution described by Weibull parameters for the site, the annual average power for the
machine is given by,
Pe, ave = PeR { [exp (-Qc) – exp (-Qr) ] / (Qr – Qc) – exp (-Qf) }
where, Qc = (uc / c)k
, Qr = (uR / c)k
, Qf = (uF / c)k
Then, the Capacity Factor (CF) for the wind machine is given by, CF = Pe, ave / PeR
Wind machine speed range for given site is selected such that Capacity Factor (CF) or Annual Energy
Output (AEO) is maximum.
The effect of rated wind speed for the machine on it CF or AEO can be studied by studying the behaviour
of normalized power function, PN. Normalized power, PN is defined as,
PN = CF (uR / c)3
Figure 27 shows PN plotted vs (uR / c) for different values of Weibull shape parameter k. Plot (a) is plotted
for (uc / uR) = 0.5 and (uF / uR) = 2. Plot (b) is plotted for (uc / uR) = 0.4 and (uF / uR) = 2.
These plots can be used for selecting uc, uR and uF for maximum Capacity Factor (CF) or Annual Energy
Output (AEO) for c and k of the site. Selection of the ratio (uc / uR) depends upon the starting
characteristics of the wind machine.
This analysis can also be applied to see how much power can be generated for a wind machine of given
parameters.
22. Energy Systems Engineering, IIT-B
Wind Energy Conversion Systems – Prof. S.B.Kedare 22
Figure 27a : PN vs (uR/c) for different values of k for (uc/uR) = 0.5 and (uF/uR) = 2.
Figure 27b : PN vs (uR/c) for different values of k for (uc/uR) = 0.4 and (uF/uR) = 2.
23. Energy Systems Engineering, IIT-B
Wind Energy Conversion Systems – Prof. S.B.Kedare 23
12. Wind machine design
Blade design is carried out based on aerodynamic analysis for optimum CP at design wind speed. Airfoil
with 0SERI sections are used and chord and blade angles are calculated based on aerodynamic analysis. A
photograph of a propeller machine blade being fabricated is shown in Figure 28 and nacelle of 3-bladed
propeller machine is shown in Figure 29.
Figure 28 : Propeller machine blade under preparations
Figure 29 : Nacelle of 3-bladed propeller machine
Mechanical designing of gears, shafts and brakes is carried out. They have effect on minimum power
required to start the machine, cut-in-speed, capacity to absorb variation in rotor torque by storing in the
form of strain energy, shaft rigidity for non-useful loads and flexibility for useful loads.
Structural design is carried out for blades, root, hub, support structure, tower and foundation based on
static, dynamic and fatigue loading. Blade root is subjected to loads as well as moments in all three
direction. Further they vary through-out the life of the machine even if it is in a shut-down condition. Soft
designing techniques like coning and teetering of rotor may be used in rotor design.
Selection of tower is also important in wind machine design as it slows down the wind and also imparts
excitation loads on the machine. Natural frequencies of different wind machine components need to be
carefully designed considering the frequency of these excitation loads.
24. Energy Systems Engineering, IIT-B
Wind Energy Conversion Systems – Prof. S.B.Kedare 24
The wind machine should also be designed considering the requirements of transport and installation.
Stronger and comparatively straight roads are required to transport long blades and heavy equipment to the
site usually in remote areas. Similarly, heavy, sophisticated and costlier material handling equipment is
required to handle heavy and unwieldy machine components at site. Figure 30 shows machine installed at
site.
Figure 30 : Wind machine being installed at site.
Design drivers for wind machine components are listed in Table 5. Designing of wind machine is highly
demanding job and beats even the design difficulties of aircraft or helicopters as is evident from Figure 31.
Table 5 : Design drivers for wind machine components
25. Energy Systems Engineering, IIT-B
Wind Energy Conversion Systems – Prof. S.B.Kedare 25
Figure 31 : Comparative design challenge by different machines
13. Controls
The rotor power is limited by generator rating. At high wind speeds the power is regulated by any of the
following approaches.
• Pitch control : blade is pitched so as to keep angle of attack low.
• Stall regulation : blade is designed so that angle of attack is high in stall range at high wind speeds
• Active stall control : blade is pitched so as to keep angle of attack high in stall range
Yaw control and furling is done by yaw gear at the top of the tower. Furling can also be done by blade
pitching.
14. Siting
Wake effects of one machine on another decides the spacing between the wind machines in a farm. Typical
spacing between the machines in a wind farm is shown in Figure 32 and effect of spacing on energy loss is
shown in Figure 33. Grid connectivity, accessibility are important considerations in selection and design of
wind machine site. Other considerations are reducing noise, transmission disturbance and visual
disturbance.
Figure 32 : Typical spacing for wind farm
26. Energy Systems Engineering, IIT-B
Wind Energy Conversion Systems – Prof. S.B.Kedare 26
Figure 33 : Effect of spacing on energy loss
Typical modern wind farm is shown in Figure 34 and off-shore wind machine installation is shown in
Figure 35. Wind machine farm in the hills of District Satara, Maharashtra, India is shown in Figure 36.
Figure 34 : Typical modern wind farm Figure 35 : Off-shore wind machine installation
15. Economics
The latest designs of propeller type wind machines are available in Indian market in 250, 450, 600 or 1000
kW size and cost Rs.4 to 4.2 Crore/MW. They are economic if they run for 1200 to 1500 hours annually.
27. Energy Systems Engineering, IIT-B
Wind Energy Conversion Systems – Prof. S.B.Kedare 27
Figure 36 : Wind machine farm in the hills of District Satara, Maharashtra, India
Bibliography
Johnson G.L., Wind Energy Systems, Prentice Hall, 1985.
Ministry of Non-conventional Energy Sources (MNES), Wind Power Development in India – Towards
Global Leadership, MNES, Government of India, October 2002.
Rangarajan S., Wind Energy Resource Survey in India, Vol.5, Indian Institute of Tropical Meteorology,
Bangalore, 1998
Spera D.A. (Ed.), Wind Turbine Technology : Fundamental Concepts of Wind Turbine Engineering,
ASME Press, New York,1994.
Sukhatme S.P., Solar Energy, 2nd
Ed., Tata McGraw-Hill Publishing Co.Ltd., N.Delhi, 1996.
http://www.windpower.org, Danish Wind Industry Association, Copenhagen V, Denmark
.o0o.
For any comments, contact :
Prof. S.B.Kedare, Energy Systems Engineering, IIT, Powai, Mumbai 400076, INDIA
sbk _ 030416