1. 15 October, 2002 1
Ground Water Data
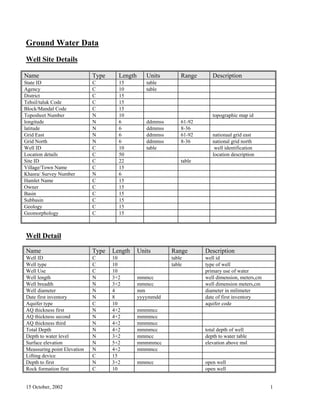
Well Site Details
Name Type Length Units Range Description
State ID C 15 table
Agency C 10 table
District C 15
Tehsil/taluk Code C 15
Block/Mandal Code C 15
Toposheet Number N 10 topographic map id
longitude N 6 ddmmss 61-92
latitude N 6 ddmmss 8-36
Grid East N 6 ddmmss 61-92 nationaal grid east
Grid North N 6 ddmmss 8-36 national grid north
Well ID C 10 table well identification
Location details C 50 location description
Site ID C 22 table
Village/Town Name C 15
Khasra/ Survey Number N 6
Hamlet Name C 15
Owner C 15
Basin C 15
Subbasin C 15
Geology C 15
Geomorphology C 15
Well Detail
Name Type Length Units Range Description
Well ID C 10 table well id
Well type C 10 table type of well
Well Use C 10 primary use of water
Well length N 3+2 mmmcc well dimension, meters,cm
Well breadth N 3+2 mmmcc well dimension meters,cm
Well diameter N 4 mm diameter in milimeter
Date first inventory N 8 yyyymmdd date of first inventory
Aquifer type C 10 aquifer code
AQ thickness first N 4+2 mmmmcc
AQ thickness second N 4+2 mmmmcc
AQ thickness third N 4+2 mmmmcc
Total Depth N 4+2 mmmmcc total depth of well
Depth to water level N 3+2 mmmcc depth to water table
Surface elevation N 5+2 mmmmmcc elevation above msl
Meassuring point Elevation N 4+2 mmmmcc
Lifting device C 15
Depth to first N 3+2 mmmcc open well
Rock formation first C 10 open well
2. 15 October, 2002 2
Depth to second N 3+2 mmmcc open well
Rock formation second C 10 open well
Depth to third N 3+2 mmmcc open well
Rock formation third C 10 open well
Well Drilling Details
Name Type Length Units Range Description
Well ID C 10
Well type C 10
Date of commencement of Drilling N 8 yyyymmdd
Date Drilling completion N 8 yyyymmdd
Drilling Agency C 10
Drilling method C 15
Drilled depth N 4+2 mmmmcc meters.cm
First water struck depth N 4+2 mmmmcc meters.cm
Water bearing zone1 N 4+2 mmmmcc meters.cm
Water bearing zone2 N 4+2 mmmmcc meters.cm
Water bearing zone3 N 4+2 mmmmcc meters.cm
Water bearing zone4 N 4+2 mmmmcc meters.cm
Well Lithology
Name Type Length Units Range Description
Well ID C 10
Depth to 1 N 5 mmmcc
Formation 1 C 15 table
Depth to 2 N 5 mmmcc
Formation 2 C 15 table
Depth to 3 N 5 mmmcc
Formation 3 C 15 table
Depth to 4 N 5 mmmcc
Formation 4 C 15 table
Depth to 5 N 5 mmmcc
Formation 5 C 15 table
Depth to 6 N 5 mmmcc
Formation 6 C 15 table
Depth to 7 N 5 mmmcc
Formation 7 C 15 table
Depth to 8 N 5 mmmcc
Formation 8 C 15 table
Well Assembly
Name Type Length Units Range Description
Well ID C 10
Casing type C 15 table
Casing Diameter N 4 mm
Casing position from 1 N 6 mmmmcc
3. 15 October, 2002 3
Casing position to 1 N 6 mmmmcc
Casing position from 2 N 6 mmmmcc
Casing position to 2 N 6 mmmmcc
Drilling depth N 6 mmmmcc
Well completion depth N 6 mmmmcc
Drilling fluid C 15 table
Pilot Hole Depth N 6 mmmmcc
Pilot Hole Diameter N 4 mm
Reamed Depth N 6 mmmmcc
Screen Type C 15 table
Slots Type C 12 table
Screen Diameter N 4 mm
Screen position from 1 N 6 mmmmcc
Screen position to 1 N 6 mmmmcc
Screen position from 2 N 6 mmmmcc
Screen position to 2 N 6 mmmmcc
Screen position from 3 N 6 mmmmcc
Screen position to 3 N 6 mmmmcc
Slot size N 2 ??
Gravel pack C 1 Y/N if gravel pack
Gravel pack position from1 N 6 mmmmcc if gravel pack
Gravel pack position to 1 N 6 mmmmcc if gravel pack
Gravel pack volume 1 N 3 m3 if gravel pack
Gravel pack size 1 N 2 mm if gravel pack
Gravel pack position from2 N 6 mmmmcc if gravel pack
Gravel pack position to 2 N 6 mmmmcc if gravel pack
Gravel pack volume 2 N 3 m3 if gravel pack
Gravel pack size 2 N 2 mm if gravel pack
Gravel pack position from3 N 6 mmmmcc if gravel pack
Gravel pack position to 3 N 6 mmmmcc if gravel pack
Gravel pack volume 3 N 3 m3 if gravel pack
Gravel pack size 3 N 2 mm if gravel pack
Grouting C 1 Y/N
Grouting position from1 N 6 mmmmcc if grouting
Grouting position to 1 N 6 mmmmcc if grouting
Grout material 1 C 8 if grouting
Grouting position from2 N 6 mmmmcc if grouting
Grouting position to 2 N 6 mmmmcc if grouting
Grout material 2 C 8 if grouting
Grouting position from3 N 6 mmmmcc if grouting
Grouting position to 3 N 6 mmmmcc if grouting
Grout material 3 C 10 if grouting
Development method C 15 table
Well performance
4. 15 October, 2002 4
Name Typ
e
Length Unit Range Description
Well ID C 10 well identification
Pumping test C 1 Y/N
Number of steps N 1
Discharge N 4 m3/h for each step
Drawdown N 4 m for each step
Aquifer loss N 4 m for each step
Well loss N 4 m for each step
Well efficiency N 2 % for each step
Rate of Discharge N 7 m3/h constant discharge test
Pumping duration N 5 hhhmm constant discharge test
No of observation wells N 1 constant discharge test
Max drawdown N 5 mmmcc constant discharge test
Specific Capacity N 7 m3/h/m constant discharge test
Transmissivity N 7 ??? constant discharge test
Storativity N 6 ??? constant discharge test
Specific yield N 4 ??? constant discharge test
Ground Water - Time Series data
Water Quality Details
Name Type Length Units Range Description
State ID C 15 table
Agency ID C 10 table
Well ID C 10 table
Well type C 10 table
Sample ID C 10
Date of sample N 8 yyyymmdd
Date of analysis N 8 yyyymmdd
Lab ID C 10 identity of laboratory
Depth of sampling N 6 mmmmcc for each sample
pH N 4 -log10mol/l 4-10 water acidic value
EC N 6 micromhos/c
m
electrical conductivity
CO3 N 4 mg/l
HCO3 N 4 mg/l
Cl N 4 mg/l
SO4 N 4 mg/l
NO3 N 4 mg/l
Ca N 4 mg/l
Mg N 4 mg/l
Na N 4 mg/l
K N 4 mg/l
F N 4 mg/l
Fe N 4 mg/l
Si N 4 mg/l
5. 15 October, 2002 5
Water Level
Name Type Length Units Range Description
State ID C 15 table
Agency ID C 10 table
Well ID C 10 table
Well type C 10
Elevation N 7 m
Date N 8 yyyymmdd for each measurment
year,month,day
Time N 4 hhmm for each measurment
hours,minutes
Hight of measurment point N 5 mmmcc for each measurment
Water level N 5 m for each measurment
Remarks C 30 for each measurment
6. 15 October, 2002
1
Surface Water & Meteorology Data
Catchment Data
Name Type Length Units Range Description
General
Catchment ID C 10 al. num. Code for catchment identification
Catchment name C 30 al. num. name of the catchment
River Basin C 30 alpha name of the major river basin
Tributary to C 30 alpha name of the major river d/s
Bank C 1 R/L R=right or L=left bank tributary
Longitude N 6 ddmmss 60-99 long. of the outlet
Latitude N 6 ddmmss 6-36 lat. of the outlet
Elevation N 4+2 m+MSL 0-9999.99 elevation of zero flow at outlet
Basin Area N 6+2 sq km 0-999999.99 area of catchment
Geomorphologic
Order of the catchment N 1 no. 1-9 Order of highest order stream
Length N 5+2 kms 99999.99 length of main stream
Perimeter N 5+2 kms 99999.99 perimeter of the catchment
Lc N 5+2 kms 99999.99 length of main stream from near the centroid to outlet
Slope N 1+5-(E) - -1.0 - 1.0 Hydraulic slope of the main stream
Bifurcation ratio N 1+2 - 1.00-5.00 on 1:50,000 scale
Length ratio N 1+2 - 1.00-5.00 -do-
Area ratio N 1+2 - 1.00-5.00 -do-
DTM available C 1 Y/N is digital terrain model available
Utilisation of Potential
Weirs/dams N 4 no. 0-9999 number of existing weirs/dams
Off - takes N 4 no. 0-9999 number of off-takes
Total off-take capacity N 5+2 m3
/s 0-99999.99 total capacity
Total command area N 7+1 ha 0-9999999.9 total of all projects
Land Use & Soil Groups
Land use
Urban N 2+2 % 0 - 100 percent of total catchment area
Forest N 2+2 % 0 - 100 percent of total catchment area
Waste land N 2+2 % 0 - 100 percent of total catchment area
Cultivated agricultural N 2+2 % 0 - 100 percent of total catchment area
7. 15 October, 2002
2
Agricultural N 2+2 % 0 - 100 percent of total catchment area
Water Bodies N 2+2 % 0 - 100 percent of total catchment area
Arid & Semi arid N 2+2 % 0 - 100 percent of total catchment area
Hydrologic Soil Group
A N 2+2 % 0 - 100 percent of total catchment area
B N 2+2 % 0 - 100 percent of total catchment area
C N 2+2 % 0 - 100 percent of total catchment area
D N 2+2 % 0 - 100 percent of total catchment area
Reach Characteristics
Upper reach length N 5+2 kms 0 - 99999.99 length of the reach
Middle reach length N 5+2 kms 0 - 99999.99 length of the reach
Lower reach length N 5+2 kms 0 - 99999.99 length of the reach
Upper reach Slope N 1+5 - -1.0 - 1.0 Hydraulic slope of reach
Middle reach Slope N 1+5 - -1.0 - 1.0 Hydraulic slope of reach
Lower reach Slope N 1+5 - -1.0 - 1.0 Hydraulic slope of reach
Upper reach bed C 20 Type of bed material
Middle reach bed C 20 Type of bed material
Lower reach bed C 20 Type of bed material
Station data
Name Type Length Units Range Description
General
State ID C 10 table
Agency Name C 20 table
Agency ID C 10 table
district Name C 20 table
Station ID C 10 al. num. station id
Station name C 20 alpha name of station
Station type C 10 al. num. station type
River/canal name C 20 alpha name of river or canal on which the station is located
latitude N 6 ddmmss 8-36
longitude N 6 ddmmss 61-92
Distance N 6 Km distance from station to next confluence d/s
Elevation N 6 m+MSL m + mean see level
Catchment area N 6 sq km area u/s of station for gauging station
Data transmission C 1 M/P Messenger, Post
8. 15 October, 2002
3
Date of Establishment N 8 yyyymmdd
Locational
Reference Toposheet C 8 1:50,000 toposheet containing the outlet
Location of GTS BM C 50 text about location of GTS BM
Level of GTS BM N 4+3 m+MSL level of GTS BM
Location of Musto BM C 50 text about location of Musto BM
Level of Musto BM N 4+3 m+MSL level of Musto BM
location C 100 location description of station
Accessibility C 200 description for accessibility
Overall plan C 20 reference of overall plan file
Detailed drawings C 20 reference of detailed drawings file
Railway station C 20 nearest railway station
Airport C 20 nearest airport
Location of site office C 60 Location of site office
Postal address C 120 postal address of the Site office
Inspection bungalows C 60 location of inspection bungalows
Nearby projects C 120 statement about location of nearby projects
Nearby bridge C 20 location of nearby bridge
Bridge length N 6 m length of the bridge d/s
Number of spans N 2 number of spans in bridge
width of span C 50 statement about width of span(s)
Controls C 100 description of nearby controls
Type of Establishment
Staff gauge C 1 (Y/N)
AWLR C 1 (Y/N)
Flow by Float C 1 (Y/N)
Flow by current meter C 1 (Y/N)
Flow by moving boat C 1 (Y/N)
Water Quality C 1 (Y/N)
Sediment C 1 (Y/N)
SRG C 1 (Y/N)
AGR C 1 (Y/N)
Met. Observatory C 1 (Y/N)
FCS C 1 (Y/N)
Evaporimeter C 1 (Y/N)
Staff Gauging
Start Date N 8 yyyymmdd 19000101-20491231
Location of gauge line C 50 statement
9. 15 October, 2002
4
Number of gauge lines N 1 1 - 5
Distance of gauge lines N 4 m 50 - 3000 distance between outer lines
Gauge zero N 4+2 m 0 - 5000.00 above msl
Minimum level N 2+2 m -30.0 - 30.0 w.r.t to zero of the gauge
Maximum level N 2+2 m -30.0 - 99.99 w.r.t to zero of the gauge
Water level range N 2 m 0 - 99
Rise of stage N 2+2 m/hr 0 - 99 maximum rate of rise of water level
Fall of stage N 2+2 m/hr 0 - 99 maximum rate of fall of water level
Back water effects C 1 Y/N back water effect present or not
Tidal effects C 1 Y/N tidal effect present or not
Sampling interval N 2 hr 0 - 24
times of observation C 20 statement for times of observations
Submission interval N 2 days submission interval of field data
A W L R
Start Date N 8 yyyymmdd 19500101-20491231
Closure Date N 8 yyyymmdd 19500101-20491231
Type of gauge C 1 F/P/B/A Float, Pressure transducer, Bubble, Acoustic
Make C 20 instrument make
Year of manufacture N 4 yyyy 1950 - 2050
Location C 1 B/R Bridge, River bank
Stilling well C 1 Y/N stilling well available
Diameter of stilling well N 2+2 m
Diameter of intake pipes N 3 mm
Check gauge inside C 1 Y/N check gauge in stilling well?
Check gauge outside C 1 Y/N check gauge outside stilling well?
Gauge zero N 4+2 m 0 - 5000.00 w.r.t MSL
Minimum level N 2+2 m -30.0 - 30.0
Maximum level N 2+2 m -30.0 - 99.99
Type of recording C 1 A/D Analogue, Digital
Sampling interval N 2 hr 0 - 24
Current Meter Measurements
Start Date N 8 yyyymmdd 19500101-20491231
Closure Date N 8 yyyymmdd 19500101-20491231
Type of meter C 1 C/P/O C = cup, P = propeller, o = other
Make C 20
Year of manufacture N 4 yyyy 1950 - 2050
Sampling interval C 20 statement
Flow Measurements by Floats
10. 15 October, 2002
5
Start Date N 8 yyyymmdd 19000101-20491231
Closure Date N 8 yyyymmdd 19000101-20491231
Type of float C 1 S/U/D/R S=surface, U=subsurface, D=double, R =rod
Make C 20
Suspended Sediment Observations
Start Date N 8 yyyymmdd 19500101-20491231
Closure Date N 8 yyyymmdd 19500101-20491231
Type of equipment C 1
Make C 20
Sampling interval C 20 statement
Year of manufacture N 4 yyyy 1950 - 2050
Bed Sediment Observations
Start Date N 8 yyyymmdd 19500101-20491231
Closure Date N 8 yyyymmdd 19500101-20491231
Type of equipment C 1
Make C 20
Year of manufacture N 4 yyyy 1950 - 2050
Sampling interval C 20 statement
Water Quality Measurements
Start Date N 8 yyyymmdd 19500101-20491231
Closure Date N 8 yyyymmdd 19500101-20491231
Make C 20
Year of manufacture N 4 yyyy 1950 - 2050
Sampling interval C 20 statement
no. of parm. sampled N 3 number of parameters sampled
Parm. Sampled name C(d) 20 parameters being sampled
Parm. Sampled ID C(d) 10 parameters being sampled
Parm. Sampled at Site C(d) Y/N
SRG
Start Date N 8 yyyymmdd 19500101-20491231
Closure Date N 8 yyyymmdd 19500101-20491231
Pocket Revgister C 1 P/F p=pocket register, f=form
Make of equipment C 20
Year of manufacture N 4 yyyy 1950 - 2050
Sampling Interval C 20 statement
ARG
Start Date N 8 yyyymmdd 19000101-20491231
Closure Date N 8 yyyymmdd 19000101-20491231
11. 15 October, 2002
6
Make of equipment C 20
Year of manufacture N 4 yyyy 1950 - 2050
Mode of data logging C 1 A/D A=analog, D=digital
Sampling Interval C 20 statement
Temperature
Manual Observations C 1 Y/N
Min. / Max. C 1 Y/N
Pocket Revgister C 1 P/F p=pocket register, f=form
Sampling Interval C 20 statement
Thermograph C 1 Y/N
Make of equipment C 20
Year of manufacture N 4 yyyy 1950 - 2050
Mode of data logging C 1 A/D A=analog, D=digital
Sampling Interval C 20 statement
Wind Run
Make of equipment C 20
Year of manufacture N 4 yyyy 1950 - 2050
Pocket Revgister C 1 P/F p=pocket register, f=form
Sampling Interval C 20 statement
Wind Speed
Make of Equipment C 20
Year of Manufacture N 4 yyyy 1950 - 2050
Pocket Revgister C 1 P/F p=pocket register, f=form
Sampling Interval C 20 statement
Humidity
Dry & Wet Bulb C 1 Y/N
Pocket Revgister C 1 P/F p=pocket register, f=form
Sampling Interval
Hygrograph
Make of equipment C 20
Year of manufacture N 4 yyyy 1950 - 2050
Mode of data logging C 1 A/D A=analog, D=digital
Sampling Interval C 20 statement
Evaporation
Make of equipment C 20
Year of manufacture N 4 yyyy 1950 - 2050
Dia. of Evaporimeter N 4 mm 400 - 2000
Pocket Revgister C 1 P/F p=pocket register, f=form
12. 15 October, 2002
7
Sampling Interval C 20 statement
Radiation
Sunshine Recorder C 1 Y/N
Make of equipment C 20
Year of manufacture N 4 yyyy 1950 - 2050
S S Globe dia. N 3 mm
Mode of Data logging C 1 A/D A=analog, D=digital
Sampling Interval C 20 statement
Other Instrument C 1 Y/N
Make C 20 specify any other instrument in use
Sampling Interval C 20 statement
Equidistant time series data
Name Type Length Units Range Description
State ID C 10 table
Agency ID C 10 table
Station ID C 10 al. num. station id
Station type C 10 al. num. station type
Variable/parm ID C 2(d) varying alpha num. many parameters at a station
Type C 1(d) I/A Instantaneous, Accumulative
Time interval unit N 1(d) 1/2/3/4 1-year,2-month,3-day,4-hour
Divider N 2(d) 1-99 elements per time unit
Basic time interval N 1(d) 1/2/3/4 2-month,3-day,4-hour,5-minute
Multiplier N 2(d) 1-99 elements per time unit
Start Date N 12(d) yyyymmddh
hsi
1850 - 2050
End Date N 12(d) yyyymmddh
hsi
1850 - 2050
Missing value N 6+3(d) varying varying for each
Minimum N 6+3(d) varying varying likely minimum value
Maximum N 6+3(d) varying varying likely maximum value
Rise N 6+3(d) varying varying likely maximum rate of rise
Fall N 6+3(d) varying varying likely maximum rate of fall
Values N 6+3(d) varying varying value of the variable
13. 15 October, 2002
8
Non-Equidistant time series data
Name Type Length Units Range Description
State ID C 10 table
Agency ID C 10 table
Station ID C 10 al. num. station id
Station type C 10 al. num. station type
Variable/parm ID C 2 varying alpha num.
Type C 1 I/A Instantaneous, Accumulative
Start Date N 12 yyyymmdd
hhsi
1850 - 2050
End Date N 12 yyyymmdd
hhsi
1850 - 2050
Missing value N 6+3 varying varying
Minimum N 6+3 varying varying likely minimum value
Maximum N 6+3 varying varying likely maximum value
Time lable N 12(d) yyyymmdd
hhsi
1850 - 2050
Values N 6+3(d) varying varying value of the variable
Stage-Discharge data
Name Type Length Unit Range Description
State ID C 10 table
Agency ID C 10 table
Station ID C 10 al. num. station id
Station type C 10 al. num. station type
Date N 8 yyyymmdd
Number N 3 0 - 400
Gauge zero N 4+3 m+MSL
Water level N 4+3 m
Discharge N 6+2(S) m3
/s
Energy slope N 1+5(E)
Gradient N 1+5(E) m/hr
14. 15 October, 2002
9
Fall N 2+2 m
Flow width N 4+1 m
Wetted perimeter N 4+1 m
Wetted cross-section N 6+1 m2
Average velocity N 2+3 m/s
Hydraulic radius N 2+4 m
Manning's n N 1+5(E) - 0.00001 - 0.1
Stage-Discharge relations
Name Type Length Unit Range Description
State ID C 10
Agency ID C 10
Station ID C 10
Station Type C 10
Start date N 8(d) yyyymmdd start validity period of rating equation
End date N 8(d) yyyymmdd end of validity period of rating equation
Type of rating curve C 1 S/U/B S=simple, U=unsteady, B=backwater
Simple rating
Number of intervals N 1 for each validity period
Lower boundary N 4+3 m for each interval
Upper boundary N 4+3 m for each interval
coeff a N 2+4(e) for each interval
coeff b N 2+4(e) for each interval
coeff c N 2+4(e) for each interval
Backwater (constant)
Constant fall N 2+3 m Value of constant fall
Power N 2+3 exponent in backwater correction
Backwater (normal)
Lower boundary N 4+3 m lower boundary for backwater correction
Power N 1+4(e) exponent in backwater correction
coeff a N 2+4(e) parameters for relation {f = f(h)}
coeff b N 2+4(e) parameters for relation {f = f(h)}
coeff c N 2+4(e) parameters for relation {f = f(h)}
Unsteady flow
15. 15 October, 2002
10
Lower boundary N 4+3 m lower limit for unsteady flow correction
Upper boundary N 4+3 m Upper limit for unsteady flow correction
coeff a N 2+4(e) parameter for relation {1/vS = f(h)}
coeff b N 2+4(e) parameter for relation {1/vS = f(h)}
coeff c N 2+4(e) parameter for relation {1/vS = f(h)}
Sediment relations
Name Type Length Unit Range Description
State ID C 10 table
Agency ID C 10 table
Station ID C 10 al. num. station id
Station type C 10 al. num. station type
Date N 8 yyyymmdd
No. of Relations N 3
Validity Start date N 8 yyyymmdd start validity period of rating equation
Validity End date N 8 yyyymmdd end of validity period of rating equation
Number of intervals N 1 segments in rating curve for each period
Lower boundary N 6 m for each interval
Upper boundary N 6 m for each interval
coeff a N 6 for each interval
coeff b N 6 for each interval
coeff c N 6 for each interval
16. 15 October, 2002 1
Water Quality Tables
Water Quality - level 1
Name Type Length Units Range Description
State ID C 10
Agency ID C 10
Well /Station ID C 8
Well /Station type C 8
Date of sample N 12 yyyymmddhhm
m
date and time of collection
Lab ID C 10 identity of laboratory
Sample ID C 10 sample sequence number
Date of test N 8 yyyymmdd date of lab test
Colour N 3+0 0-100 water color
Temperature N 5 dddnn water temperature Celsius
Odour N 2+0 0-10 odour
Osat N 3+0 % 0-100 oxigen saturation percentage
pH N 2+1 -log (H+) water acidic value
EC N 3+0 mS/m 0-1000 electrical conductivity
DO N 2+1 mg/l 0-20 dissolved oxygen
Water Quality - level 2 (additional to level 1)
Name Type Length Units Range Description
State ID C 10
Agency ID C 10
Well /Station ID C 8
Well /Station type C 8
Date of sample N 8 yyyymmdd date of collection
Time of sample N 4 hhmm time of collection (hour,minute)
Lab ID C 10 identity of laboratory
Sample ID C 10 sample sequence number
Date analysis N 8 yyyymmdd date of lab test
SS N 3+1 mg/l 0-1000 suspended solids
DS N 3+1 mg/l 0-1000 dissolved solids
TS N 3+1 mg/l 0-1000 total solids
Turb N 3+2 NTU 0-100 turbidity
Alk-phen N 4+1 mg/l CaCO3 0-5000 alkalinity up to phenolphthalein (pH)
Alk-tot N 4+1 mg/l CaCO3 0-5000 alkalinity up to methyl red (pH 4.3)
CO3 N 3+3 mg/l 0-1000 carbonate
HCO3 N 3+3 mg/l 0-1000 bicarbonate
Cl N 5+0 mg/l 0-20000 chloride
SO4 N 4+0 mg/l 0-3000 sulfate
Ca N 3+1 mg/l 0-1000 calcium
Mg N 3+1 mg/l 0-1000 magnesium
TH N 3+1 mg/l CaCO3 0-1000 total hardness
Na N 4+0 mg/l 0-2000 sodium
17. 15 October, 2002 2
K N 3+1 mg/l 0-1000 potassium
NO2-N N 1+3 mg/l 0-1 nitrite nitrogen
NO3-N N 3+1 mg/l 0-1000 nitrate nitrogen
NH4-N N 3+2 mg/l 0-1000 ammonium nitrogen
KjelN N 3+1 mg/l 0-1000 kjeldahl nitrogen
oPO4-P N 3+2 mg/l 0-100 ortho phosphate
P-tot N 3+2 mg/l 0-100 total phosphorus
Chlf-a N 3+1 mg/l 0-1000 chlorophyll-a
BOD3-27 N 3+1 mg/l 0-1000 biochemical oxygen demand
COD N 3+1 mg/l 0-1000 chemical oxygen demand
Ecoli MPN N 8+0 MPN/100ml 0-
9E+07
E coliform bacteria
Tcoli MPN N 8+0 MPN/100ml 0-
9E+07
total coliforms
Tcoli mem N 8+0 MPN/100ml 0-
9E+07
total coliforms(mem)
Fcoli MPN N 8+0 MPN/100ml 0-
9E+07
fecal coliforms
Fcoli mem N 8+0 MPN/100ml 0-
9E+07
fecal coliforms(mem)
B N 1+2 mg/l 0-9 boron
F N 3+3 mg/l 0-1000 fluoride
AL N 3+2 mg/l 0-100 aluminium
Fe N 3+1 mg/l 0-1000 iron
Mn N 3+2 mg/l 0-100 manganese
SiO2 N 3+1 mg/l 0-1000 silica
Water Quality - level 2+(additional to level 2)
Name Typ
e
Length Units Range Description
State ID C 10
Agency ID C 10
Well /Station ID C 8
Well /Station type C 8
Date of sample N 8 yyyymmdd
Lab ID C 10 identity of laboratory
Sample ID C 10 sample sequence number
Date of test N 8 yyyymmdd date of lab test
Ag N 1+3 mg/l 0-1 silver
As N 1+3 mg/l 0-1 arsenic
Ba N 3+3 mg/l 0-1000 barium
Cd N 1+3 mg/l 0-1 cadmium
Cr N 1+3 mg/l 0-1 chromium
Cu N 1+3 mg/l 0-1 copper
Co N 1+3 mg/l 0-1 cobalt
Hg N 1+3 mg/l 0-1 mercury
Ni N 1+3 mg/l 0-1 nickel
Se N 3+3 mg/l 0-1000 selenium
Pb N 1+3 mg/l 0-1 lead
18. 15 October, 2002 3
V N 3+3 mg/l 0-1000 vanadium
Zn N 1+3 mg/l 0-1 zinc
CN N 3+3 mg/l 0-1000 cyanide
det N 3+2 mg/l 0-1000 detergents (SAAM-lai)
min oil N 3+3 mg/l 0-1000 mineral oil
Water Quality - level 3 (additional to level 2+)
Name Typ
e
Length Units Range Description
State ID C 10
Agency ID C 10
Well /Station ID C 8
Well /Station type C 8
Date of sample N 8 yyyymmdd
Lab ID C 10 identity of laboratory
Sample ID C 10 sample sequence number
Date of test N 8 yyyymmdd date of lab test
PAH N 1+3 mg/l 0-1 poly aromatic hydrocarbon
PCB N 1+3 mg/l 0-1 poly chlorinated biphenyls
pest N 1+3 mg/l 0-1 pestices
phen N 1+3 mg/l 0-1 phenolic compounds
VOX N 1+3 mg/l 0-1 volatils haloginated hydrocarbons
Water Quality - level X
Name Type Length Units Range Description
State ID C 10
Agency ID C 10
Well /Station ID C 8
Well /Station type C 8
Date of sample N 8 yyyymmdd
Lab ID C 10 identity of laboratory
Sample ID C 10 sample sequence number
Date of test N 8 yyyymmdd date of lab test
Abs N 3+3 mg/l 0-1000 alkyl benzene sulfanate
BOD5-20 N 3+1 mg/l 0-1000 biochemical oxygen demand (5 days,
20 deg)
CO2 N 3+3 mg/l 0-1000 free carbon dioxide
DOC N 3+1 mg/l 0-1000 Dissolved organic carbon
FStrc N 5+0 mpn/100ml 0-
1E+05
feacal streptococci
Grease N 3+1 mg/l 0-100 grease
N-tot N 3+3 mg/l 0-1000 total nitrogen
Org-N N 3+3 mg/l 0-1000 organic nitrogen
Org-P N 3+3 mg/l 0-1000 organic phosphorous
POC N 3+3 mg/l 0-1000 particulate organic carbon
S N 0+2 mg/l 0-0.05 selinity (hardness)
TOC N 3+3 mg/l 0-1000 total organic carbone
TVS N 3+0 mg/l 0-1000 total volatile solids
19. 15 October, 2002 4
TotOil N 3+3 mg/l 0-1000 total oil
Lab Data
Name Type Length Units Range Description
State ID C 10
Agency ID C 10
Lab ID C 10 identity of laboratory
Lab Name C 20
Lab Address C 50
Telephone No N 10 telephone number (including town)
Lab Type C 20 analysis made in laboratory
Sample Details
Name Type Length Units Range Description
Sample ID C 10
Agency ID C 10
Date Collection N 12 yyyymmddhh
mm
date and time of collection
Type C 10 code type of sample
Medium C 10 code for medium sampled
Matrix C 10 code for matrix sampled
Method C 10 code for sampling method
Depth N 6 location
Treatment C 10 code for treatment of sample after
collection
Preservation C 10 code for preservation of sample
Project C 10 code of the project under which
sampled
Collector C 20 collector’s name
Parameter Data
Name Type Length Unit Range Description
Param_Id C 10
Name C 30
Cat1 C 1 C/P/B Chemical, physical, biological
Cat2 C 1 S/M/H/O salts, metals, heavy metals, organics
Unit C 10 reporting unit
Min N 10 minimum value
Max N 10 maximum value
Decimal N 1 number of decimals
Hp-Level I/ II/ II+/
III
analysis level under HP
Remarks C 50
20. 15 October, 2002 5
Analysis Method
Name Type Length Units Range Description
Parm ID C 10
Analysis C 20 method of analysis
Type C 1 P/S P-directly measured,S-calculated from
primary parameters
Accuracy C 10 estimated accuracy (%) of reported
value or absolute range in reporting
units
Detect limit C 10 detection limit, below this value,
report as d.l.
Work range C 10 range in which the analytical method
works
Report range C 10 allowed reporting range (after
calculation from the work range
Reference C 50 reference to the method (standard
method mostly)
Lab Analysis
Name Type Length Units Range Description
Lab-Anal ID C 10 lab analysis ID
Analysis C 20 method of analysis
Lab ID C 10 lab ID
Sample ID C 10 sample ID
Value N 10 measured value
Date Received N 8 yyyymmdd
Date analyzed N 8 yyyymmdd
Filtration C 10 code of filtration method
Digestion C 10 code of digestion method
Project C 10 project under which this analysis was
carried out
Analyst C 20 name of analyst
Approval Analyst C 1 Y/N approved by analyst
Approval Chief C 1 Y/N approved by chief chemist