
Recommended
Recommended
More Related Content
Similar to C3 Took KitTool Kit for Analysis of Financial Statements Financial.docx
Similar to C3 Took KitTool Kit for Analysis of Financial Statements Financial.docx (20)
More from humphrieskalyn
More from humphrieskalyn (20)
Recently uploaded
Recently uploaded (20)
C3 Took KitTool Kit for Analysis of Financial Statements Financial.docx
- 1. C3 Took KitTool Kit for Analysis of Financial Statements Financial statements are analyzed by calculating certain key ratios and then comparing them with the ratios of other firms and by examining the trends in ratios over time. We can also combine ratios to make the analysis more revealing, those indicated below are exceptionally useful for this type of analysis. RATIO ANALYSIS (Section 3.1)Input Data:20102009Year-end common stock price$23.00$26.00Year- end shares outstanding (in millions)5050Tax rate40%40%After- tax cost of capital11.0%10.8%Lease payments$28$28Required sinking fund payments$20$20Balance Sheets(in millions of dollars)Assets20102009Cash and equivalents$10$15Short-term investments$0$65Accounts receivable$375$315Inventories$615$415 Total current assets$1,000$810Net plant and equipment$1,000$870Total assets$2,000$1,680Liabilities and equityAccounts payable$60$30Notes payable$110$60Accruals$140$130 Total current liabilities$310$220Long-term bonds$754$580 Total liabilities$1,064$800Preferred stock (400,000 shares)$40$40Common stock (50,000,000 shares)$130$130Retained earnings$766$710Total common equity$896$840Total liabilities and equity$2,000$1,680Income Statements(in millions of dollars)20102009Net sales$3,000.0$2,850.0 Operating costs$2,616.2$2,497.0Earnings before interest, taxes, depr. & amort. (EBITDA)$383.8$353.0 Depreciation$100.0$90.0 Amortization$0.0$0.0 Depreciation and amortization$100.0$90.0Earnings before interest and taxes (EBIT)$283.8$263.0 Less interest $88.0$60.0Earnings before taxes (EBT)$195.8$203.0 Taxes (40%)$78.3$81.2Net income before preferred dividends$117.5$121.8 Preferred dividends$4.0$4.0Net income available to common stockholders$113.5$117.8Common dividends$57.5$53.0Addition to retained
- 2. earnings$56.0$64.8Calculated Data: Operating Performance and Cash Flows20102009Net operating working capital (NOWC)$800.0$585.0Total operating capital$1,800.0$1,455.0Net Operating Profit After Taxes (NOPAT)$170.3$157.8Net Cash Flow (Net income + Depreciation)$213.5$207.8Operating Cash Flow (OCF)$270.3$247.8Free Cash Flow (FCF)($174.7)N/ACalculated Data: Per-share Information20102009Earnings per share (EPS)$2.27$2.36Dividends per share (DPS)$1.15$1.06Book value per share (BVPS)$17.92$16.80Cash flow per share (CFPS)$4.27$4.16Free cash flow per share (FCFPS)($3.49)N/ALIQUIDITY RATIOS (Section 3.2)Industry20102009AverageLiquidity ratios Current Ratio3.233.684.2 Quick Ratio1.241.802.1ASSET MANAGEMENT RATIOS (Section 3.3)Industry20102009AverageAsset Management ratios Inventory Turnover4.886.879 Days Sales Outstanding45.640.34 Christopher Buzzard: To calculate the DSO ratio, a 365-day accounting year was used.36 Fixed Asset Turnover3.003.283 Total Asset Turnover1.501.701.8DEBT MANAGEMENT RATIOS (Section 3.4)Industry20102009AverageDebt Management ratios Debt Ratio53.20%47.62%40.00% Debt-to- Equity Ratio1.140.910.67 Market Debt Ratio48.06%38.10%N/A Times Interest Earned3.234.386 EBITDA Coverage Ratio3.03 Brigham: (EBITDA + Lease Payments) / (Interest + Loan Payments + Lease Payments) 3.538PROFITABILITY RATIOS (Section 3.5)Industry20102009AverageProfitability ratios Profit Margin3.78%4.13%5.00% Basic Earning Power14.19%15.65%17.20% Return on Assets5.67%7.01%9.00% Return on Equity12.67%14.02%15.00%MARKET VALUE RATIOS (Section 3.6)Industry20102009AverageMarket Value ratios
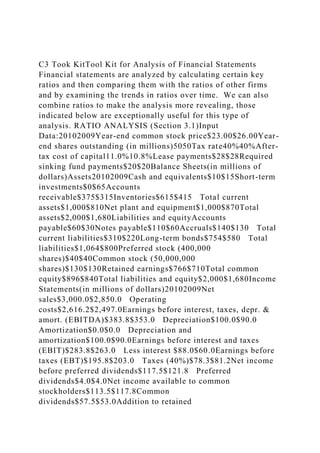
- 3. Price-to Earnings Ratio10.1311.0412.5 Price-to-Cash Flow Ratio5.396.26 Christopher Buzzard: P/CF ratio is calculated by dividing the price by the net cash flow per share. Brigham: (EBITDA + Lease Payments) / (Interest + Loan Payments + Lease Payments) Christopher Buzzard: To calculate the DSO ratio, a 365-day accounting year was used.6.8 Price-to-EBITDA3.003.684.6 Market-to-Book Ratio1.281.551.7TREND ANALYSIS, COMMON SIZE ANALYSIS, AND PERCENT CHANGE ANALYSIS (Section 3.7)TREND ANALYSISTrend analysis allows you to see how a firm's results are changing over time. For instance, a firm's ROE may be slightly below the benchmark, but if it has been steadily rising over the past four years, that should be seen as a good sign.A trend analysis and graph have been constructed on this data regarding MicroDrive's ROE over the past 5 years. (MicroDrive and indusry average data for earlier years has been provided.)ROEMicroDriveIndustry200614.0%13.2%200716.1% 15.0%200814.8%16.0%200914.0%16.2%201012.7%15.0%Figur e 3-1 Rate of Return on Common EquityCOMMON SIZE ANALYSISIn common size income statements, all items for a year are divided by the sales for that year.Figure 3-2 Common Size Income StatementsIndustry CompositeMicroDrive201020102009Net sales100.0%100.0%100.0% Operating costs87.6%87.2%87.6%Earnings before interest, taxes, depr. & amort. (EBITDA)12.4%12.8%12.4% Depreciation and amortization2.8%3.3%3.2%Earnings before interest and taxes (EBIT)9.6%9.5%9.2% Less interest 1.3%2.9%2.1%Earnings before taxes (EBT)8.3%6.5%7.1% Taxes (40%)3.3%2.6%2.8%Net income before preferred
- 4. dividends5.0%3.9%4.3% Preferred dividends0.0%0.1%0.1%Net income available to common stockholders (profit margin)5.0%3.8%4.1%In common sheets, all items for a year are divided by the total assets for that year.Figure 3-3 Common Size Balance SheetsIndustry CompositeMicroDrive201020102009AssetsCash and equivalents1.0%0.5%0.9%Short-term investments2.2%0.0%3.9%Accounts receivable17.8%18.8%18.8%Inventories19.8%30.8%24.7% Total current assets40.8%50.0%48.2%Net plant and equipment59.2%50.0%51.8%Total assets100.0%100.0%100.0%Liabilities and equityAccounts payable1.8%3.0%1.8%Notes payable4.4%5.5%3.6%Accruals3.6%7.0%7.7% Total current liabilities9.8%15.5%13.1%Long-term bonds30.2%37.7%34.5% Total liabilities40.0%53.2%47.6%Preferred stock0.0%2.0%2.4%Total common equity60.0%44.8%50.0%Total liabilities and equity100.0%100.0%100.0%PERCENT CHANGE ANALYSISIn percent change analysis, all items are divided by the that item's value in the beginning, or base, year.Figure 3-4 Income Statement Percent Change AnalysisBase year =2009Percent Change in2010Net sales5.3% Operating costs4.8%Earnings before interest, taxes, depr. & amort. (EBITDA)8.7% Depreciation and amortization11.1%Earnings before interest and taxes (EBIT)7.9% Less interest 46.7%Earnings before taxes (EBT)(3.5%) Taxes (40%)(3.5%)Net income before preferred dividends(3.5%) Preferred dividends0.0%Net income available to common stockholders(3.7%)Balance Sheet Percent Change Analysis (not in textbook)Base year =2009Percent Change in2010AssetsCash and equivalents-33.3%Short-term investments-100.0%Accounts receivable19.0%Inventories48.2% Total current assets23.5%Net plant and equipment14.9%Total assets19.0%Liabilities and equityAccounts payable100.0%Notes payable83.3%Accruals7.7% Total current liabilities40.9%Long-term bonds30.0% Total
- 5. liabilities33.0%Preferred stock (400,000 shares)0.0%Common stock (50,000,000 shares)0.0%Retained earnings7.9%Total common equity6.7%Total liabilities and equity19.0%DU PONT ANALYSIS (Section 3.8) ROE =(Profit margin)(TA turnover)(Equity Multiplier)MicroDrive201012.67%3.78%1.502.23MicroDrive 200914.02%4.13%1.702.00Industry Average15.00%5.00%1.801.67 MicroDrive 2006 2007 2008 2009 2010 0.14000000000000001 0.161 0.14800000000000002 0.14023809523809525 0.12665178571428584 Industry 2006 2007 2008 2009 2010 0.13200000000000001 0.15 0.16 0.16200000000000001 0.15 ROE (%) Assignment 1: Demand Estimation Chris Czeiszperger Dr. Guerman V. Kornilov Managerial Economics and Globalization January 26, 2014
- 6. Imagine that you work for the maker of a leading brand of low- calorie microwavable food that estimates the following demand equation for its product using data from 26 supermarkets around the country for the month of April. QD = 20,000 - 10P + 1500A + 5PX + 10 I (5,234) (2.29) (525) (1.75) (1.5) R2 = 0.85 n = 120 F = 35.25 Your supervisor has asked you to compute the elasticities for each independent variable, (P, A, PX, and I), in the equation. Assume the following values for the independent variables: Q D = Quantity demanded P (in cents) per case = Price of the product = 8000 PX (in cents) = Price of leading competitor’s product = 9000 I (in dollars) = Per capita income of the standard metropolitan statistical area (SMSA) where the supermarkets are located = 5000 A (in dollars) = Monthly advertising expenditures = 64 1. Compute the elasticity for each independent variable. Note: Write down all of your calculations. When P = 8000, A = 64,PX = 9000, I = 5000, using regression equation, QD= 20000 - 10*8000 + 1500*64 + 5*9000 + 10*5000 = 131,000 Price elasticity = (P/Q)*(dQ/dP) From regression equation, dQ/dP = -10. So, price elasticity EP= (P/Q) * (-10) = (-10) * (8000 / 131000)
- 7. = -0.61 Similarly, EA = 1500 * 64 / 131000 = 0.73 EPX = 5 * 9000 / 131000 = 0.34 EI = 10* 5000 / 131000 = 0.38 2.Determine the implications for each of the computed elasticities for the business in terms of short-term and long-term pricing strategies. Provide a rationale in which you cite your results. Price elasticity is -0.61 which means a 1% increase in price of the product causes quantity demanded to drop by 0.61%. So, the demand of the product is relatively inelastic. Therefore, increase in price may not have large impact on the customers. Advertisement elasticity is 0.73, meaning 1% increase in advertising expenses increases quantity demanded by only 0.73%. So, demand is relatively inelastic to advertising. Therefore, more advertisement won’t necessarily mean that firm can raise the price because it still could drive customers away. Cross-price elasticity is 0.34 which means if price of competitor product increases by 1%, then quantity demanded of this product increases by 0.34%. So, product is relatively inelastic to competitor’s price and the firm shouldn’t worry about the competitor as their pricing won’t have any major effect on its own sales. Income-elasticity is 0.38 which means 1% rise in average income in the area boosts quantity demanded by 0.38%. So, product is relatively inelastic in this aspect and so the firm shouldn’t worry about consumer income considerations in pricing strategy. Quantity demanded won’t suffer largely from this aspect even if income increases / decreases. Therefore, quantity demanded is relatively inelastic to all factors considered. So, company shouldn’t worry much about these factors. 3.Recommend whether you believe that this firm should or
- 8. should not cut its price to increase its market share. Provide support for your recommendation. A price slash would increase quantity demanded, as the price elasticity is negative. But, magnitude of elasticity is a less than unity. Revenue is maximized when the magnitude of elasticity is one. Therefore, a price-cut will increase quantity demanded but will lead to a loss of sales. So, price-cut should be made only if firm is trying to strengthen its consumer base; from profit perspective, it should instead raise the price. 4.Assume that all the factors affecting demand in this model remain the same, but that the price has changed. Further assume that the price changes are 100, 200, 300, 400, 500, 600 cents. 1.Plot the demand curve for the firm. Keeping other factors constant, demand equation is Q = 20000 - 10*8000 + 1500*64 + 5*9000 + 10*5000 Q = 211000 - 10P P = 21100 - 0.1Q (plotted below) 2.Plot the corresponding supply curve on the same graph using the supply function Q = 5200 + 45P with the same prices. Q = 5200 + 45P P = -5200/45 + Q/45 3.Determine the equilibrium price and quantity. Solving demand and supply equation simultaneously, 211000 - 10P= 5200 + 45P 55P = 211000 - 5200 P = 3741.82 and Q = 5200 + 45*3741.82 = 173,581 So, equilibrium price is 3742 cents and equilibrium quantity is 173,581 units. The equilibrium price and quantity can also be found from the graph to be the point where supply and demand curve intersect.
- 9. 4.Outline the significant factors that could cause changes in supply and demand for the product. Determine the primary manner in which both the short-term and the long-term changes in market conditions could impact the demand for, and the supply, of the product. As the demand equation points out, demand of the low-calorie food can change due to a change in consumer income, price of competitor product and price of related goods (microwave oven). The change can also come as a result of change in consumer preference (like awareness towards low-calorie food). Supply of the product can change due to change in number of suppliers of the product, technological advances in the production and other factors like change in availability of labor and raw-material which directly affect production costs. 5.Indicate the crucial factors that could cause rightward shifts and leftward shifts of the demand and supply curves. A rightward shift of demand curve could be caused by an increase in consumer income, a decrease in price of complementary product like microwave ovens, an increase in population or increased preference for the product like awareness towards low-calorie food. A leftward shift of demand curve can be caused by a drop in consumer income or recession, increase in price of complementary product like microwave oven etc. A rightward shift of supply curve can be caused by technology advances in food processing, increased availability of cheap labor and raw material, increased tax-cuts and government subsidies etc. A leftward shift can be caused due to a decrease in availability / increase in price of labor and raw materials, increased taxes etc. Demand 210000 205000 200000 195000 190000 173581.8 168581.8 163581.79999999999 158581.79999999999 153581.79999999999
- 10. 148581.79999999999 100 600 1100 1600 2100 3741.82 4241.8200000000024 4741.8200000000024 5241.8200000000024 5741.8200000000024 6241.8200000000024 Supply 210000 205000 200000 195000 190000 173581.8 168581.8 163581.79999999999 158581.79999999999 153581.79999999999 148581.79999999999 4551.111111111115 4440 4328.8888888888887 4217.7777777777765 4106.6666666666761 3741.8177777777796 3630.7066666666633 3519.595555555557 3408.4844444444443 3297.373333333338 3186.2622222222217 Q P Running head: OPERATIONS DECISION 1 OPERATIONS DECISION 9 Operations Decision Chris Czeiszperger Professor Kornilov Managerial Economics and Globalization February 14, 2014 There are many options of foods with low-calorie in the market. With the rise in income people can now use microwaves to cook instead of traditional cooking methods. The rise of microwaves
- 11. has led to rise in food items. Having a variety of products available one can target on healthy choices of microwavable foods. For a type of food to be considered health it should contain sources of proteins, 600 milligrams of sodium and 3 grams of fiber for satiety purposes. Manufacturers of these options include Lean Cuisine and Healthy Choice. Both of these companies are competitors in frozen food markets. Lean Cuisine started in the year 1981 under the ownership of Nestle and has expanded its markets in Canada, US, and Australia and it offers variety of frozen foods and a leading choice for low-calorie s. Healthy Choice is another choice for low-calorie foods the product produced by ConAgra. Healthy Choice are the biggest opponents of Lean Cuisine (Schlosser). These two companies have two strategies for pricing which are penetration pricing and skimming pricing. A penetration pricing is involved with low initial prices to encourage a large number of customers to try the product. The companies’ hopes are to sell large volumes in order to generate high revenues. New varieties of food stuffs are often introduced at low opening prices. A company does not utilize a high strategy for such products. This initial low price of the product is often combined with samples, advertising, coupons and other special incentives in order to increase awareness of the product and customers to try it. Companies start to make profits when more units start to be sold. The company can also experience profits when there is expansion of product distribution that lead to increase in profits. The pricing strategy which involves setting high initial prices for food products to get back the investment spend on the product is called skimming pricing strategy. This market involves customers who are not price sensitive or those that adapted with the product long time ago. For a company to gain enormous profits, then its product must have been accepted in the market place. The profitability stage of a company is characterized by higher profits which attracts more competitors who enter the market very quickly. A
- 12. company must ensure the availability of its product whenever a customer needs it otherwise it will lose the customer to its competitors. The best plan to assess the effectiveness of the company’s performance include laying down the companies goals which are to make the maximum profits while incurring the low costs, also ensuring that the frozen food products are available to consumer whenever the consumer needs them. Also for an effective business, a company should determine the company’s challenges and opportunities so as to make the best profits. The companies also should clearly identify their target market and ensure that their products reach the intended consumers and also be prepared for the competitions that they may face in the market. Effective companies and marketing plans are very detailed, anticipating and satisfying the consumer’s needs. For a company’s market structure to change there must have occurred an outlawed activity like the tying of consumers where a customer is required to buy goods they do not want in order to acquire the goods they want. This leads to a company losing customers therefore the strategy of many buyers and many sellers becomes unbalanced therefore a business opting to change their market structure. A company can also change its market structure when there occurs interlocking directorates. This is where we have same individuals serving on board of directors of competing companies. This leads to the two companies producing similar products and therefore changing the market structure of a company. There may be a change of market structure when we have price discrimination where some customers are served with different prices with other customers. This majorly leads to dissatisfaction of customers and therefore customer opting for either substitutes or going for the products from another company. The effect of the company changing their market structure if so defined and it may lead to a company losing a very portion of their profits and therefore incurring big loses. Also it is clear that a change in market structure can lead to a company losing many of its consumers
- 13. due to dissatisfaction. The reaction of the firm’s negative economic profit will depend on the time horizon. The firm does not have an option of departing the production industry. In the short run the company is stuck with its costs and its factors of production. The company has two options either to stay or close down. If the company decides to stay open it will make the profit even if it is a negative profit. If the company shuts down it will lose an amount equal to its fixed costs because shutting down both revenue both their revenue and their variable costs disappear but fixed costs remain. The company’s short run decision to produce or not decision is based on where it loses a lot of money. If the negative economic profits of the quantity are less than the negative economic profits of losing fixed costs the firm will remain open. In the long run perfectly competitive companies will not produce at negative economic profit if they can make more money elsewhere and if it is easy to get out of the market. Therefore these companies make zero economic profits in the long run. When other things are not equal, the firm will move from one average total cost to another as it expands its capacity. Eventually, it will reach average total cost curves that exist at the most efficient scale and then the firm will be pushed to the breakeven point on the average total cost curve. A company should discontinue its operation when its sales have decreased to a level where the company cannot get back. The decline in sales may be due to consumer preferences where consumers have preferred low-calorie microwavable food from other companies and this makes the company go into a loss of producing large numbers of products which are no consumed. Technological advances also may lead to decrease in the sales of the company if the company does no utilize it in the advertisement of it products. Proper advertisement of the company’s products ensures the products reach a wide variety of consumers. Also alternative available in the market that satisfy the same needs as the company’s product may lead to the
- 14. company’s making low profits which may lead to closure of the company. The company may also shut down when the operation cost exceeds the returns from the sale of foods from the company. The management should ensure proper management of the company and also involve more in advertising as this helps in capturing more customers and making them aware of the products. The company should prepare for a tuff completion from other companies producing the same products in the market. The rationale for this is to ensure that the company remains running and serving its customers satisfactorily. There are two pricing policies that can be used but the most effective pricing policies is the penetration pricing strategy. This strategy involves using the initial price of the product to encourage the customers to try the product. The aim of the company is to sell large amount of low-calorie microwaveable food (Rodale, 2008). New products are introduced at initial prices. These low prices are always accompanied with advertising, coupons, samples and other special incentives this helps to increase awareness of the product and get the consumers ready to try it and use it. Because of its low initial costs on the product penetration pricing strategy encourages customers to switch to the new product. This means an increase in number of customers for the company and therefore increased returns for the company. The penetration pricing strategy is the most commonly associate with the marketing objectives of increasing market share or the sale volumes. Its lower price on the products when entering the market is a competitive weapon against other companies that produce the same products of low- calorie microwavable foods. Penetration strategy catches the completion off-guard and therefore the competitors do not have time to prepare. It also encourages word of mouth recommendation for the product because of the attractive pricing and makes the company to focus on minimizing unit costs as the business starts. The low prices act as a barrier for other potential competitors to enter into a similar strategy and
- 15. the sales volumes should be high because distribution may be easier to obtain. The financial performance of the company is the measure of how long a company will stay on production. For a company to be able to meet the short-term financial obligations is a very important part to use to maintain operation of the company and for future growth. A large factor determining the short term financial performance of a company is liquidity which is the degree to which a market is willing to buy a particular product. The money market account as a type of asset can be converted into cash within a day or two if not instantly. A building where the company sits is very liquid because it can take a long time before it is sold and make cash out of it. According to the low- calorie microwave company the profits of the sales from freeze foods and the liquidity of the buildings of the company portray the company’s financial performance. The long term financial performance of low-calorie microwave Food Company is generating enough income to sustain the company for a long period of time. When the company is making a long term financial performance it looks for opportunities of making maximum profits. The company does not produce negative economic profits. The evaluation of financial performance requires managerial decisions where a manager should decide on the best decision to take in order to maximize the profits. For a company to improve its profitability and deliver more value to its stakeholders, it should have a customer focused growth strategies where areas that generate the largest proportion of revenue and profits are identified. Customer- focused strategy is based on the company’s existing customers. Another customer-focused strategy is to enter business that have a strong strategic links to the core. Another strategy that a company should take to gain more profits is to focus in executing growth strategies this will include how organized the management is to deliver a high level of value to customers. Also have a management that is performing this will ensure they work hard in making the companies grow. This is the plan to
- 16. implement the above recommendations: 1. The company should work towards minimizing costs. This is done through identifying the steps you could take to minimize on expenditure for example negotiation on you supplier’s prices. 2. The company should be focused on reaching its customers and on attaining maximum profits. 3. Make sure the company is in continuous improvements and the profits should have steady improvements. In conclusion managers should lay down good plans to assess the best market structure that will lead to development of the company. A change of market structure can enormously affect the company’s performance and there the management of the company should be very cautious on the market structure. There occur some circumstances when a company may be forced to shut down. These situations may be either be long term or short term. A success of a company depends also on the pricing policy. Good pricing policy leads to the success of a company through making of maximum profits.
- 17. References Doukidis, G. I. (2004). Social and economic transformation in the digital era. Hershey, PA [u.a.: Idea Group Publ. Harder, F. (2003). Fashion for profit: A professional's complete guide to designing, manufacturing, & marketing a successful line. S.l.: Frances Harder. Mann, M., & Amazon.com (Firm). (2010). Make millions and make change!: Secrets to business and personal success. S.l: MakeMillions.com. Gitman, L. J., & McDaniel, C. D. (2009). The future of business: The essentials. Mason, OH: South-Western Cenage Learning. Schlosser, E. (2012). Fast food nation: The dark side of the all- American meal. Boston: Mariner Books/Houghton Mifflin Harcourt.