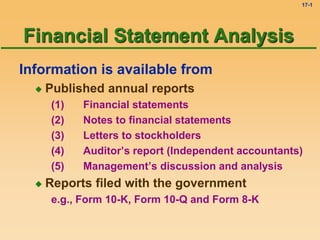
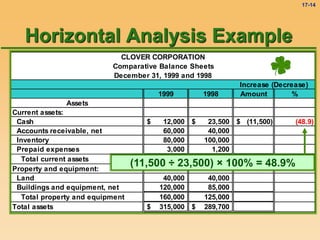
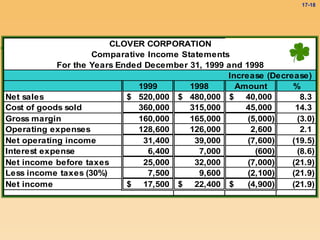
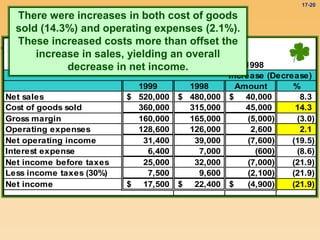
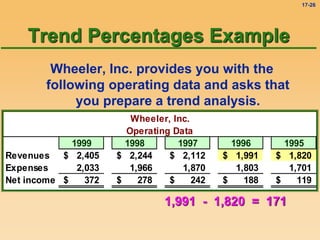
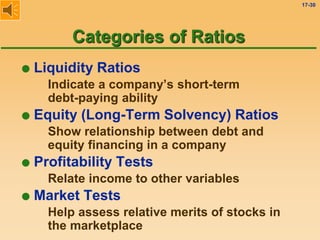
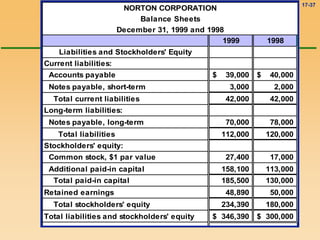
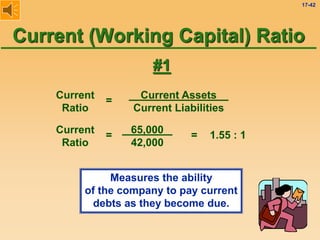
SlideShare a Scribd company logo
1 of 70
17-1
Information is available from
 Published annual reports
(1) Financial statements
(2) Notes to financial statements
(3) Letters to stockholders
(4) Auditor’s report (Independent accountants)
(5) Management’s discussion and analysis
 Reports filed with the government
e.g., Form 10-K, Form 10-Q and Form 8-K
Financial Statement Analysis
17-2
 Horizontal Analysis
 Vertical Analysis
 Common-Size Statements
 Trend Percentages
 Ratio Analysis
Methods of
Financial Statement Analysis
17-3
Horizontal Analysis
Using comparative financial
statements to calculate dollar
or percentage changes in a
financial statement item from
one period to the next
17-4
Vertical Analysis
For a single financial
statement, each item
is expressed as a
percentage of a
significant total,
e.g., all income
statement items are
expressed as a
percentage of sales
17-5
Common-Size Statements
Financial statements that show
only percentages and no
absolute rupees amounts
17-6
Trend Percentages
Show changes over time in
given financial statement items
(can help evaluate financial
information of several years)
17-7
Ratio Analysis
Expression of logical relationships
between items in a financial
statement of a single period
(e.g., percentage relationship
between revenue and net income)
17-8
Horizontal Analysis Example
The management of mis Company provides
you with comparative balance sheets of the
years ended December 31, 1999 and 1998.
Management asks you to prepare a
horizontal analysis on the information.
17-9
Silver CORPORATION
Comparative Balance Sheets
December 31, 1999 and 1998
Incre
1999 1998 Am
Assets
Current assets:
Cash 12,000
$ 23,500
$
Accounts receivable, net 60,000 40,000
Inventory 80,000 1,00,000
Prepaid expenses 3,000 1,200
Total current assets 1,55,000 1,64,700
Property and equipment:
Land 40,000 40,000
Buildings and equipment, net 1,20,000 85,000
Total property and equipment 1,60,000 1,25,000
Total assets 3,15,000
$ 2,89,700
$
17-10
Calculating Change in Rupee Amounts
Rupee
Change
Current Year
Figure
Base Year
Figure
= –
Horizontal Analysis Example
17-11
Calculating Change In Rupee Amounts
Since we are measuring the amount of
the change between 1998 and 1999, the
dollar amounts for 1998 become the
“base” year figures.
Rupee
Change
Current Year
Figure
Base Year
Figure
= –
Horizontal Analysis Example
17-12
Calculating Change as a Percentage
Percentage
Change
Dollar Change
Base Year Figure
100%
= ×
Horizontal Analysis Example
17-13
CLOVER CORPORATION
Comparative Balance Sheets
December 31, 1999 and 1998
Increase (Decrease)
1999 1998 Amount %
Assets
Current assets:
Cash 12,000
$ 23,500
$ (11,500)
$
Accounts receivable, net 60,000 40,000
Inventory 80,000 100,000
Prepaid expenses 3,000 1,200
Total current assets 155,000 164,700
Property and equipment:
Land 40,000 40,000
Buildings and equipment, net 120,000 85,000
Total property and equipment 160,000 125,000
Total assets 315,000
$ 289,700
$
12,000 – 23,500 = (11,500)
Horizontal Analysis Example
17-14
CLOVER CORPORATION
Comparative Balance Sheets
December 31, 1999 and 1998
Increase (Decrease)
1999 1998 Amount %
Assets
Current assets:
Cash 12,000
$ 23,500
$ (11,500)
$ (48.9)
Accounts receivable, net 60,000 40,000
Inventory 80,000 100,000
Prepaid expenses 3,000 1,200
Total current assets 155,000 164,700
Property and equipment:
Land 40,000 40,000
Buildings and equipment, net 120,000 85,000
Total property and equipment 160,000 125,000
Total assets 315,000
$ 289,700
$
(11,500 ÷ 23,500) × 100% = 48.9%
Horizontal Analysis Example
17-15
CLOVER CORPORATION
Comparative Balance Sheets
December 31, 1999 and 1998
Increase (Decrease)
1999 1998 Amount %
Assets
Current assets:
Cash 12,000
$ 23,500
$ (11,500)
$ (48.9)
Accounts receivable, net 60,000 40,000 20,000 50.0
Inventory 80,000 100,000 (20,000) (20.0)
Prepaid expenses 3,000 1,200 1,800 150.0
Total current assets 155,000 164,700 (9,700) (5.9)
Property and equipment:
Land 40,000 40,000 - 0.0
Buildings and equipment, net 120,000 85,000 35,000 41.2
Total property and equipment 160,000 125,000 35,000 28.0
Total assets 315,000
$ 289,700
$ 25,300
$ 8.7
Horizontal Analysis Example
17-16
CLOVER CORPORATION
Comparative Balance Sheets
December 31, 1999 and 1998
Increase (Decrease)
1999 1998 Amount %
Liabilities and Stockholders' Equity
Current liabilities:
Accounts payable 67,000
$ 44,000
$ 23,000
$ 52.3
Notes payable 3,000 6,000 (3,000) (50.0)
Total current liabilities 70,000 50,000 20,000 40.0
Long-term liabilities:
Bonds payable, 8% 75,000 80,000 (5,000) (6.3)
Total liabilities 145,000 130,000 15,000 11.5
Stockholders' equity:
Preferred stock 20,000 20,000 - 0.0
Common stock 60,000 60,000 - 0.0
Additional paid-in capital 10,000 10,000 - 0.0
Total paid-in capital 90,000 90,000 - 0.0
Retained earnings 80,000 69,700 10,300 14.8
Total stockholders' equity 170,000 159,700 10,300 6.4
Total liabilities and stockholders' equity 315,000
$ 289,700
$ 25,300
$ 8.7
17-17
Now, let’s apply the
procedures to the
income statement.
Horizontal Analysis Example
17-18
CLOVER CORPORATION
Comparative Income Statements
For the Years Ended December 31, 1999 and 1998
Increase (Decrease)
1999 1998 Amount %
Net sales 520,000
$ 480,000
$ 40,000
$ 8.3
Cost of goods sold 360,000 315,000 45,000 14.3
Gross margin 160,000 165,000 (5,000) (3.0)
Operating expenses 128,600 126,000 2,600 2.1
Net operating income 31,400 39,000 (7,600) (19.5)
Interest expense 6,400 7,000 (600) (8.6)
Net income before taxes 25,000 32,000 (7,000) (21.9)
Less income taxes (30%) 7,500 9,600 (2,100) (21.9)
Net income 17,500
$ 22,400
$ (4,900)
$ (21.9)
17-19
CLOVER CORPORATION
Comparative Income Statements
For the Years Ended December 31, 1999 and 1998
Increase (Decrease)
1999 1998 Amount %
Net sales 520,000
$ 480,000
$ 40,000
$ 8.3
Cost of goods sold 360,000 315,000 45,000 14.3
Gross margin 160,000 165,000 (5,000) (3.0)
Operating expenses 128,600 126,000 2,600 2.1
Net operating income 31,400 39,000 (7,600) (19.5)
Interest expense 6,400 7,000 (600) (8.6)
Net income before taxes 25,000 32,000 (7,000) (21.9)
Less income taxes (30%) 7,500 9,600 (2,100) (21.9)
Net income 17,500
$ 22,400
$ (4,900)
$ (21.9)
Sales increased by 8.3% while net
income decreased by 21.9%.
17-20
CLOVER CORPORATION
Comparative Income Statements
For the Years Ended December 31, 1999 and 1998
Increase (Decrease)
1999 1998 Amount %
Net sales 520,000
$ 480,000
$ 40,000
$ 8.3
Cost of goods sold 360,000 315,000 45,000 14.3
Gross margin 160,000 165,000 (5,000) (3.0)
Operating expenses 128,600 126,000 2,600 2.1
Net operating income 31,400 39,000 (7,600) (19.5)
Interest expense 6,400 7,000 (600) (8.6)
Net income before taxes 25,000 32,000 (7,000) (21.9)
Less income taxes (30%) 7,500 9,600 (2,100) (21.9)
Net income 17,500
$ 22,400
$ (4,900)
$ (21.9)
There were increases in both cost of goods
sold (14.3%) and operating expenses (2.1%).
These increased costs more than offset the
increase in sales, yielding an overall
decrease in net income.
17-21
Vertical Analysis Example
The management of Sample Company asks
you to prepare a vertical analysis for the
comparative balance sheets of the
company.
17-22
Sample Company
Balance Sheet (Assets)
At December 31, 1999 and 1998
% of Total Assets
1999 1998 1999 1998
Cash 82,000
$ 30,000
$ 17% 8%
Accts. Rec. 120,000 100,000 25% 26%
Inventory 87,000 82,000 18% 21%
Land 101,000 90,000 21% 23%
Equipment 110,000 100,000 23% 26%
Accum. Depr. (17,000) (15,000) -4% -4%
Total 483,000
$ 387,000
$ 100% 100%
Vertical Analysis Example
17-23
Vertical Analysis Example
Sample Company
Balance Sheet (Assets)
At December 31, 1999 and 1998
% of Total Assets
1999 1998 1999 1998
Cash 82,000
$ 30,000
$ 17% 8%
Accts. Rec. 120,000 100,000 25% 26%
Inventory 87,000 82,000 18% 21%
Land 101,000 90,000 21% 23%
Equipment 110,000 100,000 23% 26%
Accum. Depr. (17,000) (15,000) -4% -4%
Total 483,000
$ 387,000
$ 100% 100%
82,000 ÷ 483,000 = 17% rounded
30,000 ÷ 387,000 = 8% rounded
17-24
Sample Company
Balance Sheet (Liabilities & Stockholders' Equity)
At December 31, 1999 and 1998
% of Total Assets
1999 1998 1999 1998
Acts. Payable 76,000
$ 60,000
$ 16% 16%
Wages Payable 33,000 17,000 7% 4%
Notes Payable 50,000 50,000 10% 13%
Common Stock 170,000 160,000 35% 41%
Retained Earnings 154,000 100,000 32% 26%
Total 483,000
$ 387,000
$ 100% 100%
Vertical Analysis Example
76,000 ÷ 483,000 = 16% rounded
17-25
Trend Percentages Example
Wheeler, Inc. provides you with the
following operating data and asks that
you prepare a trend analysis.
Wheeler, Inc.
Operating Data
1999 1998 1997 1996 1995
Revenues 2,405
$ 2,244
$ 2,112
$ 1,991
$ 1,820
$
Expenses 2,033 1,966 1,870 1,803 1,701
Net income 372
$ 278
$ 242
$ 188
$ 119
$
17-26
Trend Percentages Example
Wheeler, Inc. provides you with the
following operating data and asks that
you prepare a trend analysis.
Wheeler, Inc.
Operating Data
1999 1998 1997 1996 1995
Revenues 2,405
$ 2,244
$ 2,112
$ 1,991
$ 1,820
$
Expenses 2,033 1,966 1,870 1,803 1,701
Net income 372
$ 278
$ 242
$ 188
$ 119
$
1,991 - 1,820 = 171
17-27
Trend Percentages Example
Using 1995 as the base year, we develop
the following percentage relationships.
Wheeler, Inc.
Operating Data
1999 1998 1997 1996 1995
Revenues 132% 123% 116% 109% 100%
Expenses 120% 116% 110% 106% 100%
Net income 313% 234% 203% 158% 100%
1,991 - 1,820 = 171
171 ÷ 1,820 = 9% rounded
17-28
90
100
110
120
130
140
1995 1996 1997 1998 1999
Years
%
of
100
Base
Sales
Expenses
Trend line
for Sales
17-29
Ratios can be expressed in three
different ways:
1. Ratio (e.g., current ratio of 2:1)
2. % (e.g., profit margin of 2%)
3. (e.g., EPS of 2.25)
CAUTION!
“Using ratios and percentages without
considering the underlying causes may
be hazardous to your health!”
lead to incorrect conclusions.”
Ratios
17-30
Categories of Ratios
 Liquidity Ratios
Indicate a company’s short-term
debt-paying ability
 Equity (Long-Term Solvency) Ratios
Show relationship between debt and
equity financing in a company
 Profitability Tests
Relate income to other variables
 Market Tests
Help assess relative merits of stocks in
the marketplace
17-31
Liquidity Ratios
Current (working capital) ratio
Acid-test (quick) ratio
 Cash flow liquidity ratio
Accounts receivable turnover
Number of days’ sales in accounts
receivable
Inventory turnover
 Total assets turnover
651
10 Ratios You Must Know
17-32
Equity (Long-Term Solvency) Ratios
Equity (stockholders’ equity) ratio
 Equity to debt
10 Ratios You Must Know
17-33
Profitability Tests
 Return on operating assets
Net income to net sales (return on
sales or “profit margin”)
Return on average common
stockholders’ equity (ROE)
 Cash flow margin
Earnings per share
 Times interest earned
 Times preferred dividends earned
10 Ratios You Must Know
17-34
Market Tests
 Earnings yield on common stock
Price-earnings ratio
 Payout ratio on common stock
 Dividend yield on common stock
 Dividend yield on preferred stock
 Cash flow per share of common
stock
10 Ratios You Must Know
17-35
Now, let’s look at
Norton
Corporation’s 1999
and 1998 financial
statements.
17-36
NORTON CORPORATION
Balance Sheets
December 31, 1999 and 1998
1999 1998
Assets
Current assets:
Cash 30,000
$ 20,000
$
Accounts receivable, net 20,000 17,000
Inventory 12,000 10,000
Prepaid expenses 3,000 2,000
Total current assets 65,000 49,000
Property and equipment:
Land 165,000 123,000
Buildings and equipment, net 116,390 128,000
Total property and equipment 281,390 251,000
Total assets 346,390
$ 300,000
$
17-37
NORTON CORPORATION
Balance Sheets
December 31, 1999 and 1998
1999 1998
Liabilities and Stockholders' Equity
Current liabilities:
Accounts payable 39,000
$ 40,000
$
Notes payable, short-term 3,000 2,000
Total current liabilities 42,000 42,000
Long-term liabilities:
Notes payable, long-term 70,000 78,000
Total liabilities 112,000 120,000
Stockholders' equity:
Common stock, $1 par value 27,400 17,000
Additional paid-in capital 158,100 113,000
Total paid-in capital 185,500 130,000
Retained earnings 48,890 50,000
Total stockholders' equity 234,390 180,000
Total liabilities and stockholders' equity 346,390
$ 300,000
$
17-38
NORTON CORPORATION
Income Statements
For the Years Ended December 31, 1999 and 1998
1999 1998
Net sales 494,000
$ 450,000
$
Cost of goods sold 140,000 127,000
Gross margin 354,000 323,000
Operating expenses 270,000 249,000
Net operating income 84,000 74,000
Interest expense 7,300 8,000
Net income before taxes 76,700 66,000
Less income taxes (30%) 23,010 19,800
Net income 53,690
$ 46,200
$
17-39
Now, let’s calculate
the 10 ratios based
on Norton’s financial
statements.
17-40
NORTON CORPORATION
1999
Cash 30,000
$
Accounts receivable, net
Beginning of year 17,000
End of year 20,000
Inventory
Beginning of year 10,000
End of year 12,000
Total current assets 65,000
Total current liabilities 42,000
Sales on account 494,000
Cost of goods sold 140,000
We will
use this
information
to calculate
the liquidity
ratios for
Norton.
17-41
Working Capital*
12/31/99
Current assets 65,000
$
Current liabilities (42,000)
Working capital 23,000
$
The excess of current assets over
current liabilities.
* While this is not a ratio, it does give an
indication of a company’s liquidity.
17-42
Current (Working Capital) Ratio
Current
Ratio
65,000
42,000
= = 1.55 : 1
Measures the ability
of the company to pay current
debts as they become due.
Current
Ratio
Current Assets
Current Liabilities
=
#1
17-43
Acid-Test (Quick) Ratio
Quick Assets
Current Liabilities
=
Acid-Test
Ratio
Quick assets are Cash,
Marketable Securities,
Accounts Receivable (net) and
current Notes Receivable.
#2
17-44
Quick Assets
Current Liabilities
=
Acid-Test
Ratio
Norton Corporation’s quick
assets consist of cash of
30,000 and accounts
receivable of 20,000.
Acid-Test (Quick) Ratio
#2
17-45
Quick Assets
Current Liabilities
=
Acid-Test
Ratio
50,000
42,000
= 1.19 : 1
=
Acid-Test
Ratio
Acid-Test (Quick) Ratio
#2
17-46
Sales on Account
Average Accounts Receivable
Accounts
Receivable
Turnover
=
Accounts Receivable Turnover
= 26.70 times
494,000
(17,000 + 20,000) ÷ 2
Accounts
Receivable
Turnover
=
This ratio measures how many
times a company converts its
receivables into cash each year.
#3 Average, net accounts
receivable
Net, credit sales
17-47
Number of Days’ Sales
in Accounts Receivable
Measures, on average, how many
days it takes to collect an
account receivable.
Days’ Sales
in Accounts
Receivables
=
365 Days
Accounts Receivable Turnover
= 13.67 days
=
365 Days
26.70 Times
Days’ Sales
in Accounts
Receivables
#4
17-48
Number of Days’ Sales
in Accounts Receivable
In practice, would 45 days be a
desirable number of days in
receivables?
#4
Days’ Sales
in Accounts
Receivables
=
365 Days
Accounts Receivable Turnover
= 13.67 days
=
365 Days
26.70 Times
Days’ Sales
in Accounts
Receivables
17-49
Inventory Turnover
Cost of Goods Sold
Average Inventory
Inventory
Turnover
=
Measures the number of times
inventory is sold and
replaced during the year.
= 12.73 times
140,000
(10,000 + 12,000) ÷ 2
Inventory
Turnover
=
#5
17-50
Inventory Turnover
Cost of Goods Sold
Average Inventory
Inventory
Turnover
=
Would 5 be a
desirable number of times
for inventory to turnover?
= 12.73 times
140,000
(10,000 + 12,000) ÷ 2
Inventory
Turnover
=
#5
17-51
Equity, or Long–Term
Solvency Ratios
This is part of the information to
calculate the equity, or long-term
solvency ratios of Norton Corporation.
NORTON CORPORATION
1999
Net operating income 84,000
$
Net sales 494,000
Interest expense 7,300
Total stockholders' equity 234,390
17-52
NORTON CORPORATION
1999
Common shares outstanding
Beginning of year 17,000
End of year 27,400
Net income 53,690
$
Stockholders' equity
Beginning of year 180,000
End of year 234,390
Dividends per share 2
Dec. 31 market price/share 20
Interest expense 7,300
Total assets
Beginning of year 300,000
End of year 346,390
Here is the
rest of the
information
we will
use.
17-53
Equity Ratio
Equity
Ratio
=
Stockholders’ Equity
Total Assets
Equity
Ratio
=
234,390
346,390
67.7%
=
Measures the proportion
of total assets provided by
stockholders.
#6
17-54
Net Income to Net Sales
A/K/A Return on Sales or Profit Margin
Net Income
to
Net Sales
=
Net Income
Net Sales
Net Income
to
Net Sales
=
53,690
494,000
= 10.9%
Measures the proportion of the sales dollar
which is retained as profit.
#7
17-55
Net Income to Net Sales
A/K/A Return on Sales or Profit Margin
Net Income
to
Net Sales
=
Net Income
Net Sales
Net Income
to
Net Sales
=
53,690
494,000
= 10.9%
Would a 1% return on sales be good?
#7
17-56
Return on Average Common
Stockholders’ Equity (ROE)
Return on
Stockholders’
Equity
=
Net Income
Average Common
Stockholders’ Equity
=
53,690
(180,000 + 234,390) ÷ 2
= 25.9%
Return on
Stockholders’
Equity
Important measure of the
income-producing ability
of a company.
#8
17-57
Earnings
per Share
Earnings Available to Common Stockholders
Weighted-Average Number of Common
Shares Outstanding
=
Earnings
per Share
53,690
(17,000 + 27,400) ÷ 2
= = 2.42
The financial press regularly publishes
actual and forecasted EPS amounts.
#9
Earnings Per Share
17-58
 What’s new from Chap. 15?
Weighted-average calculation
EPS of common stock = _______________________
Earnings available to
common stockholders
Weighted-average number of
common shares outstanding
644
 Three alternatives for calculating
weighted-average number of shares
Earnings Per Share
17-59
EPS of common stock = _______________________
Earnings available to
common stockholders
Weighted-average number of
common shares outstanding
645
Alternate #1
Earnings Per Share
 What’s new from Chap. 15?
Weighted-average calculation
17-60
Alternate #3
Alternate #2
645
Earnings Per Share
17-61
¶ EPS and Stock Dividends or Splits
Why restate all prior calculations of EPS?
Comparability - i.e., no additional capital was
generated by the dividend or split
646
Earnings Per Share
¶ Primary EPS and Fully Diluted EPS
APB Opinion No. 15
I mentioned this 17-page pronouncement that
required a 100-page explanation in the lecture
for chapter 13.
17-62
Price-Earnings Ratio
A/K/A P/E Multiple
Price-Earnings
Ratio
Market Price Per Share
EPS
=
Price-Earnings
Ratio
=
20.00
2.42
= 8.3 : 1
#10
Provides some measure of whether the
stock is under or overpriced.
17-63
Important Considerations
 Need for comparable data
 Data is provided by Dun &
Bradstreet, Standard & Poor’s etc.
 Must compare by industry
 Is EPS comparable?
 Influence of external factors
 General business conditions
 Seasonal nature of business operations
 Impact of inflation
17-64
Question
The current ratio is a measure of
liquidity that is computed by dividing
total assets by total liabilities.
a. True
b. False
17-65
The current ratio is a measure of
liquidity that is computed by dividing
total assets by total liabilities.
a. True
b. False
Question
The current ratio is a measure of
liquidity, but is computed by
dividing current assets by
current liabilities
17-66
Question
Quick assets are defined as Cash,
Marketable Securities and net
receivables.
a. True
b. False
17-67
Quick assets are defined as Cash,
Marketable Securities and net
receivables.
a. True
b. False
Question
17-68
No more ratios, please!
17-69
About Test #1
 Will be challenging because the
material covered is challenging
 All questions are T/F or M/C
Questions are 5-pt., 3-pt. & 1-pt.
 No tricks such as patterns in answers
Order of answers is random
 Coverage is even over the 4 chapters
 Time allowed: 75 minutes
17-70
About Test #1
 Best way to study
 Notes first
 Study guide and/or Hermanson tutorials
 Calculators will be provided
 Must wait outside classroom
 Have your questions ready for next
actual class
 See course home page for office hours

More Related Content

Similar to Financial Statement Analysis Methods Guide

CHAPTET 15 FINANCIAL STATEMENT ANALYSIS.ppt
CHAPTET 15 FINANCIAL STATEMENT ANALYSIS.pptCHAPTET 15 FINANCIAL STATEMENT ANALYSIS.ppt
CHAPTET 15 FINANCIAL STATEMENT ANALYSIS.pptJemalSeid25
 
FinancialStmtAnalysis-Garrison11ePPT (1).ppt
FinancialStmtAnalysis-Garrison11ePPT (1).pptFinancialStmtAnalysis-Garrison11ePPT (1).ppt
FinancialStmtAnalysis-Garrison11ePPT (1).pptSaurabhSharma262273
 
chapter 1.ppt
chapter 1.pptchapter 1.ppt
chapter 1.pptEnJoe1
 
ANALYSIS OF FINANCIAL STATEMENTS ch# 03
ANALYSIS OF FINANCIAL STATEMENTS ch# 03ANALYSIS OF FINANCIAL STATEMENTS ch# 03
ANALYSIS OF FINANCIAL STATEMENTS ch# 03KaleemSarwar2
 
Financial Reporting And Analysis
Financial Reporting And AnalysisFinancial Reporting And Analysis
Financial Reporting And AnalysisAbdullah Mir
 
Chapter 5 - Cash flows - handout.pptx
Chapter 5 - Cash flows - handout.pptxChapter 5 - Cash flows - handout.pptx
Chapter 5 - Cash flows - handout.pptxThoChiNguyn11
 
Startup Valuation - Hervé Lebret 2020
Startup Valuation - Hervé Lebret 2020Startup Valuation - Hervé Lebret 2020
Startup Valuation - Hervé Lebret 2020Hervé Lebret
 
Week five assignment wiley plus
Week five assignment  wiley plusWeek five assignment  wiley plus
Week five assignment wiley plusDonnieMax
 
Lecture 3 (chapter 6) accounting for finance
Lecture 3 (chapter 6) accounting for financeLecture 3 (chapter 6) accounting for finance
Lecture 3 (chapter 6) accounting for financeHareindranath Sivam
 
Chapter 4: Financial Statement Analysis
Chapter 4: Financial Statement AnalysisChapter 4: Financial Statement Analysis
Chapter 4: Financial Statement AnalysisNada G.Youssef
 
Extra Credit Assignment, Econ 140 (3)Choose any topic discussed.docx
Extra Credit Assignment, Econ 140 (3)Choose any topic discussed.docxExtra Credit Assignment, Econ 140 (3)Choose any topic discussed.docx
Extra Credit Assignment, Econ 140 (3)Choose any topic discussed.docxnealwaters20034
 
Fm11 ch 03 financial statements, cash flow, and taxes
Fm11 ch 03 financial statements, cash flow, and taxesFm11 ch 03 financial statements, cash flow, and taxes
Fm11 ch 03 financial statements, cash flow, and taxesNhu Tuyet Tran
 
Fm11 ch 03 show
Fm11 ch 03 showFm11 ch 03 show
Fm11 ch 03 showAdi Susilo
 
ACC-291-Week-5-ASSIGNMENT-WILEY-PLUS-Week five assignment wiley plus
ACC-291-Week-5-ASSIGNMENT-WILEY-PLUS-Week five assignment   wiley plusACC-291-Week-5-ASSIGNMENT-WILEY-PLUS-Week five assignment   wiley plus
ACC-291-Week-5-ASSIGNMENT-WILEY-PLUS-Week five assignment wiley plusDonnieMax
 
1 Front Page 2 Memo TO.docx
1  Front Page 2  Memo TO.docx1  Front Page 2  Memo TO.docx
1 Front Page 2 Memo TO.docxkarisariddell
 
Assignment 08Accounting for ManagersDirections Unless otherwis.docx
Assignment 08Accounting for ManagersDirections Unless otherwis.docxAssignment 08Accounting for ManagersDirections Unless otherwis.docx
Assignment 08Accounting for ManagersDirections Unless otherwis.docxfredharris32
 

Similar to Financial Statement Analysis Methods Guide (20)

Common size analysis
Common size analysisCommon size analysis
Common size analysis
 
CHAPTET 15 FINANCIAL STATEMENT ANALYSIS.ppt
CHAPTET 15 FINANCIAL STATEMENT ANALYSIS.pptCHAPTET 15 FINANCIAL STATEMENT ANALYSIS.ppt
CHAPTET 15 FINANCIAL STATEMENT ANALYSIS.ppt
 
FinancialStmtAnalysis-Garrison11ePPT (1).ppt
FinancialStmtAnalysis-Garrison11ePPT (1).pptFinancialStmtAnalysis-Garrison11ePPT (1).ppt
FinancialStmtAnalysis-Garrison11ePPT (1).ppt
 
chapter 1.ppt
chapter 1.pptchapter 1.ppt
chapter 1.ppt
 
ANALYSIS OF FINANCIAL STATEMENTS ch# 03
ANALYSIS OF FINANCIAL STATEMENTS ch# 03ANALYSIS OF FINANCIAL STATEMENTS ch# 03
ANALYSIS OF FINANCIAL STATEMENTS ch# 03
 
Financial Reporting And Analysis
Financial Reporting And AnalysisFinancial Reporting And Analysis
Financial Reporting And Analysis
 
Chapter 5 - Cash flows - handout.pptx
Chapter 5 - Cash flows - handout.pptxChapter 5 - Cash flows - handout.pptx
Chapter 5 - Cash flows - handout.pptx
 
Startup Valuation - Hervé Lebret 2020
Startup Valuation - Hervé Lebret 2020Startup Valuation - Hervé Lebret 2020
Startup Valuation - Hervé Lebret 2020
 
Week five assignment wiley plus
Week five assignment  wiley plusWeek five assignment  wiley plus
Week five assignment wiley plus
 
Lecture 3 (chapter 6) accounting for finance
Lecture 3 (chapter 6) accounting for financeLecture 3 (chapter 6) accounting for finance
Lecture 3 (chapter 6) accounting for finance
 
ch 03 Fin stmts
ch 03 Fin stmtsch 03 Fin stmts
ch 03 Fin stmts
 
Chapter 4: Financial Statement Analysis
Chapter 4: Financial Statement AnalysisChapter 4: Financial Statement Analysis
Chapter 4: Financial Statement Analysis
 
Extra Credit Assignment, Econ 140 (3)Choose any topic discussed.docx
Extra Credit Assignment, Econ 140 (3)Choose any topic discussed.docxExtra Credit Assignment, Econ 140 (3)Choose any topic discussed.docx
Extra Credit Assignment, Econ 140 (3)Choose any topic discussed.docx
 
Fm11 ch 03 financial statements, cash flow, and taxes
Fm11 ch 03 financial statements, cash flow, and taxesFm11 ch 03 financial statements, cash flow, and taxes
Fm11 ch 03 financial statements, cash flow, and taxes
 
Fm11 ch 03 show
Fm11 ch 03 showFm11 ch 03 show
Fm11 ch 03 show
 
ACC-291-Week-5-ASSIGNMENT-WILEY-PLUS-Week five assignment wiley plus
ACC-291-Week-5-ASSIGNMENT-WILEY-PLUS-Week five assignment   wiley plusACC-291-Week-5-ASSIGNMENT-WILEY-PLUS-Week five assignment   wiley plus
ACC-291-Week-5-ASSIGNMENT-WILEY-PLUS-Week five assignment wiley plus
 
1 Front Page 2 Memo TO.docx
1  Front Page 2  Memo TO.docx1  Front Page 2  Memo TO.docx
1 Front Page 2 Memo TO.docx
 
Assignment 08Accounting for ManagersDirections Unless otherwis.docx
Assignment 08Accounting for ManagersDirections Unless otherwis.docxAssignment 08Accounting for ManagersDirections Unless otherwis.docx
Assignment 08Accounting for ManagersDirections Unless otherwis.docx
 
ch17 (1).pdf
ch17 (1).pdfch17 (1).pdf
ch17 (1).pdf
 
ch17.pdf
ch17.pdfch17.pdf
ch17.pdf
 

More from RAJI585568

forwardandfutures-190403011949.pptx
forwardandfutures-190403011949.pptxforwardandfutures-190403011949.pptx
forwardandfutures-190403011949.pptxRAJI585568
 
fm introduction.PPTX
fm introduction.PPTXfm introduction.PPTX
fm introduction.PPTXRAJI585568
 
derivates.pptx
derivates.pptxderivates.pptx
derivates.pptxRAJI585568
 
tax planning.pptx
tax planning.pptxtax planning.pptx
tax planning.pptxRAJI585568
 
Inventory valuvation.ppt
Inventory valuvation.pptInventory valuvation.ppt
Inventory valuvation.pptRAJI585568
 
MA ppt. ppix.pptx
MA ppt. ppix.pptxMA ppt. ppix.pptx
MA ppt. ppix.pptxRAJI585568
 
inputtaxcreditlatest-180228115247 (1).pptx
inputtaxcreditlatest-180228115247 (1).pptxinputtaxcreditlatest-180228115247 (1).pptx
inputtaxcreditlatest-180228115247 (1).pptxRAJI585568
 
supplyundergst-200205060752 (1).pptx
supplyundergst-200205060752 (1).pptxsupplyundergst-200205060752 (1).pptx
supplyundergst-200205060752 (1).pptxRAJI585568
 
provisionsregardingbaggageandstores-200309042616.pptx
provisionsregardingbaggageandstores-200309042616.pptxprovisionsregardingbaggageandstores-200309042616.pptx
provisionsregardingbaggageandstores-200309042616.pptxRAJI585568
 
INDEX USED IN STOCK EXCHANGE.pptx
INDEX USED IN STOCK EXCHANGE.pptxINDEX USED IN STOCK EXCHANGE.pptx
INDEX USED IN STOCK EXCHANGE.pptxRAJI585568
 
levyandexemptionsundercustomsduty12-200121053653.pptx
levyandexemptionsundercustomsduty12-200121053653.pptxlevyandexemptionsundercustomsduty12-200121053653.pptx
levyandexemptionsundercustomsduty12-200121053653.pptxRAJI585568
 
PPT_ON_VALUATION.pptx
PPT_ON_VALUATION.pptxPPT_ON_VALUATION.pptx
PPT_ON_VALUATION.pptxRAJI585568
 

More from RAJI585568 (20)

forwardandfutures-190403011949.pptx
forwardandfutures-190403011949.pptxforwardandfutures-190403011949.pptx
forwardandfutures-190403011949.pptx
 
fm introduction.PPTX
fm introduction.PPTXfm introduction.PPTX
fm introduction.PPTX
 
costing.PPTX
costing.PPTXcosting.PPTX
costing.PPTX
 
derivates.pptx
derivates.pptxderivates.pptx
derivates.pptx
 
derivates.pdf
derivates.pdfderivates.pdf
derivates.pdf
 
tax planning.pptx
tax planning.pptxtax planning.pptx
tax planning.pptx
 
Inventory valuvation.ppt
Inventory valuvation.pptInventory valuvation.ppt
Inventory valuvation.ppt
 
MA ppt. ppix.pptx
MA ppt. ppix.pptxMA ppt. ppix.pptx
MA ppt. ppix.pptx
 
intial
intial intial
intial
 
UNIT-1C.pptx
UNIT-1C.pptxUNIT-1C.pptx
UNIT-1C.pptx
 
inputtaxcreditlatest-180228115247 (1).pptx
inputtaxcreditlatest-180228115247 (1).pptxinputtaxcreditlatest-180228115247 (1).pptx
inputtaxcreditlatest-180228115247 (1).pptx
 
supplyundergst-200205060752 (1).pptx
supplyundergst-200205060752 (1).pptxsupplyundergst-200205060752 (1).pptx
supplyundergst-200205060752 (1).pptx
 
IPO.pptx
IPO.pptxIPO.pptx
IPO.pptx
 
mbfs -1.pptx
mbfs -1.pptxmbfs -1.pptx
mbfs -1.pptx
 
provisionsregardingbaggageandstores-200309042616.pptx
provisionsregardingbaggageandstores-200309042616.pptxprovisionsregardingbaggageandstores-200309042616.pptx
provisionsregardingbaggageandstores-200309042616.pptx
 
INDEX USED IN STOCK EXCHANGE.pptx
INDEX USED IN STOCK EXCHANGE.pptxINDEX USED IN STOCK EXCHANGE.pptx
INDEX USED IN STOCK EXCHANGE.pptx
 
retax.pptx
retax.pptxretax.pptx
retax.pptx
 
levyandexemptionsundercustomsduty12-200121053653.pptx
levyandexemptionsundercustomsduty12-200121053653.pptxlevyandexemptionsundercustomsduty12-200121053653.pptx
levyandexemptionsundercustomsduty12-200121053653.pptx
 
PPT_ON_VALUATION.pptx
PPT_ON_VALUATION.pptxPPT_ON_VALUATION.pptx
PPT_ON_VALUATION.pptx
 
dcfval.ppt
dcfval.pptdcfval.ppt
dcfval.ppt
 

Recently uploaded

INVOLUNTARY TRANSFERS Kenya school of law.pptx
INVOLUNTARY TRANSFERS Kenya school of law.pptxINVOLUNTARY TRANSFERS Kenya school of law.pptx
INVOLUNTARY TRANSFERS Kenya school of law.pptxnyabatejosphat1
 
Cleades Robinson's Commitment to Service
Cleades Robinson's Commitment to ServiceCleades Robinson's Commitment to Service
Cleades Robinson's Commitment to ServiceCleades Robinson
 
Chp 1- Contract and its kinds-business law .ppt
Chp 1- Contract and its kinds-business law .pptChp 1- Contract and its kinds-business law .ppt
Chp 1- Contract and its kinds-business law .pptzainabbkhaleeq123
 
FINALTRUEENFORCEMENT OF BARANGAY SETTLEMENT.ppt
FINALTRUEENFORCEMENT OF BARANGAY SETTLEMENT.pptFINALTRUEENFORCEMENT OF BARANGAY SETTLEMENT.ppt
FINALTRUEENFORCEMENT OF BARANGAY SETTLEMENT.pptjudeplata
 
Indemnity Guarantee Section 124 125 and 126
Indemnity Guarantee Section 124 125 and 126Indemnity Guarantee Section 124 125 and 126
Indemnity Guarantee Section 124 125 and 126Oishi8
 
THE FACTORIES ACT,1948 (2).pptx labour
THE FACTORIES ACT,1948 (2).pptx   labourTHE FACTORIES ACT,1948 (2).pptx   labour
THE FACTORIES ACT,1948 (2).pptx labourBhavikaGholap1
 
6th sem cpc notes for 6th semester students samjhe. Padhlo bhai
6th sem cpc notes for 6th semester students samjhe. Padhlo bhai6th sem cpc notes for 6th semester students samjhe. Padhlo bhai
6th sem cpc notes for 6th semester students samjhe. Padhlo bhaiShashankKumar441258
 
如何办理新西兰奥克兰商学院毕业证(本硕)AIS学位证书
如何办理新西兰奥克兰商学院毕业证(本硕)AIS学位证书如何办理新西兰奥克兰商学院毕业证(本硕)AIS学位证书
如何办理新西兰奥克兰商学院毕业证(本硕)AIS学位证书Fir L
 
如何办理(USF文凭证书)美国旧金山大学毕业证学位证书
如何办理(USF文凭证书)美国旧金山大学毕业证学位证书如何办理(USF文凭证书)美国旧金山大学毕业证学位证书
如何办理(USF文凭证书)美国旧金山大学毕业证学位证书Fs Las
 
一比一原版旧金山州立大学毕业证学位证书
 一比一原版旧金山州立大学毕业证学位证书 一比一原版旧金山州立大学毕业证学位证书
一比一原版旧金山州立大学毕业证学位证书SS A
 
Introduction to Corruption, definition, types, impact and conclusion
Introduction to Corruption, definition, types, impact and conclusionIntroduction to Corruption, definition, types, impact and conclusion
Introduction to Corruption, definition, types, impact and conclusionAnuragMishra811030
 
PPT- Voluntary Liquidation (Under section 59).pptx
PPT- Voluntary Liquidation (Under section 59).pptxPPT- Voluntary Liquidation (Under section 59).pptx
PPT- Voluntary Liquidation (Under section 59).pptxRRR Chambers
 
如何办理(Lincoln文凭证书)林肯大学毕业证学位证书
如何办理(Lincoln文凭证书)林肯大学毕业证学位证书如何办理(Lincoln文凭证书)林肯大学毕业证学位证书
如何办理(Lincoln文凭证书)林肯大学毕业证学位证书Fs Las
 
CAFC Chronicles: Costly Tales of Claim Construction Fails
CAFC Chronicles: Costly Tales of Claim Construction FailsCAFC Chronicles: Costly Tales of Claim Construction Fails
CAFC Chronicles: Costly Tales of Claim Construction FailsAurora Consulting
 
Transferable and Non-Transferable Property.pptx
Transferable and Non-Transferable Property.pptxTransferable and Non-Transferable Property.pptx
Transferable and Non-Transferable Property.pptx2020000445musaib
 
如何办理普利茅斯大学毕业证(本硕)Plymouth学位证书
如何办理普利茅斯大学毕业证(本硕)Plymouth学位证书如何办理普利茅斯大学毕业证(本硕)Plymouth学位证书
如何办理普利茅斯大学毕业证(本硕)Plymouth学位证书Fir L
 

Recently uploaded (20)

INVOLUNTARY TRANSFERS Kenya school of law.pptx
INVOLUNTARY TRANSFERS Kenya school of law.pptxINVOLUNTARY TRANSFERS Kenya school of law.pptx
INVOLUNTARY TRANSFERS Kenya school of law.pptx
 
Cleades Robinson's Commitment to Service
Cleades Robinson's Commitment to ServiceCleades Robinson's Commitment to Service
Cleades Robinson's Commitment to Service
 
Rohini Sector 25 Call Girls Delhi 9999965857 @Sabina Saikh No Advance
Rohini Sector 25 Call Girls Delhi 9999965857 @Sabina Saikh No AdvanceRohini Sector 25 Call Girls Delhi 9999965857 @Sabina Saikh No Advance
Rohini Sector 25 Call Girls Delhi 9999965857 @Sabina Saikh No Advance
 
Chp 1- Contract and its kinds-business law .ppt
Chp 1- Contract and its kinds-business law .pptChp 1- Contract and its kinds-business law .ppt
Chp 1- Contract and its kinds-business law .ppt
 
FINALTRUEENFORCEMENT OF BARANGAY SETTLEMENT.ppt
FINALTRUEENFORCEMENT OF BARANGAY SETTLEMENT.pptFINALTRUEENFORCEMENT OF BARANGAY SETTLEMENT.ppt
FINALTRUEENFORCEMENT OF BARANGAY SETTLEMENT.ppt
 
Vip Call Girls Greater Noida ➡️ Delhi ➡️ 9999965857 No Advance 24HRS Live
Vip Call Girls Greater Noida ➡️ Delhi ➡️ 9999965857 No Advance 24HRS LiveVip Call Girls Greater Noida ➡️ Delhi ➡️ 9999965857 No Advance 24HRS Live
Vip Call Girls Greater Noida ➡️ Delhi ➡️ 9999965857 No Advance 24HRS Live
 
Old Income Tax Regime Vs New Income Tax Regime
Old  Income Tax Regime Vs  New Income Tax   RegimeOld  Income Tax Regime Vs  New Income Tax   Regime
Old Income Tax Regime Vs New Income Tax Regime
 
Indemnity Guarantee Section 124 125 and 126
Indemnity Guarantee Section 124 125 and 126Indemnity Guarantee Section 124 125 and 126
Indemnity Guarantee Section 124 125 and 126
 
THE FACTORIES ACT,1948 (2).pptx labour
THE FACTORIES ACT,1948 (2).pptx   labourTHE FACTORIES ACT,1948 (2).pptx   labour
THE FACTORIES ACT,1948 (2).pptx labour
 
6th sem cpc notes for 6th semester students samjhe. Padhlo bhai
6th sem cpc notes for 6th semester students samjhe. Padhlo bhai6th sem cpc notes for 6th semester students samjhe. Padhlo bhai
6th sem cpc notes for 6th semester students samjhe. Padhlo bhai
 
Sensual Moments: +91 9999965857 Independent Call Girls Vasundhara Delhi {{ Mo...
Sensual Moments: +91 9999965857 Independent Call Girls Vasundhara Delhi {{ Mo...Sensual Moments: +91 9999965857 Independent Call Girls Vasundhara Delhi {{ Mo...
Sensual Moments: +91 9999965857 Independent Call Girls Vasundhara Delhi {{ Mo...
 
如何办理新西兰奥克兰商学院毕业证(本硕)AIS学位证书
如何办理新西兰奥克兰商学院毕业证(本硕)AIS学位证书如何办理新西兰奥克兰商学院毕业证(本硕)AIS学位证书
如何办理新西兰奥克兰商学院毕业证(本硕)AIS学位证书
 
如何办理(USF文凭证书)美国旧金山大学毕业证学位证书
如何办理(USF文凭证书)美国旧金山大学毕业证学位证书如何办理(USF文凭证书)美国旧金山大学毕业证学位证书
如何办理(USF文凭证书)美国旧金山大学毕业证学位证书
 
一比一原版旧金山州立大学毕业证学位证书
 一比一原版旧金山州立大学毕业证学位证书 一比一原版旧金山州立大学毕业证学位证书
一比一原版旧金山州立大学毕业证学位证书
 
Introduction to Corruption, definition, types, impact and conclusion
Introduction to Corruption, definition, types, impact and conclusionIntroduction to Corruption, definition, types, impact and conclusion
Introduction to Corruption, definition, types, impact and conclusion
 
PPT- Voluntary Liquidation (Under section 59).pptx
PPT- Voluntary Liquidation (Under section 59).pptxPPT- Voluntary Liquidation (Under section 59).pptx
PPT- Voluntary Liquidation (Under section 59).pptx
 
如何办理(Lincoln文凭证书)林肯大学毕业证学位证书
如何办理(Lincoln文凭证书)林肯大学毕业证学位证书如何办理(Lincoln文凭证书)林肯大学毕业证学位证书
如何办理(Lincoln文凭证书)林肯大学毕业证学位证书
 
CAFC Chronicles: Costly Tales of Claim Construction Fails
CAFC Chronicles: Costly Tales of Claim Construction FailsCAFC Chronicles: Costly Tales of Claim Construction Fails
CAFC Chronicles: Costly Tales of Claim Construction Fails
 
Transferable and Non-Transferable Property.pptx
Transferable and Non-Transferable Property.pptxTransferable and Non-Transferable Property.pptx
Transferable and Non-Transferable Property.pptx
 
如何办理普利茅斯大学毕业证(本硕)Plymouth学位证书
如何办理普利茅斯大学毕业证(本硕)Plymouth学位证书如何办理普利茅斯大学毕业证(本硕)Plymouth学位证书
如何办理普利茅斯大学毕业证(本硕)Plymouth学位证书
 

Financial Statement Analysis Methods Guide

  • 1. 17-1 Information is available from  Published annual reports (1) Financial statements (2) Notes to financial statements (3) Letters to stockholders (4) Auditor’s report (Independent accountants) (5) Management’s discussion and analysis  Reports filed with the government e.g., Form 10-K, Form 10-Q and Form 8-K Financial Statement Analysis
  • 2. 17-2  Horizontal Analysis  Vertical Analysis  Common-Size Statements  Trend Percentages  Ratio Analysis Methods of Financial Statement Analysis
  • 3. 17-3 Horizontal Analysis Using comparative financial statements to calculate dollar or percentage changes in a financial statement item from one period to the next
  • 4. 17-4 Vertical Analysis For a single financial statement, each item is expressed as a percentage of a significant total, e.g., all income statement items are expressed as a percentage of sales
  • 5. 17-5 Common-Size Statements Financial statements that show only percentages and no absolute rupees amounts
  • 6. 17-6 Trend Percentages Show changes over time in given financial statement items (can help evaluate financial information of several years)
  • 7. 17-7 Ratio Analysis Expression of logical relationships between items in a financial statement of a single period (e.g., percentage relationship between revenue and net income)
  • 8. 17-8 Horizontal Analysis Example The management of mis Company provides you with comparative balance sheets of the years ended December 31, 1999 and 1998. Management asks you to prepare a horizontal analysis on the information.
  • 9. 17-9 Silver CORPORATION Comparative Balance Sheets December 31, 1999 and 1998 Incre 1999 1998 Am Assets Current assets: Cash 12,000 $ 23,500 $ Accounts receivable, net 60,000 40,000 Inventory 80,000 1,00,000 Prepaid expenses 3,000 1,200 Total current assets 1,55,000 1,64,700 Property and equipment: Land 40,000 40,000 Buildings and equipment, net 1,20,000 85,000 Total property and equipment 1,60,000 1,25,000 Total assets 3,15,000 $ 2,89,700 $
  • 10. 17-10 Calculating Change in Rupee Amounts Rupee Change Current Year Figure Base Year Figure = – Horizontal Analysis Example
  • 11. 17-11 Calculating Change In Rupee Amounts Since we are measuring the amount of the change between 1998 and 1999, the dollar amounts for 1998 become the “base” year figures. Rupee Change Current Year Figure Base Year Figure = – Horizontal Analysis Example
  • 12. 17-12 Calculating Change as a Percentage Percentage Change Dollar Change Base Year Figure 100% = × Horizontal Analysis Example
  • 13. 17-13 CLOVER CORPORATION Comparative Balance Sheets December 31, 1999 and 1998 Increase (Decrease) 1999 1998 Amount % Assets Current assets: Cash 12,000 $ 23,500 $ (11,500) $ Accounts receivable, net 60,000 40,000 Inventory 80,000 100,000 Prepaid expenses 3,000 1,200 Total current assets 155,000 164,700 Property and equipment: Land 40,000 40,000 Buildings and equipment, net 120,000 85,000 Total property and equipment 160,000 125,000 Total assets 315,000 $ 289,700 $ 12,000 – 23,500 = (11,500) Horizontal Analysis Example
  • 14. 17-14 CLOVER CORPORATION Comparative Balance Sheets December 31, 1999 and 1998 Increase (Decrease) 1999 1998 Amount % Assets Current assets: Cash 12,000 $ 23,500 $ (11,500) $ (48.9) Accounts receivable, net 60,000 40,000 Inventory 80,000 100,000 Prepaid expenses 3,000 1,200 Total current assets 155,000 164,700 Property and equipment: Land 40,000 40,000 Buildings and equipment, net 120,000 85,000 Total property and equipment 160,000 125,000 Total assets 315,000 $ 289,700 $ (11,500 ÷ 23,500) × 100% = 48.9% Horizontal Analysis Example
  • 15. 17-15 CLOVER CORPORATION Comparative Balance Sheets December 31, 1999 and 1998 Increase (Decrease) 1999 1998 Amount % Assets Current assets: Cash 12,000 $ 23,500 $ (11,500) $ (48.9) Accounts receivable, net 60,000 40,000 20,000 50.0 Inventory 80,000 100,000 (20,000) (20.0) Prepaid expenses 3,000 1,200 1,800 150.0 Total current assets 155,000 164,700 (9,700) (5.9) Property and equipment: Land 40,000 40,000 - 0.0 Buildings and equipment, net 120,000 85,000 35,000 41.2 Total property and equipment 160,000 125,000 35,000 28.0 Total assets 315,000 $ 289,700 $ 25,300 $ 8.7 Horizontal Analysis Example
  • 16. 17-16 CLOVER CORPORATION Comparative Balance Sheets December 31, 1999 and 1998 Increase (Decrease) 1999 1998 Amount % Liabilities and Stockholders' Equity Current liabilities: Accounts payable 67,000 $ 44,000 $ 23,000 $ 52.3 Notes payable 3,000 6,000 (3,000) (50.0) Total current liabilities 70,000 50,000 20,000 40.0 Long-term liabilities: Bonds payable, 8% 75,000 80,000 (5,000) (6.3) Total liabilities 145,000 130,000 15,000 11.5 Stockholders' equity: Preferred stock 20,000 20,000 - 0.0 Common stock 60,000 60,000 - 0.0 Additional paid-in capital 10,000 10,000 - 0.0 Total paid-in capital 90,000 90,000 - 0.0 Retained earnings 80,000 69,700 10,300 14.8 Total stockholders' equity 170,000 159,700 10,300 6.4 Total liabilities and stockholders' equity 315,000 $ 289,700 $ 25,300 $ 8.7
  • 17. 17-17 Now, let’s apply the procedures to the income statement. Horizontal Analysis Example
  • 18. 17-18 CLOVER CORPORATION Comparative Income Statements For the Years Ended December 31, 1999 and 1998 Increase (Decrease) 1999 1998 Amount % Net sales 520,000 $ 480,000 $ 40,000 $ 8.3 Cost of goods sold 360,000 315,000 45,000 14.3 Gross margin 160,000 165,000 (5,000) (3.0) Operating expenses 128,600 126,000 2,600 2.1 Net operating income 31,400 39,000 (7,600) (19.5) Interest expense 6,400 7,000 (600) (8.6) Net income before taxes 25,000 32,000 (7,000) (21.9) Less income taxes (30%) 7,500 9,600 (2,100) (21.9) Net income 17,500 $ 22,400 $ (4,900) $ (21.9)
  • 19. 17-19 CLOVER CORPORATION Comparative Income Statements For the Years Ended December 31, 1999 and 1998 Increase (Decrease) 1999 1998 Amount % Net sales 520,000 $ 480,000 $ 40,000 $ 8.3 Cost of goods sold 360,000 315,000 45,000 14.3 Gross margin 160,000 165,000 (5,000) (3.0) Operating expenses 128,600 126,000 2,600 2.1 Net operating income 31,400 39,000 (7,600) (19.5) Interest expense 6,400 7,000 (600) (8.6) Net income before taxes 25,000 32,000 (7,000) (21.9) Less income taxes (30%) 7,500 9,600 (2,100) (21.9) Net income 17,500 $ 22,400 $ (4,900) $ (21.9) Sales increased by 8.3% while net income decreased by 21.9%.
  • 20. 17-20 CLOVER CORPORATION Comparative Income Statements For the Years Ended December 31, 1999 and 1998 Increase (Decrease) 1999 1998 Amount % Net sales 520,000 $ 480,000 $ 40,000 $ 8.3 Cost of goods sold 360,000 315,000 45,000 14.3 Gross margin 160,000 165,000 (5,000) (3.0) Operating expenses 128,600 126,000 2,600 2.1 Net operating income 31,400 39,000 (7,600) (19.5) Interest expense 6,400 7,000 (600) (8.6) Net income before taxes 25,000 32,000 (7,000) (21.9) Less income taxes (30%) 7,500 9,600 (2,100) (21.9) Net income 17,500 $ 22,400 $ (4,900) $ (21.9) There were increases in both cost of goods sold (14.3%) and operating expenses (2.1%). These increased costs more than offset the increase in sales, yielding an overall decrease in net income.
  • 21. 17-21 Vertical Analysis Example The management of Sample Company asks you to prepare a vertical analysis for the comparative balance sheets of the company.
  • 22. 17-22 Sample Company Balance Sheet (Assets) At December 31, 1999 and 1998 % of Total Assets 1999 1998 1999 1998 Cash 82,000 $ 30,000 $ 17% 8% Accts. Rec. 120,000 100,000 25% 26% Inventory 87,000 82,000 18% 21% Land 101,000 90,000 21% 23% Equipment 110,000 100,000 23% 26% Accum. Depr. (17,000) (15,000) -4% -4% Total 483,000 $ 387,000 $ 100% 100% Vertical Analysis Example
  • 23. 17-23 Vertical Analysis Example Sample Company Balance Sheet (Assets) At December 31, 1999 and 1998 % of Total Assets 1999 1998 1999 1998 Cash 82,000 $ 30,000 $ 17% 8% Accts. Rec. 120,000 100,000 25% 26% Inventory 87,000 82,000 18% 21% Land 101,000 90,000 21% 23% Equipment 110,000 100,000 23% 26% Accum. Depr. (17,000) (15,000) -4% -4% Total 483,000 $ 387,000 $ 100% 100% 82,000 ÷ 483,000 = 17% rounded 30,000 ÷ 387,000 = 8% rounded
  • 24. 17-24 Sample Company Balance Sheet (Liabilities & Stockholders' Equity) At December 31, 1999 and 1998 % of Total Assets 1999 1998 1999 1998 Acts. Payable 76,000 $ 60,000 $ 16% 16% Wages Payable 33,000 17,000 7% 4% Notes Payable 50,000 50,000 10% 13% Common Stock 170,000 160,000 35% 41% Retained Earnings 154,000 100,000 32% 26% Total 483,000 $ 387,000 $ 100% 100% Vertical Analysis Example 76,000 ÷ 483,000 = 16% rounded
  • 25. 17-25 Trend Percentages Example Wheeler, Inc. provides you with the following operating data and asks that you prepare a trend analysis. Wheeler, Inc. Operating Data 1999 1998 1997 1996 1995 Revenues 2,405 $ 2,244 $ 2,112 $ 1,991 $ 1,820 $ Expenses 2,033 1,966 1,870 1,803 1,701 Net income 372 $ 278 $ 242 $ 188 $ 119 $
  • 26. 17-26 Trend Percentages Example Wheeler, Inc. provides you with the following operating data and asks that you prepare a trend analysis. Wheeler, Inc. Operating Data 1999 1998 1997 1996 1995 Revenues 2,405 $ 2,244 $ 2,112 $ 1,991 $ 1,820 $ Expenses 2,033 1,966 1,870 1,803 1,701 Net income 372 $ 278 $ 242 $ 188 $ 119 $ 1,991 - 1,820 = 171
  • 27. 17-27 Trend Percentages Example Using 1995 as the base year, we develop the following percentage relationships. Wheeler, Inc. Operating Data 1999 1998 1997 1996 1995 Revenues 132% 123% 116% 109% 100% Expenses 120% 116% 110% 106% 100% Net income 313% 234% 203% 158% 100% 1,991 - 1,820 = 171 171 ÷ 1,820 = 9% rounded
  • 28. 17-28 90 100 110 120 130 140 1995 1996 1997 1998 1999 Years % of 100 Base Sales Expenses Trend line for Sales
  • 29. 17-29 Ratios can be expressed in three different ways: 1. Ratio (e.g., current ratio of 2:1) 2. % (e.g., profit margin of 2%) 3. (e.g., EPS of 2.25) CAUTION! “Using ratios and percentages without considering the underlying causes may be hazardous to your health!” lead to incorrect conclusions.” Ratios
  • 30. 17-30 Categories of Ratios  Liquidity Ratios Indicate a company’s short-term debt-paying ability  Equity (Long-Term Solvency) Ratios Show relationship between debt and equity financing in a company  Profitability Tests Relate income to other variables  Market Tests Help assess relative merits of stocks in the marketplace
  • 31. 17-31 Liquidity Ratios Current (working capital) ratio Acid-test (quick) ratio  Cash flow liquidity ratio Accounts receivable turnover Number of days’ sales in accounts receivable Inventory turnover  Total assets turnover 651 10 Ratios You Must Know
  • 32. 17-32 Equity (Long-Term Solvency) Ratios Equity (stockholders’ equity) ratio  Equity to debt 10 Ratios You Must Know
  • 33. 17-33 Profitability Tests  Return on operating assets Net income to net sales (return on sales or “profit margin”) Return on average common stockholders’ equity (ROE)  Cash flow margin Earnings per share  Times interest earned  Times preferred dividends earned 10 Ratios You Must Know
  • 34. 17-34 Market Tests  Earnings yield on common stock Price-earnings ratio  Payout ratio on common stock  Dividend yield on common stock  Dividend yield on preferred stock  Cash flow per share of common stock 10 Ratios You Must Know
  • 35. 17-35 Now, let’s look at Norton Corporation’s 1999 and 1998 financial statements.
  • 36. 17-36 NORTON CORPORATION Balance Sheets December 31, 1999 and 1998 1999 1998 Assets Current assets: Cash 30,000 $ 20,000 $ Accounts receivable, net 20,000 17,000 Inventory 12,000 10,000 Prepaid expenses 3,000 2,000 Total current assets 65,000 49,000 Property and equipment: Land 165,000 123,000 Buildings and equipment, net 116,390 128,000 Total property and equipment 281,390 251,000 Total assets 346,390 $ 300,000 $
  • 37. 17-37 NORTON CORPORATION Balance Sheets December 31, 1999 and 1998 1999 1998 Liabilities and Stockholders' Equity Current liabilities: Accounts payable 39,000 $ 40,000 $ Notes payable, short-term 3,000 2,000 Total current liabilities 42,000 42,000 Long-term liabilities: Notes payable, long-term 70,000 78,000 Total liabilities 112,000 120,000 Stockholders' equity: Common stock, $1 par value 27,400 17,000 Additional paid-in capital 158,100 113,000 Total paid-in capital 185,500 130,000 Retained earnings 48,890 50,000 Total stockholders' equity 234,390 180,000 Total liabilities and stockholders' equity 346,390 $ 300,000 $
  • 38. 17-38 NORTON CORPORATION Income Statements For the Years Ended December 31, 1999 and 1998 1999 1998 Net sales 494,000 $ 450,000 $ Cost of goods sold 140,000 127,000 Gross margin 354,000 323,000 Operating expenses 270,000 249,000 Net operating income 84,000 74,000 Interest expense 7,300 8,000 Net income before taxes 76,700 66,000 Less income taxes (30%) 23,010 19,800 Net income 53,690 $ 46,200 $
  • 39. 17-39 Now, let’s calculate the 10 ratios based on Norton’s financial statements.
  • 40. 17-40 NORTON CORPORATION 1999 Cash 30,000 $ Accounts receivable, net Beginning of year 17,000 End of year 20,000 Inventory Beginning of year 10,000 End of year 12,000 Total current assets 65,000 Total current liabilities 42,000 Sales on account 494,000 Cost of goods sold 140,000 We will use this information to calculate the liquidity ratios for Norton.
  • 41. 17-41 Working Capital* 12/31/99 Current assets 65,000 $ Current liabilities (42,000) Working capital 23,000 $ The excess of current assets over current liabilities. * While this is not a ratio, it does give an indication of a company’s liquidity.
  • 42. 17-42 Current (Working Capital) Ratio Current Ratio 65,000 42,000 = = 1.55 : 1 Measures the ability of the company to pay current debts as they become due. Current Ratio Current Assets Current Liabilities = #1
  • 43. 17-43 Acid-Test (Quick) Ratio Quick Assets Current Liabilities = Acid-Test Ratio Quick assets are Cash, Marketable Securities, Accounts Receivable (net) and current Notes Receivable. #2
  • 44. 17-44 Quick Assets Current Liabilities = Acid-Test Ratio Norton Corporation’s quick assets consist of cash of 30,000 and accounts receivable of 20,000. Acid-Test (Quick) Ratio #2
  • 45. 17-45 Quick Assets Current Liabilities = Acid-Test Ratio 50,000 42,000 = 1.19 : 1 = Acid-Test Ratio Acid-Test (Quick) Ratio #2
  • 46. 17-46 Sales on Account Average Accounts Receivable Accounts Receivable Turnover = Accounts Receivable Turnover = 26.70 times 494,000 (17,000 + 20,000) ÷ 2 Accounts Receivable Turnover = This ratio measures how many times a company converts its receivables into cash each year. #3 Average, net accounts receivable Net, credit sales
  • 47. 17-47 Number of Days’ Sales in Accounts Receivable Measures, on average, how many days it takes to collect an account receivable. Days’ Sales in Accounts Receivables = 365 Days Accounts Receivable Turnover = 13.67 days = 365 Days 26.70 Times Days’ Sales in Accounts Receivables #4
  • 48. 17-48 Number of Days’ Sales in Accounts Receivable In practice, would 45 days be a desirable number of days in receivables? #4 Days’ Sales in Accounts Receivables = 365 Days Accounts Receivable Turnover = 13.67 days = 365 Days 26.70 Times Days’ Sales in Accounts Receivables
  • 49. 17-49 Inventory Turnover Cost of Goods Sold Average Inventory Inventory Turnover = Measures the number of times inventory is sold and replaced during the year. = 12.73 times 140,000 (10,000 + 12,000) ÷ 2 Inventory Turnover = #5
  • 50. 17-50 Inventory Turnover Cost of Goods Sold Average Inventory Inventory Turnover = Would 5 be a desirable number of times for inventory to turnover? = 12.73 times 140,000 (10,000 + 12,000) ÷ 2 Inventory Turnover = #5
  • 51. 17-51 Equity, or Long–Term Solvency Ratios This is part of the information to calculate the equity, or long-term solvency ratios of Norton Corporation. NORTON CORPORATION 1999 Net operating income 84,000 $ Net sales 494,000 Interest expense 7,300 Total stockholders' equity 234,390
  • 52. 17-52 NORTON CORPORATION 1999 Common shares outstanding Beginning of year 17,000 End of year 27,400 Net income 53,690 $ Stockholders' equity Beginning of year 180,000 End of year 234,390 Dividends per share 2 Dec. 31 market price/share 20 Interest expense 7,300 Total assets Beginning of year 300,000 End of year 346,390 Here is the rest of the information we will use.
  • 53. 17-53 Equity Ratio Equity Ratio = Stockholders’ Equity Total Assets Equity Ratio = 234,390 346,390 67.7% = Measures the proportion of total assets provided by stockholders. #6
  • 54. 17-54 Net Income to Net Sales A/K/A Return on Sales or Profit Margin Net Income to Net Sales = Net Income Net Sales Net Income to Net Sales = 53,690 494,000 = 10.9% Measures the proportion of the sales dollar which is retained as profit. #7
  • 55. 17-55 Net Income to Net Sales A/K/A Return on Sales or Profit Margin Net Income to Net Sales = Net Income Net Sales Net Income to Net Sales = 53,690 494,000 = 10.9% Would a 1% return on sales be good? #7
  • 56. 17-56 Return on Average Common Stockholders’ Equity (ROE) Return on Stockholders’ Equity = Net Income Average Common Stockholders’ Equity = 53,690 (180,000 + 234,390) ÷ 2 = 25.9% Return on Stockholders’ Equity Important measure of the income-producing ability of a company. #8
  • 57. 17-57 Earnings per Share Earnings Available to Common Stockholders Weighted-Average Number of Common Shares Outstanding = Earnings per Share 53,690 (17,000 + 27,400) ÷ 2 = = 2.42 The financial press regularly publishes actual and forecasted EPS amounts. #9 Earnings Per Share
  • 58. 17-58  What’s new from Chap. 15? Weighted-average calculation EPS of common stock = _______________________ Earnings available to common stockholders Weighted-average number of common shares outstanding 644  Three alternatives for calculating weighted-average number of shares Earnings Per Share
  • 59. 17-59 EPS of common stock = _______________________ Earnings available to common stockholders Weighted-average number of common shares outstanding 645 Alternate #1 Earnings Per Share  What’s new from Chap. 15? Weighted-average calculation
  • 61. 17-61 ¶ EPS and Stock Dividends or Splits Why restate all prior calculations of EPS? Comparability - i.e., no additional capital was generated by the dividend or split 646 Earnings Per Share ¶ Primary EPS and Fully Diluted EPS APB Opinion No. 15 I mentioned this 17-page pronouncement that required a 100-page explanation in the lecture for chapter 13.
  • 62. 17-62 Price-Earnings Ratio A/K/A P/E Multiple Price-Earnings Ratio Market Price Per Share EPS = Price-Earnings Ratio = 20.00 2.42 = 8.3 : 1 #10 Provides some measure of whether the stock is under or overpriced.
  • 63. 17-63 Important Considerations  Need for comparable data  Data is provided by Dun & Bradstreet, Standard & Poor’s etc.  Must compare by industry  Is EPS comparable?  Influence of external factors  General business conditions  Seasonal nature of business operations  Impact of inflation
  • 64. 17-64 Question The current ratio is a measure of liquidity that is computed by dividing total assets by total liabilities. a. True b. False
  • 65. 17-65 The current ratio is a measure of liquidity that is computed by dividing total assets by total liabilities. a. True b. False Question The current ratio is a measure of liquidity, but is computed by dividing current assets by current liabilities
  • 66. 17-66 Question Quick assets are defined as Cash, Marketable Securities and net receivables. a. True b. False
  • 67. 17-67 Quick assets are defined as Cash, Marketable Securities and net receivables. a. True b. False Question
  • 69. 17-69 About Test #1  Will be challenging because the material covered is challenging  All questions are T/F or M/C Questions are 5-pt., 3-pt. & 1-pt.  No tricks such as patterns in answers Order of answers is random  Coverage is even over the 4 chapters  Time allowed: 75 minutes
  • 70. 17-70 About Test #1  Best way to study  Notes first  Study guide and/or Hermanson tutorials  Calculators will be provided  Must wait outside classroom  Have your questions ready for next actual class  See course home page for office hours