
Recommended
Recommended
More Related Content
Similar to For this assignment, you will complete the Financial Overview compon.docx
Similar to For this assignment, you will complete the Financial Overview compon.docx (20)
More from zebadiahsummers
More from zebadiahsummers (20)
Recently uploaded
Recently uploaded (20)
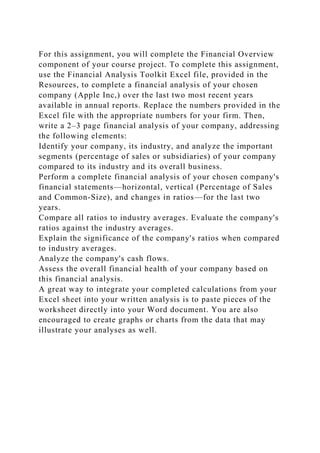
For this assignment, you will complete the Financial Overview compon.docx
- 1. For this assignment, you will complete the Financial Overview component of your course project. To complete this assignment, use the Financial Analysis Toolkit Excel file, provided in the Resources, to complete a financial analysis of your chosen company (Apple Inc,) over the last two most recent years available in annual reports. Replace the numbers provided in the Excel file with the appropriate numbers for your firm. Then, write a 2–3 page financial analysis of your company, addressing the following elements: Identify your company, its industry, and analyze the important segments (percentage of sales or subsidiaries) of your company compared to its industry and its overall business. Perform a complete financial analysis of your chosen company's financial statements—horizontal, vertical (Percentage of Sales and Common-Size), and changes in ratios—for the last two years. Compare all ratios to industry averages. Evaluate the company's ratios against the industry averages. Explain the significance of the company's ratios when compared to industry averages. Analyze the company's cash flows. Assess the overall financial health of your company based on this financial analysis. A great way to integrate your completed calculations from your Excel sheet into your written analysis is to paste pieces of the worksheet directly into your Word document. You are also encouraged to create graphs or charts from the data that may illustrate your analyses as well.
- 2. Tool Kit for Analysis of Financial Statements Financial statements are analyzed by calculating certain key ratios and then comparing them with the ratios of other firms and by examining the trends in ratios over time. We can also combine ratios to make the analysis more revealing, those indicated below are exceptionally useful for this type of analysis.
- 3. RATIO ANALYSIS (Section 3.1) *NVIDIA Fiscal Years starts and ends on Jan 31, such that FY13 represents Jan 31,2012 to Jan31, 2013 Input Data:
- 4. 2013 2012 Year-end common stock price $12.26 $13.86 Year-end shares outstanding (in thousands) 616,756 612,191 Tax rate 15% 12% After-tax cost of capital
- 5. Lease payments (in thousands) $18,998 $21,439 Required sinking fund payments $0 $0 Balance Sheets
- 6. (in thousands of dollars) Assets 2013 2012 Cash and equivalents $906,223 $767,218 * Added to cash and quivalents prepaid expense and deferred income taxes
- 7. Short-term investments $2,995,097 $2,461,700 2013 2012 Accounts receivable $454,252 $336,143 69,701 49,411 prepaid expenses and other Inventories $419,686 $340,297 103,736 49,931 deferred income taxes Total current assets $4,775,258 $3,905,358 Net plant and equipment
- 8. $1,636,987 $1,647,570 * In addition to equpment also includes goodwill, intangible assets, and other assets Total assets $6,412,245 $5,552,928 2013 2012 641,030 641,030 goodwill Liabilities and equity 312,332 326,136 intangible assets Accounts payable $356,428 $335,072
- 9. 107,481 120,332 other assets Notes payable $0 $0 Accruals $619,795 $594,886 Total current liabilities $976,223 $929,958 Long-term bonds $608,319 $477,246
- 10. 2013 2012 Total liabilities $1,584,542 $1,407,204 3,193,623 2,900,896 additional paid-in capital Preferred stock (2,00,000 shares: none issued) $0 $0 -1,622,709 -1,496,904 treasury stock Common stock (616,756,134 shares oustanding 2013 and 612,191,412 outstanding in 2012 $720 $700 9981 10,614 accumulated other comprehensive income Retained earnings $3,246,088 $2,730,418
- 11. Total common equity $4,827,703 $4,145,724 * Added to Total Common equity additional paid-in capital, treasuary stock, and accumulated other comprehensive income Total liabilities and equity $6,412,245 $5,552,928 Income Statements (in thousands of dollars)
- 12. 2013 2012 Net sales $4,280,159.0 $3,997,930.0 Operating costs $3,631,920.0 $3,349,631.0 Earnings before interest, taxes, depr. & amort. (EBITDA) $648,239.0 $648,299.0
- 13. Depreciation $0.0 $0.0 Amortization $0.0 $0.0 Depreciation and amortization $0.0 $0.0 Earnings before interest and taxes (EBIT) $648,239.0 $648,299.0
- 14. Less interest -$13,800.0 -$15,097.0 Earnings before taxes (EBT) $662,039.0 $663,396.0 Taxes (15.0%, 12.4%) $99,503.0 $82,306.0 Net income before preferred dividends $562,536.0 $581,090.0
- 15. Preferred dividends $0.0 $0.0 Net income available to common stockholders $562,536.0 $581,090.0 Common dividends $0.0 $0.0 Addition to retained earnings $562,536.0 $581,090.0
- 16. Calculated Data: Operating Performance and Cash Flows 2013 2012 Net operating working capital (NOWC) $803,938.0 $513,700.0 Total operating capital $2,440,925.0
- 17. $2,161,270.0 Net Operating Profit After Taxes (NOPAT) $551,003.2 $567,909.9 Net Cash Flow (Net income + Depreciation) $562,536.0 $581,090.0 Operating Cash Flow (OCF) $551,003.2 $567,909.9 Free Cash Flow (FCF) $271,348.2 N/A
- 18. Calculated Data: Per-share Information 2013 2012 Earnings per share (EPS) $0.91 $0.95 Dividends per share (DPS)
- 19. $0.00 $0.00 Book value per share (BVPS) $7.83 $6.77 Cash flow per share (CFPS) $0.91 $0.95 Free cash flow per share (FCFPS) $0.44 N/A
- 20. LIQUIDITY RATIOS (Section 3.2) Industry 2013 2012 Average Liquidity ratios Current Ratio 4.89 4.20 2.22
- 21. Quick Ratio 4.46 3.83 1.3 ASSET MANAGEMENT RATIOS (Section 3.3) Industry 2013 2012 Average
- 22. Asset Management ratios Inventory Turnover 10.20 11.75 4.78 Days Sales Outstanding 38.7 30.69 25.6 *Industry leader Fixed Asset Turnover 2.61 2.43 1.89
- 23. *Industry leader Total Asset Turnover 0.67 0.72 0.63 DEBT MANAGEMENT RATIOS (Section 3.4) Industry 2013 2012 Average
- 24. Debt Management ratios Debt Ratio 24.71% 25.34% 39.30% *Industry leader Debt-to-Equity Ratio 0.33 0.34 0.65 *Industry leader Market Debt Ratio 17.33% 14.23% 24.40 *Industry leader Times Interest Earned
- 25. 46.97 42.94 196.79 *Incorrect for 2013 and 2012 as interest combined is income not expense EBITDA Coverage Ratio 128.36 105.60 N/A PROFITABILITY RATIOS (Section 3.5) Industry 2013 2012
- 26. Average Profitability ratios Profit Margin 13.14% 14.53% 19.96% Basic Earning Power 10.11% 11.67% 17.63% *Industry leader Return on Assets 8.77%
- 27. 10.46% 12.56% Return on Equity 11.65% 14.02% 19.43% MARKET VALUE RATIOS (Section 3.6) Industry 2013
- 28. 2012 Average Market Value ratios Price-to Earnings Ratio 13.44 14.60 25.77 *NVIDIA doesn't account for depreciation in their 10-K statements Same P/E P/CF Ratio because there is no depreciation Price-to-Cash Flow Ratio 13.44 14.60 9.66 Price-to-EBITDA 11.66 13.09
- 29. 5.13 *Industry Leader Market-to-Book Ratio 1.57 2.05 3.59 TREND ANALYSIS, COMMON SIZE ANALYSIS, AND PERCENT CHANGE ANALYSIS (Section 3.7)
- 30. TREND ANALYSIS Trend analysis allows you to see how a firm's results are changing over time. For instance, a firm's ROE may be slightly below the benchmark, but if it has been steadily rising over the past four years, that should be seen as a good sign. A trend analysis and graph have been constructed on this data regarding Nvidia's ROE over the past 5 years. (Nvidia and indusry average data for earlier years has been provided.)
- 33. Figure 3-1 Rate of Return on Common Equity
- 40. In common size income statements, all items for a year are divided by the sales for that year. Figure 3-2 Common Size Income Statements Industry Composite Nvidia 2013
- 41. 2013 2012 Net sales 100.0% 100.0% 100.0% Operating costs 72.1% 84.9% 83.8% Earnings before interest, taxes, depr. & amort. (EBITDA) 27.9% 15.1% 16.2% Depreciation and amortization 0.0% 0.0%
- 42. 0.0% Earnings before interest and taxes (EBIT) 27.9% 15.1% 16.2% Less interest 0.0% -0.3% -0.4% Earnings before taxes (EBT) 27.9% 15.5% 16.6% Taxes (15.0%, 12.4%) 7.3% 2.3% 2.1%
- 43. Net income before preferred dividends 20.6% 13.1% 14.5% Preferred dividends 0.0% 0.0% 0.0% Net income available to common stockholders (profit margin) 20.6% 13.1% 14.5%
- 44. In common sheets, all items for a year are divided by the total assets for that year. Figure 3-3 Common Size Balance Sheets Industry Composite
- 45. Nvidia 2013 2013 2012 Assets Cash and equivalents 13.0% 14.1% 13.8% Short-term investments 11.5% 46.7% 44.3%
- 46. Accounts receivable 7.1% 7.1% 6.1% Inventories 5.6% 6.5% 6.1% Total current assets 37.2% 74.5% 70.3% Net plant and equipment 62.8% 25.5% 29.7%
- 47. Total assets 100.0% 100.0% 100.0% Liabilities and equity Accounts payable 12.6% 5.6% 6.0%
- 48. Notes payable 0.4% 0.0% 0.0% Accruals 2.3% 9.7% 10.7% Total current liabilities 15.3% 15.2% 16.7% Long-term bonds 61.1% 9.5% 8.6%
- 49. Total liabilities 76.4% 24.7% 25.3% Preferred stock 0.0% 0.0% 0.0% Total common equity 23.6% 75.3% 74.7% Total liabilities and equity 100.0% 100.0% 100.0%
- 50. PERCENT CHANGE ANALYSIS In percent change analysis, all items are divided by the that item's value in the beginning, or base, year.
- 51. Figure 3-4 Income Statement Percent Change Analysis Base year = 2012 Percent Change in 2013
- 52. Net sales 7.1% Operating costs 8.4% Earnings before interest, taxes, depr. & amort. (EBITDA) (0.0%) Depreciation and amortization 0.0%
- 53. Earnings before interest and taxes (EBIT) (0.0%) Less interest (8.6%) Earnings before taxes (EBT) (0.2%) Taxes (15.0%, 12.4%) 20.9% Net income before preferred dividends
- 54. (3.2%) Preferred dividends 0.0% Net income available to common stockholders (3.2%)
- 55. Balance Sheet Percent Change Analysis (not in textbook) Base year = 2012 Percent Change in 2013 Assets
- 56. Cash and equivalents 18.1% Short-term investments 21.7% Accounts receivable 35.1% Inventories 23.3%
- 57. Total current assets 22.3% Net plant and equipment -0.6% Total assets 15.5% Liabilities and equity
- 58. Accounts payable 6.4% Notes payable 0.0% Accruals 4.2% Total current liabilities
- 59. 5.0% Long-term bonds 27.5% Total liabilities 12.6% Preferred stock (2,00,000 shares: none issued) 0.0% Common stock (616,756,134 shares oustanding 2013 and 612,191,412 outstanding in 2012 2.9%
- 60. Retained earnings 18.9% Total common equity 16.5% Total liabilities and equity 15.5%
- 61. DU PONT ANALYSIS (Section 3.8) ROE = (Profit margin) (TA turnover) (Equity Multiplier) Nvidia 2013 11.65% 13.14% 0.67