Characterizing the freeze–drying behavior of model protein formulations
•
0 likes•1,534 views

1) The document examines the freeze-drying behavior of three model proteins (lysozyme, BSA, IgG) under different conditions using various characterization techniques. 2) It finds some differences in freeze-drying behavior between the proteins at higher concentrations where the proteins influence the formulation more, but the differences are minimized at lower concentrations where excipients dominate. 3) Differences in cake morphology were seen between drying conditions and proteins, but protein structure and stability were equivalent for cakes made using different drying conditions.

Recommended
More Related Content
What's hot
What's hot (20)
Viewers also liked
Viewers also liked (14)
Similar to Characterizing the freeze–drying behavior of model protein formulations
Similar to Characterizing the freeze–drying behavior of model protein formulations (20)
Recently uploaded
Recently uploaded (20)
Characterizing the freeze–drying behavior of model protein formulations
- 1. AAPS PharmSciTech, Vol. 11, No. 4, December 2010 ( # 2010) DOI: 10.1208/s12249-010-9530-9 Research Article Theme: Sterile Products: Advances and Challenges in Formulation, Manufacturing, Devices and Regulatory Aspects Guest Editors: Lavinia Lewis, Jim Agalloco, Bill Lambert, Russell Madsen, and Mark Staples Characterizing the Freeze–Drying Behavior of Model Protein Formulations Lavinia M. Lewis,1,3 Robert E. Johnson,1 Megan E. Oldroyd,1 Saleem S. Ahmed,1 Liji Joseph,1 Ilie Saracovan,2 and Sandipan Sinha1 Received 24 April 2010; accepted 13 October 2010; published online 6 November 2010 Abstract. The freeze–drying behavior of three model proteins, namely, lysozyme, BSA, and IgG, has been studied using a variety of techniques under two different primary drying conditions (shelf temperatures of −25°C and +25°C, respectively) in an amorphous formulation. Manometric temperature measurements were used to characterize product temperature (Tpr), sublimation rates, and product resistance (Rp) during primary drying. Biophysical techniques such as circular dichroism, fluorescence, and Fourier transform infrared spectroscopy were used to study protein conformation. Size exclusion chromatography was used to monitor the formation of high-molecular-weight species (HMWS) over time on storage, and cake morphology was studied using scanning electron microscopy. The differences in the freeze–drying behavior of the three proteins were more evident at higher protein concentrations, where the protein significantly influences the behavior of the formulation matrix. However, these differences were minimized in the aggressive mode and were insignificant at lower protein concentrations where excipients dominated the freeze–drying behavior. Differences in cake morphology were observed between the two drying conditions employed as well as between the three proteins studied. The stability and the protein structure, however, were equivalent for the protein cakes generated using the two different primary drying conditions. KEY WORDS: freeze drying; manometric temperature measurements; micro-collapse; product resistance; proteins. 0 0 INTRODUCTION the Tg of the formulation, with Tg being the temperature above which the amorphous phase of the frozen solution Freeze–drying is a popular choice for the manufacture changes from a glassy to a rubbery state and viscous flow of protein drug products despite its higher cost because becomes possible (1–4). lyophilized proteins have excellent stability on storage. The There has been recent interest, however, in lyophilizing higher cost is primarily due to the lyophilization process; proteins in amorphous formulations at or above their hence, efforts are often invested in minimizing the freeze– collapse temperatures (5–8). These aggressive freeze–drying drying cycle time without compromising product quality. cycles have been shown to produce stable drug products Primary drying is the rate-limiting step in the freeze–drying with little sign of visual or “macro” collapse, so the concept cycle, and one way of shortening the cycle time is to raise of a “micro-collapsed” state has been introduced (9,10). This the shelf temperature during primary drying while taking gap between the visual “macro” collapse temperature care to keep the product temperature below the collapse (Tcmacro) and the onset of “micro” collapse (Tcmicro) seen temperature (Tc) for amorphous formulations or below the in the freeze–dry microscope is usually only 2°C or 3°C for eutectic point (Te) for crystalline formulations (1–4). The placebo (formulation containing excipients but no protein) collapse temperature is typically determined by the use of a or low protein concentrations, but can widen to 10°C or freeze–dry microscope and is usually a few degrees above 15°C at moderate or high protein concentrations (5–8). In addition, freeze–drying in the “micro-collapsed” state using a model protein (bovine serum albumin, BSA) has been found to increase the size of the pores in the dry layer and reduce their tortuosity, resulting in a low resistance to the 1 flow of water vapor, which does not increase with dry layer Global Biologics, Pfizer Inc., 700 Chesterfield Parkway, Mail Stop AA5I, Chesterfield, Missouri 63017, USA. thickness (5). 2 Groton Laboratories, Pfizer Inc., Eastern Point Road, Groton, This paper explores the freeze–drying behavior of three Connecticut 06340, USA. proteins, namely, lysozyme, BSA, and IgG, in an amorphous 3 To whom correspondence should be addressed. (e-mail: lavinia.m. formulation at two different concentrations when subjected lewis@pfizer.com) to different primary drying conditions (conservative drying 1530-9932/10/0400-1580/0 # 2010 American Association of Pharmaceutical Scientists 1580
- 2. Freeze–Drying Behavior of Model Protein Formulations 1581 with a low primary drying shelf temperature of −25°C and within the stage, and then heated to 0°C at a rate of 1°C/min, aggressive drying with a high primary drying shelf temper- with pictures taken at 1-s intervals. ature of +25°C). These three model proteins differ substan- tially in shape, molecular weight, and the relative amounts Freeze–Drying Procedure of α-helix and β-sheet. In particular, manometric temper- ature measurements (MTM) measurements have been used A volume of 1 mL of solution was filled into 2-mL glass to characterize product temperature (Tpr), sublimation vials (fill depth = 0.75 cm) and partially stoppered with 13- rates, and product resistance (Rp) during primary drying. mm Lyo stoppers. Lyophilization cycles were performed in a Stability of the different protein cakes has been evaluated by LyoStar II freeze dryer (SP Industries, Stone Ridge, NY) in size exclusion chromatography (SEC), protein structure has the auto-MTM mode. Calibrated 36-gauge thermocouples been studied using a variety of biophysical techniques, and (OMEGA, Newport, CT) were placed bottom center (the tip SEM has been used to study the morphology of the dried touching the vial bottom) in both edge and center vials. cakes. The aim of this paper was to understand whether Cycles were performed with the following initial freezing differences or similarities exist in the freeze–drying behavior procedure: ramp from room temperature to −45°C (ramp of the three proteins at different drying conditions. rate, 1°C/min), hold for 2 h, ramp to −20°C (1°C/min), and hold for 1 h (annealing step), return to −45°C, and maintain- MATERIALS AND METHODS ing shelf temperature for another 2 h. Primary drying was conducted at chamber pressures (Pc) of 57 mTorr and shelf Materials temperatures (Ts) of −25°C and +25°C. The Pc setting was maintained constant during primary and secondary drying. BSA, Fraction V (99% pure), was obtained from Sigma The primary drying duration for the conservative cycle was Chemical Company (St. Louis, MO). The monoclonal anti- set at 4,000 min for BSA and 3,000 min for IgG and body (IgG) used in this study was obtained from Pfizer. All lysozyme. The primary drying duration for the aggressive solutions contained 25 mg/mL sucrose and 6 mM sodium cycle was set at 1,500 min for BSA and 1,000 min for IgG phosphate (pH 7.4). All formulation buffer components were and lysozyme. The experiments were first conducted with multicompendial grade. Sodium phosphate dibasic, heptahy- BSA, and based on the duration it took to dry BSA, the drate, and sodium phosphate monobasic dihydrate were programmed drying times were modified for lysozyme and obtained from J. T. Baker and sucrose from Ferro Pfanstiehl. IgG. Secondary drying was performed at a shelf temper- Lyophilization was performed using 2-mL type 1 tubing vials ature of 40°C for 10 h (1°C/min ramp rate). Auto-MTM (Wheaton Science Products, Millville, NJ) and 13-mm Daikyo runs were done with a row of empty vials around the edge 777-1 lyo stoppers with Flurotec coating (West Pharmaceutical of the tray and aluminum foil covering the door (11). Services Inc., Lionville, PA). Three thermocouple probes were used and all were placed in the center of the load. The probes (from LyoStar) are calibrated once a year. Modulated Differential Scanning Calorimetry Scanning Electron Microscopy All thermograms were acquired on a DSC Q1000 series (TA Instruments, New Castle, Delaware) in the modulated The cakes were extracted intact from the vial by carefully mode (amplitude, 0.75°C; period, 30 s) with an autosampler cutting the vial with a sharp diamond tip around the circum- and a refrigerated cooling system. Approximately 20 μL of ference about 2–3 mm above the cake. The cake was then the solution was weighed into an aluminum pan and hermeti- freed on a clean cutting mat. A sharp blade was used to slice cally sealed with an aluminum cover. Samples were cooled to the cake along the cylinder axis; only the cake surface −60°C at a rate of 2°C/min and then heated to 25°C at a rate untouched by the blade was used for SEM examination. An 0 of 2°C/min. Midpoint Tg of the samples was determined ASPEX VP SEM instrument (ASPEX Corp., Delmont, PA) using TA Instruments Universal Analysis software (version was used for investigating the cake morphology. All samples 4.5A). The solid cake samples were prepared in the glove box were scanned at an accelerated voltage of 17–20 kV and a and heated to 150°C at a rate of 2°C/minute. Midpoint Tg of working distance of 10–12 mm. In order to preserve the the samples was determined using TA Instruments Universal native morphology of the cake surface, no conductive coating Analysis software (version 4.5A). was applied to the specimens. Consequently, all specimens were examined under variable pressure mode at 0.1–0.15 torr Freeze–Dry Microscopy and by using exclusively the backscattered electron detector. Images for record were collected at a scanning rate of 128 ms Liquid samples were tested using an Olympus BX51 per pixel. microscope with a Linkam FDCS196 stage (Linkam Scientific Instruments, Surrey, UK). Images were recorded using a Circular Dichroism Pixelink PF-4662 camera attachment. A 0.5 μL sample was placed between a 10-mm glass coverslip and a 20-mm quartz Far-UV circular dichroism (CD) analysis was performed slide which was placed on top of a silver block with a few on the reconstituted protein solutions to compare the microliters of silicon oil to ensure good thermal contact and secondary structural characteristics of the proteins. Data were then sealed within the vacuum stage. Samples were cooled to collected on a Chirascan Applied Biophysics spectropolarim- −50°C at a rate of 5°C/min, a vacuum (<10 mTorr) established eter in the 260- to 190-nm range using a bandwidth of 1.0 nm
- 3. 1582 Lewis et al. and cell path length of 2 mm at 25°C. The reported spectra RESULTS were corrected for buffer contribution and expressed as mean residue ellipticity (degcm2 dmol−1) as a function of wavelength (nm). Properties Relevant to Freeze–Drying for Model Protein Formulations Fluorescence Spectroscopy Table I tabulates the relevant freeze–drying properties of the three model proteins, namely, lysozyme, BSA, and IgG, in Intrinsic fluorescence data were collected on a Varian sucrose formulations where the concentration of sucrose was Eclipse Spectroflurometer to compare the tertiary structure maintained at 25 mg/mL in 6 mM phosphate buffer and the of the reconstituted protein solutions. Tryptophans were protein concentration was either fixed at 5 or 20 mg/mL. The 0 excited at 295 nm and emission spectra were recorded Tg value for the 5 mg/mL protein cakes was −33°C and very between 300 and 400 nm at 25°C using a 10-mm path length similar to the value (−34°C) obtained for placebo (0 mg/mL cell. All spectra were corrected for buffer contributions protein, 25 mg/mL sucrose in 6 mM phosphate buffer) followed by concentration normalization. formulation. The addition of 20 mg/mL protein to the placebo 0 increased the Tg value from −34°C to approximately −29°C (about 4–5°C higher than the placebo). It should be noted Fourier Transform Infrared 0 that no difference in Tg values was found between protein type at 5 mg/mL where the protein accounts for 16% of the FTIR spectra were collected for the solid protein cakes cake composition and the freeze–drying properties are on a Bomem MB series equipped with a DTGS detector. A dominated by the excipients (mainly sucrose), which form single-bounce diamond crystal ATR setup (Spectra-Tech) was 84% of the cake. In the case of cakes containing 20 mg/mL used for running the lyophilized samples. The sample protein, the protein is 44% of the cake composition and chamber was purged with dry nitrogen to eliminate uptake influences the freeze–drying properties significantly. How- of water vapor. Solid samples were pressed down on top of ever, even at this concentration, no significant differences the diamond crystal with the in-built apparatus to ensure 0 between Tg were observed between the three proteins. sufficient contact between the solid and the crystal. A total of Freeze–drying microscopy was used to determine Tcmicro 64 scans were acquired at a resolution of 4 cm−1. Data (the temperature at which the freeze–drying front begins to analysis was performed using the GRAMS/AI 32 (version first exhibit holes and channels) and Tcmacro (the temperature 7.0) software. The background spectrum was subtracted from at which the freeze–drying front completely collapses). There the raw spectra to obtain the absorbance spectra. A second is a 3°C difference between Tcmicro and Tcmacro for all proteins derivative spectrum was obtained using the Sav–Golay at 5 mg/mL. This window, however, is wider at 20 mg/mL, function followed by baseline and offset correction and was with the difference between Tcmicro and Tcmacro approximating area normalized for direct comparison between proteins. 10°C for lysozyme, 13°C for BSA, and 9°C for IgG (Table I). It has been shown before by us and others (5,6,8,12) that for 0 Size Exclusion Chromatography any given protein, both the Tg and the window between Tcmicro and Tcmacro increases with increasing protein concen- Formation of high-molecular-weight species (HMWS) tration, and the same holds true in this study. was measured by SEC-HPLC using an Agilent 1100 system The Tg values of the solid cakes for any given protein equipped with G3000SWXL and G2000SWXL columns in were similar irrespective of the primary drying temperature series. The detection wavelength was 214 nm using a diode employed (data not shown) and show a significant increase array detector and a nominal protein concentration of 1 mg/ upon the addition of protein to the sucrose-containing cake. mL. The protein was eluted isocratically with a 200 mM The Tg values in Table I are an average of the Tg values of sodium phosphate (pH 7.0) mobile phase at a flow rate of the cakes obtained under the two primary drying conditions 0.7 mL/min. employed in this study (namely, aggressive with Ts = +25°C Table I. Data on Formulation Properties Relevant to Freeze–Drying for the Three Model Proteins 0 Protein Tg (°C) Tcmicro (°C) Tcmacro (°C) Tga (°C) MCb (%) MCc (%) 0 mg/mL (placebo) −34 −32 −29 65 0.7 0.59 5 mg/mL Lysozyme −33 −31.5 −29 85 0.42 0.60 20 mg/mL Lysozyme −30.3 −27.4 −17 96 0.30 0.18 5 mg/mL BSA −33 −31 −28 87 0.31 0.43 20 mg/mL BSA −29 −27 −14 102 0.15 0.21 5 mg/mL IgG −33.5 −32 −29 84 0.31 0.11 20 mg/mL IgG −29.3 −30 −21 107 0.27 0.13 All protein formulations are in 6 mM phosphate buffer containing 25 mg/mL sucrose Tg' glass transition temperature of the frozen matrix, Tcmicro temperature of onset of collapse, Tcmacro temperature at which complete collapse is observed under the freeze–drying microscope, Tg glass transition temperature of the solid matrix, MC moisture content a Value represents the average of the values obtained for cakes under both primary drying conditions b Ts =−25°C during primary drying c Ts =+25°C during primary drying
- 4. Freeze–Drying Behavior of Model Protein Formulations 1583 Table II. Product Temperature, Sublimation Rates, and Time Taken to Complete Primary Drying for the Three Model Proteins at 5 mg/mL in the Conservative and Aggressive Cycles Time to Time to Tpr (TC)a Tpr (TC)a Tpr (TbMTM)a Tpr (TbMTM)a dm/dta dm/dta complete PD complete PD Protein Ts =−25°C Ts =+25°C Ts =−25°C Ts =+25°C Ts =−25°C Ts =+25°C Ts =−25°C Ts =+25°C 0 mg/mL (placebo) −37.5 −32.4 −38.1 −33.4 0.040 0.17 22.5 (TC) 8.6 (TC) 27.4 (PG) 10.2 (PG) 5 mg/mL Lysozyme −35.7 −31.03 −36.3 −31.1 0.038 0.17 25.6 (TC) 9.5 (TC) 32.3 (PG) 9.8 (PG) 5 mg/mL BSA −35.9 −30.5 −36.5 −30.7 0.036 0.16 26.2 (TC) 9.8 (TC) 29.9 (PG) 9.9 (PG) 5 mg/mL IgG −37.1 −29.9 −37.5 −30.5 0.033 0.15 27.9 (TC) 9.6 (TC) 29.0 (PG) 9.2 (PG) Runs were carried out in the AutoMTM mode, in Lyostar II, and all formulations are in 6 mM phosphate buffer containing 25 mg/mL sucrose. Shelf temperatures during PD were maintained constant at −25°C and +25°C. The time to complete primary drying (in hours) was determined both by average TC data placed bottom center in the center of the batch as well as PG data. Measured Tcmicro values for 5 mg/mL lysozyme, BSA, and IgG are −31.5°C, −31°C, and −32°C, respectively Ts shelf inlet temperature, dm/dt sublimation rate (g/h per vial), TbMTM product temperature at the vial bottom (°C), Tpr product temperature (°C), TC thermocouple, PD primary drying a Average value obtained during steady-state primary drying but limited to the region where MTM data are valid and conservative with Ts =−25°C). The Tg values were similar estimation of product temperature at the bottom of the vial irrespective of the protein type for the 5 mg/mL protein cakes along with the sublimation rates and product resistance (Rp) and increased by at least 20°C from the placebo cakes (from for the two cycle conditions used in this study. Tables II and III 65°C for the placebo to approximately 85°C for the protein- summarize the product temperature (Tpr) obtained using containing cakes). The Tg values for the cakes containing thermocouples (TC), the MTM estimated temperature at the 20 mg/mL protein also increased significantly from the vial bottom (TbMTM), the estimated sublimation rate, and the placebo cake, with the highest increase being observed for time taken to complete primary drying for the 5 and 20 mg/mL IgG (42°C) and the lowest for lysozyme (31°C). The moisture protein formulations, respectively. There is a good agreement in content of all the cakes was well below 1.0% for both the the steady-state primary drying product temperatures obtained aggressively and conservatively dried cakes. by TC and TbMTM, with the estimated temperatures being slightly lower than the actual temperatures for any given protein Application of MTM to Characterize the Drying Behavior under both drying conditions. of Model Proteins As seen in Table II, the product temperature (as measured by TC and TbMTM) during steady-state primary Manometric temperature measurements in the auto- drying in the aggressive cycle for the 5-mg/mL formulations is MTM mode in the Lyostar II lyophilizer enabled the higher than the product temperature in the conservative Table III. Product Temperature, Sublimation Rates, and Time Taken to Complete Primary Drying for the Three Model Proteins at 20 mg/mL in the Conservative and Aggressive Cycles Time to Time to Tpr (TC)a Tpr (TC)a Tpr (TbMTM)a Tpr (TbMTM)a dm/dta dm/dta complete PD complete PD Protein Ts =−25°C Ts =+25°C Ts =−25°C Ts =+25°C Ts =−25°C Ts =+25°C Ts =−25°C Ts =+25°C 0 mg/mL (placebo) −37.5 −32.4 −38.1 −33.4 0.040 0.17 22.5 (TC) 8.6 (TC) 27.4 (PG) 10.2 (PG) 20 mg/mL Lysozyme −36.2 −26.2 −36.9 −27.6 0.034 0.14 28.2 (TC) 9.6 (TC) 32.4 (PG) 9.4 (PG) 20 mg/mL BSA −36.0 −25.2 −36.7 −26.5 0.033 0.13 34 (TC) 10.3 (TC) 43.8 (PG) 10.8 (PG) 20 mg/mL IgG −37 −25.3 −37.3 −26.6 0.031 0.12 35.8 (TC) 12.3 (TC) 44 (PG) 12.6 (PG) Runs were carried out in the auto-MTM mode, in Lyostar II, and all formulations are in 6 mM phosphate buffer containing 25 mg/mL sucrose. Shelf temperatures during PD were maintained constant at −25°C and +25°C. The time to complete primary drying (in hours) was determined both by average TC data placed bottom center in the center of the batch as well as PG data. Measured Tcmicro values for 20 mg/mL lysozyme, BSA, and IgG are −27.4°C, −27°C, and −30°C, respectively Ts shelf inlet temperature, dm/dt sublimation rate (g/h per vial), TbMTM product temperature at the vial bottom (°C), Tpr product temperature (°C), TC thermocouple, PD primary drying a Average value obtained during steady state primary drying but limited to region where MTM data are valid
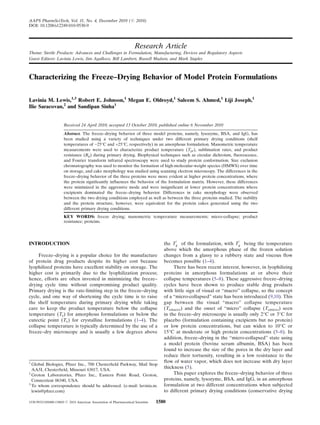
- 5. 1584 Lewis et al. the placebo. The time taken to complete primary drying (as measured by the time it takes the thermocouples to reach shelf temperature) for the different proteins in the aggressive cycle ranges between 8 and 12 h and in the conservative cycle ranges between 28 and 36 h depending on the type of protein. The time to complete primary drying based on the Pirani gauge (PG) measurement is very similar to the TC estimates in the aggressive cycle, but deviates significantly in the conservative cycle. Deviations between the TC and Prani gauge readings are likely due to the presence of insulated ice slabs in the product (13). This deviation or difference in PD time estimates between TC and PG is smaller for lysozyme (4.2-h difference between TC and PG) and about 8–9 h for BSA and IgG. Between the three proteins, lysozyme for- mulations dried the fastest at 20 mg/mL in both cycles. MTM measurements allow the estimation of product resistance (Rp) as a function of dry layer thickness (DLT). As seen in Fig. 1, for the 5 mg/mL protein formulations, the Rp increases as a function of dry layer thickness in the conservative cycle, but is independent of DLT in the aggressive mode, as observed by Overcashier et al. (10) and Milton et al. (9). It is also interesting to note that at 5 mg/mL (where excipients dominate the drying behavior), the three proteins exhibit similar product resistance irrespective of the primary drying conditions employed. However, differences between proteins become more evident for the 20-mg/mL protein formulations where the protein is now 44% of the Fig. 1. Calculated product resistance as a function of dry layer cake composition (Fig. 2). Lysozyme cakes exhibit the lowest thickness for the three proteins at 5 mg/mL in the conservative Rp values when compared to BSA and IgG, which appear to (Ts =−25°C; top panel, solid symbols) and aggressive (Ts =+25°C; have similar Rp values. The difference in Rp values are more bottom panel, open symbols) cycles. Triangles represent IgG, circles represent BSA, and squares represent lysozyme cycles. This difference is at least 5°C for the placebo, lysozyme, and BSA and around 7°C for IgG between the two cycles. In the conservative cycle, the Tpr is 4°C below Tcmicro, and in the aggressive mode, it is at or 2–3°C above Tcmicro (Tables I and II). The sublimation rates in the aggressive cycles are also four to five times higher when compared to the conservative cycles for all the protein formulations (at 5 mg/mL) including the placebo. The time taken to complete primary drying for the different proteins in the aggressive cycle ranges between 9 and 10 h, and in the conservative cycle, it ranges between 26 and 28 h, as measured by the time it take thermocouples to reach shelf temperature. The time to complete primary drying based on the Pirani gauge measurements is similar to the TC estimates in the aggressive cycle and differs by a few hours in the conservative cycle. As seen in Table III, the product temperature (as measured by TC and TbMTM) in the aggressive cycle for the 20-mg/mL formulations is higher than the product temper- ature in the conservative cycles. This difference in Tpr is 10– 11°C for lysozyme and BSA, respectively, and around 12°C for IgG between the two cycles. In the conservative cycle, the Tpr is 6–7°C below Tcmicro and in the aggressive mode is at the Fig. 2. Calculated product resistance as a function of dry layer edge of Tcmicro, except IgG which is 5°C above Tcmicro thickness for the three proteins at 20 mg/mL in the conservative (Tables I and III). The sublimation rates in the aggressive (Ts =−25°C; top panel, solid symbols) and aggressive (Ts =+25°C; cycles are also four times higher when compared to the bottom panel, open symbols) cycles. Triangles represent IgG, circles conservative cycles for all the protein formulations including represent BSA, and squares represent lysozyme
- 6. Freeze–Drying Behavior of Model Protein Formulations 1585 significant between the three proteins in the conservative mode at 20 mg/mL compared to the aggressive mode (Fig. 2). It should be noted that even for the 20 mg/mL formulations, the estimated Rp values in the conservative mode increase monotonically as a function of DLT, but are independent of DLT in the aggressive mode as observed for the 5-mg/mL formulations (Figs. 1 and 2). Effect of Drying on Protein Conformation and Stability SEC was used to monitor the formation of HMWS as a function of time after storage at three different storage temperatures, namely, 5°C, 25°C, and 40°C. No differences were observed in the formation of high-molecular-weight species for the cakes dried aggressively and conservatively after 13 weeks. This was true for all storage temperatures for the three proteins at both concentrations from time 0 to 13 weeks (data not shown). Figure 3 shows the formation of HMWS for the three proteins at different concentrations after 13 weeks of storage at 40°C. It is interesting to note that the %HMWS is different for IgG at 5 and 20 mg/mL, but is similar for lysozyme and BSA. This probably implies that different proteins need different sucrose-to-protein ratios to achieve the desired level of cryoprotection (14,15). The sucrose-to-protein ratio employed in this study was 4 for the lower protein loading and 1.25 for the higher protein loading. There are different opinions in the literature regarding the stability of proteins in the micro-collapsed state. Some studies have shown that freeze–drying above the collapse temper- ature does not impact protein stability (16–18). However, Passot et al. (19) presented data that toxins can lose antigenic activity after 6 months of storage when primary drying was 0 performed at a product temperature higher than Tg . This was observed for both partially crystalline and completely amor- phous formulations. Biophysical analyses were performed to evaluate the effect of lyophilization on protein structure. Circular dichro- ism and fluorescence were performed on the reconstituted solution while FTIR was performed on the solid cake. No differences were observed in the reconstitution time between the aggressively and conservatively dried cakes for any given protein. All three protein cakes, irrespective of the drying condition employed, reconstituted within 10 s. Typical CD and FTIR spectra were obtained for lysozyme, BSA, and IgG as observed in the literature (20– Fig. 3. High-molecular-weight species (HMWS) formation for the 22). Figure 4 shows six panels representing the CD spectra of different protein cakes after storage at 40°C for 3 months. Black bars reconstituted solutions at 5 and 20 mg/mL for each protein represent cakes dried aggressively (Ts = +25°C) and gray bars type. Each panel has two overlaid CD spectra representing represent cakes dried conservatively (Ts =−25°C) aggressive and conservative primary drying. The CD spectra (Fig. 4a, b) for lysozyme show both α-helical (strong negative band at 208 nm and weaker band at 222 nm) and β-sheet the solid cakes for the different proteins are shown in Fig. 5, structures (weak band at 218 nm). Strong negative bands at with the six panels representing the absorbance spectra of 222 and 208 nm in the CD spectra for BSA (Fig. 4c, d) show reconstituted solutions at 5 and 20 mg/mL for each protein predominantly α-helical structure. The strong negative band type. Each panel has two overlaid FTIR spectra representing at 218 nm in the CD spectra observed for IgG (Fig. 4e, f) aggressive and conservative primary drying. A typical solid- show predominantly β-sheet characteristics. Fluorescence state amide I absorbance spectrum was observed for lyso- data indicated no change in tertiary structure for the three zyme (Fig. 5a, b) with a strong absorbance band at proteins irrespective of the primary drying condition ∼1,650 cm−1 indicating a predominantly α-helical protein. employed. The emission maxima obtained for lysozyme, For BSA (Fig. 5c, d), a typical solid-state amide I spectrum BSA, and IgG under both drying conditions were 341, 348, was observed (Fig. 5c, d) with strong absorbance bands at and 335 nm, respectively (data not shown). The FTIR data on 1,652–1,654 cm −1 indicating a predominantly α-helical
- 7. 1586 Lewis et al. 5.0E+05 5.0E+05 a b 0.0E+00 0.0E+00 200 210 220 230 240 250 Molar Ellipticity Molar Ellipticity 200 210 220 230 240 250 -5.0E+05 -5.0E+05 -1.0E+06 -1.0E+06 -1.5E+06 -1.5E+06 -2.0E+06 -2.0E+06 Wavelength (nm) Wavelength (nm) 5.0E+06 5.0E+06 c d 1.0E+06 1.0E+06 Molar Ellipticity Molar Ellipticity 200 210 220 230 240 250 200 210 220 230 240 250 -3.0E+06 -3.0E+06 -7.0E+06 -7.0E+06 -1.1E+07 -1.1E+07 -1.5E+07 -1.5E+07 Wavelength (nm) Wavelength (nm) 4.0E+06 e 4.0E+06 f Molar Ellipticity Molar Ellipticity 2.0E+06 2.0E+06 0.0E+00 0.0E+00 200 210 220 230 240 250 200 210 220 230 240 250 -2.0E+06 -2.0E+06 -4.0E+06 -4.0E+06 Wavelength (nm) Wavelength (nm) Fig. 4. Secondary structure by CD of the three proteins subjected to conservative (Ts =−25°C, solid line in each panel) and aggressive drying (Ts =+25°C, dashed line in each panel). a, b Lysozyme 5 and 20 mg/mL, respectively. c, d BSA 5 and 20 mg/mL, respectively. e, f IgG 5 and 20 mg/mL, respectively protein. For IgG (Fig. 5e, f), a typical solid-state amide I proteins, the lysozyme cake morphology appears to be distinctly spectrum was observed for IgG (Fig. 5e, f) with strong different compared to BSA and IgG. absorbance band at ∼1,640 cm−1 indicating a predominantly β-sheet protein. A shoulder was also observed at ∼1,680 cm−1 which indicates the presence of β-sheet. DISCUSSION Effect of Drying on Cake Morphology The objective of this paper was to characterize the Representative examples of the cake morphology by SEM freeze–drying behavior of three model proteins when sub- for the different protein cakes at 20 mg/mL are shown in Fig. 6. jected to two different primary drying conditions (aggressive, The morphology of the cakes in the aggressive cycle is more Ts = +25°C; conservative, Ts = −25°C) at two different open and porous than that observed in the conservative cycle, in concentrations (5 and 20 mg/mL) in amorphous formulations. line with previous observations made for cakes dried in the The three proteins used in this study differed in molecular micro-collapse region (5,10,23). This is more evident for the weights and secondary structural attributes, namely, IgG lysozyme and IgG cakes compared to BSA. Between the three (150 kDa and predominantly β-sheet), BSA (66 kDa and
- 8. Freeze–Drying Behavior of Model Protein Formulations 1587 0.01 0.005 0 -0.005 Second Derivative Second Derivative -0.01 -0.015 -0.02 -0.025 -0.035 -0.03 a b -0.045 -0.04 1580 1600 1620 1640 1660 1680 1700 1720 1580 1600 1620 1640 1660 1680 1700 1720 Wavenumber (cm-1) Wavenumber (cm-1) 0.01 0.01 0 0 Second Derivative -0.01 Second Derivative -0.01 -0.02 -0.02 -0.03 -0.03 -0.04 -0.05 -0.04 -0.06 c -0.05 d -0.07 -0.06 1580 1600 1620 1640 1660 1680 1700 1720 1580 1600 1620 1640 1660 1680 1700 1720 Wavenumber (cm-1) Wavenumber (cm-1) 0.005 0.005 -0.005 -0.005 Second Derivative Second Derivative -0.015 -0.015 -0.025 -0.025 -0.035 -0.035 e f -0.045 -0.045 1580 1600 1620 1640 1660 1680 1700 1720 1580 1600 1620 1640 1660 1680 1700 1720 Wavenumber (cm-1) Wavenumber (cm-1) Fig. 5. Secondary structure by FTIR of the solid cakes of the three proteins subjected to conservative (Ts =−25°C, solid line in each panel) and aggressive drying (Ts =+25°C, dashed line in each panel). a, b Lysozyme 5 and 20 mg/mL, respectively. c, d BSA 5 and 20 mg/mL, respectively. e, f IgG 5 and 20 mg/mL, respectively predominantly α-helical), and lysozyme (15 KDa and a mix of sublimation rates were higher in the aggressive mode α-helical and β-sheet) (22,24). compared to the conservative mode, and therefore, the cakes dried faster at the higher shelf temperature. The Rp values increased with increasing protein concentration, and in the conservative cycle, Rp increased monotonically as a function Impact of Aggressive and Conservative Drying of DLT, but in the aggressive mode was independent of DLT. The different biophysical analyses (CD, fluorescence, The two primary drying shelf temperatures employed in and FTIR) showed no significant difference in secondary and this study (namely, −25°C and +25°C) resulted in Tpr being tertiary structure for all three proteins subjected to the two either below the collapse temperature at Ts =−25°C or at the primary drying conditions, at both concentrations of 5 and edge of Tcmicro in the micro-collapse regime at Ts = +25°C. 20 mg/mL. No differences were observed in the formation of Based on the MTM measurements, the estimated Tpr and HMWS between the two cycles for the three proteins at both
- 9. 1588 Lewis et al. Fig. 6. Scanning electron micrographs of the three model protein cakes subjected to conservative (Ts =−25°C, left panels) (a, c, e) and aggressive drying (Ts =+25°C, right panels) (b, d, f). a, b Lysozyme. c, d BSA. e, f IgG. Micrographs represent cross-sectional view concentrations. This indicates that the aggressive and con- Comparison of the Freeze–Drying Behavior of the Three servative primary drying conditions did not affect the Proteins structure or the stability of the proteins. The morphology of the cakes dried aggressively had a Based on the data in Table I, increasing the protein more open and porous structure compared to the cakes concentration (from 5 to 20 mg/mL) significantly increases the 0 dried conservatively (10). The open and fragmented Tg of the formulations as well as the window between Tcmicro structure of the cake in the aggressive cycle decreases the and Tcmacro. The Tg of the solid cake also increases significantly tortuosity of the path that the water molecules have to with increasing protein concentration. Similar observations travel through the dry layer thickness (5,23), resulting in have been reported in the literature (8,25). The differences 0 shorter drying times. The change in pore structure while in between proteins in Tg , Tcmicro, and Tcmacro are less evident at the micro-collapsed state has been attributed to the viscous 5 mg/mL where the excipients (sucrose in this case) dominate flow of the newly freeze-dried material while it is still in the freeze–drying behavior. At the higher protein concentration the “rubbery” state (8–10). of 20 mg/mL, the differences between the protein formulations
- 10. Freeze–Drying Behavior of Model Protein Formulations 1589 become more evident. For example, the window between 3. Schwegman JJ, Hardwick LM, Ackers MJ. Practical formulation Tcmicro and Tcmacro is narrower for IgG, but is the widest for and process development of freeze-dried products. Pharm Dev Technol. 2005;10:151–73. BSA (Table I). Similarly, IgG-containing cakes have the highest 4. Manning MC, Patel K, Borchardt RT. Stability of protein Tg at 20 mg/mL, while lysozyme-containing cakes at the same pharmaceuticals. Pharm Res. 1989;6:903–18. concentration have the lowest. The aim of this paper was to 5. Johnson RE, Oldroyd ME, Ahmed SS, Gieseler H, Lewis LM. Use highlight these differences and/or similarities but not necessarily of manometric temperature measurements (MTM) to characterize the freeze–drying behavior of amorphous protein formulations. J explain them since no obvious or straightforward explanation Pharm Sci. 2010;99:2863–73. doi:10.1002/jps.22031. can be garnered from the data collected in this study. 6. Meister E, Gieseler H. Freeze–dry microscopy of protein/sugar MTM measurements (using the SMART™ freeze-dryer mixtures: drying behavior, interpretation of collapse temper- technology) have been used by researchers to study the atures and a comparison to corresponding glass transition data. J formulation-dependent mass transfer resistance of the dried Pharm Sci. 2009;98:3072–87. 7. Fonseca F, Passot S, Cunin O, Marin M. Collapse temperature of layer (26). One of the limitations of the SMART™ freeze- freeze-dried Lactobacillus bulgaricus suspensions and protective dryer technology is the significant deviation from the model media. Biotechnol Prog. 2004;20:229–38. at high protein concentrations of approximately 50 mg/mL 8. Colandene JD, Maldonado LM, Creagh AT, Vrettos JS, Goad (5,13) because of reabsorption of water by the dry layer. This KG, Spitznagel TM. Lyophilization cycle development for a high-concentration monoclonal antibody formulation lacking a study therefore limited itself to protein concentrations below crystalline bulking agent. J Pharm Sci. 2007;96:1598–608. 50 mg/mL where deviations from the SMART model are less 9. Milton N, Pikal MJ, Roy ML, Nail SL. Evaluation of manometric significant. At 5 mg/mL (where excipients dominate the temperature measurement as a method of monitoring product freeze–drying behavior), the estimated Tpr, Rp, and sublima- temperature during lyophilization. J Parent Sci Technol. 1997;51:7–15. tion rates from MTM measurements are similar for all three 10. Overcashier DE, Patapoff TW, Hsu CC. Lyophilization of proteins at both primary drying conditions. However, at protein formulations in vials: Investigation of the relationship 20 mg/mL (where the protein begins to significantly influence between resistance to vapor flow during primary drying and the freeze–drying behavior), differences in product resistance small-scale product collapse. J Pharm Sci. 1999;88:688–95. between the three proteins become evident especially in the 11. Tang X, Nail SL, Pikal MJ. Freeze–drying process design by manometric temperature measurement: design of a smart freeze- conservative mode, but these differences are less significant in dryer. Pharm Res. 2005;22:685–700. the aggressive mode. This indicates that at higher protein 12. Lewis LM, Teagarden DL, Johnson RE, Ahmed SS. Rational concentrations, depending on the protein type, there may design of a freeze-dried formulation for a biologic. Amer Pharm exist differences in the freeze–drying behavior especially in Rev. 2008;11(3):91–6. the conservative mode (i.e. below Tcmicro), but drying in the 13. Gieseler H, Kramer T, Pikal MJ. Use of manometric temper- ature measurement (MTM) and SMART ™ freeze dryer aggressive mode can significantly decrease these differences. technology for development of an optimized freeze–drying The cake morphology between BSA and IgG is similar, but cycle. J Pharm Sci. 2007;96:3402–18. the lysozyme cakes have a different cake morphology. These 14. Cleland JL, Lam X, Kendrick B, Yang J, Yang T-H, Overcashier differences are difficult to explain, but interesting to note. D, et al. A specific molar ratio of stabilizer to protein is required for storage stability of a lyophilized monoclonal antibody. J Pharm Sci. 2001;90:310–21. 15. Han Y, Jin B-S, Lee S-B, Sohn Y, Joung J-W, Lee J-H. Effects of sugar additives on protein stability of recombinant human serum CONCLUSIONS albumin during lyophilization and storage. Arch Pharm Res. 2007;30:1124–31. 16. Wang D, Hey J, Nail S. Effect of collapse on stability of freeze- The differences in the freeze–drying behavior of the three dried recombinant factor VIII and α-amylase. J Pharm Sci. proteins using MTM measurements were more evident at higher 2004;93:1253–63. protein concentrations where the protein significantly influences 17. Luthra S, Obert J-P, Kalonia D, Pikal M. Investigation of drying stresses on proteins during lyophilization: differentiation the behavior of the formulation matrix. However, these differ- between primary and secondary-drying stresses on lactate ences were minimized in the aggressive mode and at lower dehydrogenase using a humidity controlled mini freeze-dryer. J protein concentrations where excipients dominated the freeze– Pharm Sci. 2007;96:61–70. drying behavior. Even though no visual cake collapse was 18. Schersch K, Betz O, Garidel P, Muehlau S, Bassarab S, Winter observed after freeze–drying in aggressive mode, the cake G. Systematic investigation of the effect of lyophilizate collapse on pharmaceutically relevant proteins I: stability after freeze– morphology is more open and porous in the aggressively dried drying. J Pharm Sci. 2010;99:2256–78. cakes when compared to their conservatively dried counter- 19. Passot S, Fonseca F, Barbouche N, Marin M, Alarcon-Lorca M, parts. The stability and the protein structure are equivalent for Rolland D, et al. Effect of product temperature during primary all the protein cakes generated using the two primary drying drying on the long-term stability of lyophilized proteins. Pharm Dev Technol. 2007;12:543–53. conditions employed in this study. Significantly shorter primary 20. Venyaminov SY, Yang JT. In: Gasman GD, editor. Circular drying times could be achieved by employing aggressive primary dichroism and the conformational analysis of biomolecules. New drying shelf temperatures with no detrimental effect to the York: Plenum; 1996. p. 69–104. proteins studied. 21. Takeda K, Miura M, Takagi T. Stepwise formation of complexes between sodium dodecyl sulfate and bovine serum albumin detected by measurements of electric conductivity, binding iso- therm, and circular dichroism. J Coll Interface Sci. 1981;82:38–44. REFERENCES 22. K-y N, Zhao L, Meyer JD, Rittmann-Grauer L, Manning MC. Use of circular dichroism spectroscopy in determining the conformation 1. Wang W. Lyophilization and development of solid protein of a monoclonal antibody prior to its incorporation in an pharmaceuticals. Int J Pharm. 2000;203:1–60. immunoliposome. J Pharm Biomed Analysis. 1997;16:507–13. 2. Tang X, Pikal MJ. Design of freeze–drying processes for 23. Parker A, Rigby-Singleton S, Perkins M, Bates D, Le Roux D, pharmaceuticals: practical advice. Pharm Res. 2004;21:191–200. Roberts CJ, et al. Determination of the influence of primary
- 11. 1590 Lewis et al. drying rates on the microscale structural attributes and physico- 25. Liao X, Krishnamurthy R, Suryanarayanan R. Influence of the chemical properties of protein containing lyophilized products. J active pharmaceutical ingredient concentration on the physical Pharm Sci. 2010;99:4616–29. state of mannitol—implication in freeze–drying. Pharm Res. 24. Costantino HR, Griebenow K, Mishra P, Langer R, Klibanov 2005;22:1978–84. AM. Fourier-transform infrared spectroscopic investigation of 26. Kramer T, Kremer DM, Pikal MJ, Petre WJ, Shalaev EY, Gatlin protein stability in the lyophilized form. Biochim Biophys Acta. LA. A procedure to optimize scale-up for the primary drying 1995;1253:69–74. phase of lyophilization. J Pharm Sci. 2009;98:307–18.