2. the FAGO, used to assess the independent variable. In a
regression analysis, fear (R2change = .06) w as
found to be a statistically significant predictor of life
satisfaction when controlling for five covariates
(current activity, circumstance and pursuing own interest as two
reasons for retirement, postretirement
work, and perceived social support); overall R2 = .26. For
retirement satisfaction, fear significantly
explained variance in the outcome (R2change = .04) while
controlling for two significant covariates
(current activity and perceived social support); overall R2 =
.14. A work by gender interaction on
satisfaction was not found. Other than fear about loss of
mobility, men rated loss of partner very high;
women rated mortal disease very high. The lowest fear was loss
of retirement income for men and
loss of earning-power for women. Canada’s poverty preventive
programs successfully supported
senior postretirement life. The FAGO was useful to find senior
needs.
This quantitative research conducted at three senior centers in
Ontario, Canada. It is the first to
examine postretirement life satisfaction, based on both positive
and negative aspects of Laslett’s
(1987, 1991) Aging Theory of the Third Age, which emerged in
developed countries, such as
Canada, the United States, and Japan. Upon retirement,
individuals faced the threat of social
The authors very much appreciate the permission for this study
from Mr. Calvin Little and Ms. Betty Lou Frith,
directors of senior centers in Ontario, Canada.
Address correspondence to Satoko Nguyen, PhD, Social
Studies, Sundai Michigan International Academy, 24277
3. Novi Road, Novi, MI 48375. E-mail: [email protected]
FEAR AS A PREDICTOR OF LIFE SATISFACTION IN
CANADA 103
marginality (Weiss, 2005). Meanwhile, retirees might realize
their desires, which they have never
done before, for life fulfilment, but also experience fears for
growing old (Kelly & Barratt, 2007).
Indeed, Laslett (1991) exemplified 14 fears about growing old.
Nonetheless, researchers mainly
conducted qualitative studies with retirees from specific,
positive perspectives (e.g., postretire-
ment activities; Sadler, 2006; Trentin, 2004), ignoring factors
for senior life and retirement satis-
factions and fears for growing old. Moreover, Weiss, Bass,
Heimovitz, and Oka (2005) found
well-being in only male retirees actively working at a part-time
job in Japan. Yet, interaction
effect between gender and postretirement job was not clear in
North America.
In this research, a nonprobability cross-sectional convenience
sample of those retired from
a full-time job and aged 50 years or older took a self-
administered survey. Three objectives
were (a) to test Laslett’s (1987, 1991) theory by examining if a
set of social-participation-
related covariates correlated to two dependent variables (i.e.,
life satisfaction and overall retire-
ment satisfaction); (b) to determine to what extent fears about
growing old predicted the two
dependent variables after controlling for significant covariates;
and (c) to establish whether a
4. significant interaction effect between gender and postretirement
work occurred on the depen-
dent variables.
The data were analyzed with Pearson correlation coefficients
and multiple regression models.
The results reflected which specific areas (i.e., social
participation, fears about growing old, or
gender difference) needed improvement to increase life and
retirement satisfactions in retirees in
Canada.
LITERATURE REVIEW
Laslett (1987, 1991) posited that one’s life is comprised of four
stages: the First Age for learning,
the Second Age for working, the Third Age for fulfilling
postretirement life, and the Fourth Age
for unavoidably having declined health and death. For Laslett,
retirement was a turning point for
those with health, vigor, and positive attitudes to fulfill their
life, although they might have fears
about growing old. In North America, however, Third Age
studies little achieved comprehensive
results due to the qualitative methods (Narushima, 2004; Sadler,
2006) or a bias for cognitive
decline in seniors (Hori & Cusack, 2006).
It was not clear whether retirees lose or maintain social
participation. In the United States
retirees faced the threat of social marginality (Weiss, 2005);
thus, many of the recently retired
sought prearranged activities, including part-time work, for
satisfaction with both retirement and
overall life (Kim & Feldman, 2000) or for continual social
participation (Barth, McNaught, &
5. Rizzi, 1995). Meanwhile, some older adults moved on to a
creative job without manadatory
retirement and thus a new path of life (Sadler, 2006).
In both Canada and Japan, Hori and Cusack (2006) found that
senior program participants had
(a) fears for declining mental ability and loss of memory and (b)
negative views toward aging as
a decline. For the former finding, both researchers emphasized
that the participants needed learning
programs to avoid forgetfulness. However, they did not examine
other common fears for aging,
including physical decline, falling status, and poverty.
The latter finding of Hori and Cusack (2006) was especially
prominent in males who experi-
enced falling social statuses after retirement. Moreover,
Narushima (2004) in Canada found that
older female activists with a full-time job had difficulties
shifting from the working role to the
104 S. NGUYEN ET AL.
traditional female role after a compulsory retirement. However,
interaction effect between gender
and postretirement work was unknown.
Thus, this research was conducted in Canada to examine retiree
satisfaction for life and
retirement for the above-mentioned three objectives from both
positive and negative perspec-
tives of Laslett’s (1987, 1991) Theory of the Third Age.
Recently, early retirement was preva-
lent due to global economic recession (Curl & Hokenstad,
6. 2006). Therefore, retirees were
defined as those aged 50 years or older who retired completely
or had a postretirement part-
time job.
Two dependent variables were life satisfaction and overall
retirement satisfaction. Barrett and
Murk (2006) examined specifically life satisfaction in the Third
Age and created a 35-item Life
Satisfaction Index for the Third Age (LSITA) and its short
version ([LSITA-SF], Barrett & Murk,
2009). Their original scale was derived from the Life
Satisfaction Index A ([LSIA], Neugarten,
Havighurst, & Tobin, 1961), which was one of the most
frequently used instruments in geronto-
logical studies (Lohmann, 1980). Floyd et al. (1992)
investigated overall retirement satisfaction
with their own scale called the Retirement Satisfaction
Inventory (RSI).
A retirement issue, social marginality (Weiss, 2005), is a
conception for loss of social partici-
pation. To explore satisfaction with retirement and
postretirement life in Canadian older adults
from the perspective of social participation, considering gender
difference, five suitable covari-
ates were chosen. These were gender, current activity, reasons
for retirement, perceived social
support, and postretirement work (also a sociodemographic
variable).
Current activity was a conception based on activity theory
(Lemon, Bengtson, & Peterson,
1972). The premise of this theory was being engaged in
different types of activities was influen-
tial for older adults to cope with the aging process. Some
7. contemporary researchers supported
this theory and conducted senior activity studies (Lowis,
Edwards, & Burton, 2009; Wahrendorf,
Ribet, Zins, & Siegrist, 2008).
Floyd et al. (1992) examined reasons for retirement to assess
how important each of the rea-
sons in four areas was in one’s decision to retire with their
measure Retirement Satisfaction
Inventory (RSI). Specifically, the areas were (a) job stress (i.e.,
too much stress at work, difficulty
with physical demands of job, and disliked job); (b) pressure
from employer (employer’s pres-
sure; incentives from company; lay-off, dismissal, or hours
reduced; and difficulties with col-
leagues); (c) pursuing own interest (time with my family, time
to pursue interests, room for
younger people, and spouse’s desire), and (d) circumstance (i.e.,
reached mandatory retirement
age, poor health, spouse’s poor health, and could finally afford
retirement).
Older adults’ social participation is also an issue related to
social relationship, which consists
of social network and social support. Individuals obtain social
support from their own social
network (Uchino, 2004). Social support perceived from major
social network sources (i.e.,
family, friends, and significant other) was more meaningful
than a simple network size (Magai,
Consedine, King, & Gillespie, 2003).
Larson (1978) listed diverse variables found to affect subjective
well-being in elders from
major sociological studies of the past 30 years. Two most
relevant studies for well-being in
8. seniors and retirement (Lowis et al., 2009; Weiss et al., 2005)
had useful independent and/or
sociodemographic variables. Referring to these three studies,
six sociodemographic variables
chosen for this study were age (50 years or older); race, marital
status (married, cohabitating,
divorced, separated, bereaved, never married); educational
background (final educational
institution graduated); job status (completely retired, laid off
and waiting/searching for a job,
FEAR AS A PREDICTOR OF LIFE SATISFACTION IN
CANADA 105
part-time worker, full-time worker, on-call worker, volunteer,
self-employed/freelancer,
working for my family’s business, and never worked); and
number of hours worked per
week.
As Laslett (1991) posited, whether or not retirees had
life/retirement satisfactions, accompa-
nying fears about growing old was investigated. Thus, a set of
these fears was the independent
variable. To examine the independent variable, a new
instrument, Fears About Growing Old
(FAGO), was developed and used in this study. This new
measure was based on Laslett’s (1991)
14 exemplifications. A pilot study confirmed both validity and
reliability.
RESEARCH QUESTIONS
Three research questions and their corresponding hypotheses
9. were analyzed with respective mul-
tiple regression models. For each model, the level of
significance was .05.
Research Question 1
Which set of covariates (gender, current activity, reasons for
retirement [job stress, pressure from
employer, pursuing own interest, and circumstance], perceived
social support, and part-time
work after retirement) significantly predicted life satisfaction
and overall retirement satisfaction
among Canadian retirees? Following are the corresponding
hypotheses for Research Question 1:
H1A0: The covariates would not significantly predict life
satisfaction as measured by the LSITA-SF
(Barrett & Murk, 2009).
H1A1: A set of significant covariates would predict life
satisfaction as measured by the LSITA-SF.
H1B0: The covariates would not significantly predict overall
retirement satisfaction as measured by
the RSI (Floyd et al., 1992).
H1B1: A set of significant covariates would predict overall
retirement satisfaction as measured by
RSI.
Research Question 2
To what extent did self-perceptions of Laslett’s (1991) fears
about growing old predict life satis-
faction and overall retirement satisfaction after controlling for
significant covariates? Following
10. are the corresponding hypotheses for Research Question 2:
H2A0: Self-perceptions of the fears would not significantly
predict life satisfaction as measured by
the LSITA-SF after controlling for significant covariates
(R2change = 0).
H2A1: Self-perceptions of the fears would significantly
increase the prediction of life satisfaction as
measured by the LSITA-SF (R2change > 0) and would be
negatively related to life satisfaction.
H2B0: Self-perceptions of the fears would not significantly
predict overall retirement satisfaction as
measured by the RSI after controlling for significant covariates
(R2change = 0).
H2B1: Self-perceptions of the fears would significantly
increase the prediction of overall retirement
satisfaction as measured by the RSI (R2change > 0) and would
be negatively related to overall
retirement satisfaction.
106 S. NGUYEN ET AL.
Research Question 3
Was there a significant interaction effect of gender and working
after retirement on life satisfac-
tion and overall retirement satisfaction among these retired
Canadians? Following are the corre-
sponding hypotheses for Research Question 3:
H3A0: There would not be a significant interaction of gender
11. and postretirement work with respect to
life satisfaction as measured by the LSITA-SF (R2change for
the interaction term = 0).
H3A1: There would be a significant interaction between gender
and postretirement work with respect
to life satisfaction as measured by the LSITA-SF (R2change for
the interaction term > 0).
H3B0: There would not be a significant interaction of gender
and postretirement work with respect to
overall retirement satisfaction as measured by the RSI
(R2change for the interaction term = 0).
H3B1: There would be a significant interaction between gender
and postretirement work with respect
to overall retirement satisfaction as measured by the RSI
(R2change for the interaction term > 0).
Method
Covariates and Instruments
To assess the two dependent variables, life satisfaction and
overall retirement satisfaction, five
covariates and one independent variable were used as mentioned
above. Table 1 shows details for
all these variables. Contemporary studies regarding well-being,
a concept close to life satisfac-
tion, tend to use a four-point Likert scale (Lowis et al., 2009;
Mulenga & Liang, 2008; Wahrendorf
et al., 2008). In this research, thus, instruments with even-
number Likert scales, and approved
good reliability and validity were chosen or created (see Table
1).
12. Specifically, the LSITA-SF (Barrett & Murk, 2009) measured
the dependent variable life sat-
isfaction. The RSI (Floyd et al., 1992) was for the two
covariates, that is, current activity compris-
ing three items, whose reliability as one covariate was
confirmed in the pilot study, and reasons
for retirement; as well as the other dependent variable overall
retirement satisfaction. To measure
a covariate, perceived social support, the Multidimentional
Scale of Perceived Social Support
([MSPSS], Zimet, Dahlem, Zimet, & Farley, 1988) was used.
The FAGO, originated from
Laslett’s (1991) exemplifications and prepared in the pilot
study, measured the independent vari-
able—fears about growing old (see Table 1).
Pilot Study
In April and May 2011, daily regular senior program
participants and staff, recruited through
senior center newsletters and posters, participated in the pilot
study. Incentives were a Can$2
donation for their centers and a $2 coffee card for private use.
Professional panellists comprising
four staff (one male, three females) prepared 18 items from
Laslett’s (1991) 14 fears about grow-
ing old, and then they examined the content validity, which was
92.5%. Retiree panellists, con-
sisted of nine seniors (three males, six females) aged 60 to 75
years, reworded the 18 items.
Hence, a new 17-item instrument FAGO was complete (see
Appendix).
For the reliabilities of FAGO and the composite of three items
in the Current Activity section
of Floyd et al.’s (1992) instrument RSI as one covariate, a total
13. of 50 seniors (12 males, 38 females)
107
TA
B
L
E
1
L
is
t
o
f V
a
ri
a
b
le
s
a
n
d
M
e
73. FEAR AS A PREDICTOR OF LIFE SATISFACTION IN
CANADA 109
had a test with a self-administered confidential questionnaire.
Two or three weeks later, 41 of the
seniors (nine males, 32 females) had a retest. Missing responses
were found in only two out of 50
cases for the FAGO and one case for the Current Activity. The
Cronbach alpha internal consis-
tency reliability coefficient was .87 (acceptable) for the FAGO,
but only .60 (very low) for Current
Activity. The overall coefficients would not increase by
eliminating any items in either instru-
ment. The test-retest reliability was .73 for the FAGO and .78
for Current Activity, respectively.
Main Survey Participants
In June to August 2011, main survey participants were
separately recruited similarly to the pilot
study. Random sampling and mail survey were impracticable
due to a senior center director’s
decision not to open the senior member mailing list and a
Canada Post strike. The minimum
sample size of 109 subjects for the main survey was calculated,
using the multiple regression
analysis with five predictor variables, one of which comprised
four subscales used as four vari-
ables, a medium effect size, power of .80, and a .05 level of
significance.
Of a total of 326 seniors who received a survey, 219 (44 males
aged 53–96 years, 175 females
aged 52–96 years) completed the self-administered confidential
questionnaire (return rate:
67.2%). The completed questionnaires had very few missing
74. values in 12 cases. The mean age
was 71.71 (male: 71.43, female: 71.78). Most participants were
White (80.8%) or Asian (11.4%).
More than half (63.6%) of males and 42.3% of females were
married. The ratio between those
completed elementary/secondary education (n = 103, 47.0%)
and higher education (up to PhD;
n = 96, 43.8%) was almost 1:1.
Most participants (n = 150, 68.4%) were retired completely and
had no job, and a total of 17
subjects had never worked or retired. Contrary to the initial
expectation, only 12 subjects (5.4%)
retired and then had nonfull-time, paid job. Therefore, data for
both retirees with a nonfull-time,
paid job and those having a volunteer job (n = 40, 18.2%) were
integrated as those having post-
retirement work and then analyzed. Only seven subjects
reported postretirement paid working
hours a week (8 to 30 hours).
Results
Descriptive Statistics
The target subjects of this research were older adults who
retired from a full-time job. Therefore,
the 17 cases for those who had never worked/retired were
eliminated from the main study data.
Moreover, 12 cases containing missing values were eliminated
listwise. Thus, descriptive statis-
tics were conducted for the data containing a total of 190 cases,
including 39 males and 151
females (see Table 2).
Pearson Correlation Coefficients
75. Table 3 shows the results of Pearson correlation coefficient
analyses for all research question
variables with a two-tailed test. The dependent variable life
satisfaction was significantly
110 S. NGUYEN ET AL.
TABLE 2
Descriptive Statistics of All Variables (N = 190)
M SD
Current activity; 0–3* 2.41 .486
Gender (1: male; 2: female) 1.79 .404
Postretirement work (0: no work; 1: work/volunteer) .263 .441
Perceived social support; 0–1* .826 .219
Reasons for retirement
Job stress; 1–6* 1.84 1.18
Pressure from employer; 1–6* 1.59 1.06
Pursuing own interest; 1–6* 2.55 1.28
Circumstance; 1–6* 2.33 1.15
Life satisfaction; 1–6* 4.32 .858
Retirement satisfaction; 1–6* 5.06 1.11
Fears about growing old; 0–3 (0: not at all, 3: very much) 1.33
.633
Note. *A larger number indicates a more positive alternative.
correlated with the other dependent variable overall retirement
satisfaction (r = .445, p = .000);
five covariates current activity (r = .386, p = .000),
circumstance (r = −.234, p = .001), job stress
(r = −.189, p = .009) as two reasons for retirement,
76. postretirement work (r = .200, p = .006), and
perceived social support (r = .227, p = .002); and the
independent variable fears about growing
old (r = −.319, p = .000). The other dependent variable overall
retirement satisfaction was signifi-
cantly correlated with three covariates: gender (r = .183, p =
.011), current activity (r = .243,
p = .001), and circumstance as reason for retirement (r = −.160,
p = .027); and the independent
variable fears about growing old (r = −.174, p = .017).
Predicting Life/Retirement Satisfaction
Using the respective dependent variables life satisfaction and
overall retirement satisfaction, and
all covariates (for Gender, 0: male, 1: female), the data (n =
190) were analyzed with the stepwise
method of multiple regressions in order to answer Research
Question 1 and test the associated
hypotheses H1A0 and H1A1, and H1B0 and H1B1, respectively.
For H1A, Model 1A, which included the dependent variable life
satisfaction and the five sig-
nificant covariates current activity, perceived social support,
postretirement work, and circum-
stance and pursuing own interest as reasons for retirement,
predicted 26.6% of the variance
(R² = .266; see Table 4). The ANOVA showed that the model
was significant (p = .000). Thus, the
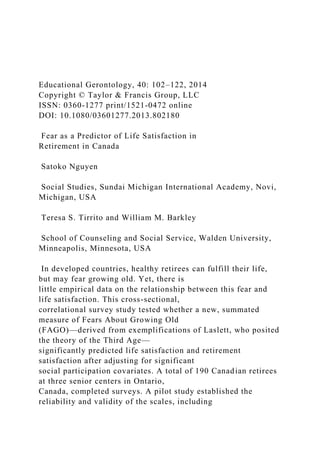
null hypothesis 1A was rejected. Moreover, both H1A
Histogram and Normal P-P Plot in Figure
1 were normally distributed. No outliers were found in the
results.
For H1B, seven outliers were eliminated, and then the
remaining 183 cases were analyzed.
77. Model 1B—including the dependent variable overall retirement
satisfaction and two covariates
current activity and perceived social support—predicted 9.7% of
the variance (see Table 4). The
ANOVA showed that the model was significant (p = .000).
Thus, the null hypothesis 1B was
111
TA
B
L
E
3
P
e
a
rs
o
n
C
o
rr
e
la
tio
132. hi
ca
l
N
o
te
. *
*p
<
.0
1,
*
p
<
.0
5.
FEAR AS A PREDICTOR OF LIFE SATISFACTION IN
CANADA 113
FIGURE 1 Histograms and normal P-P plots. (Color fi gure
available online.)
rejected. Moreover, in both the H1B Histogram and the Normal
P-P Plot in Figure 1, residuals
133. were normally distributed. For both Models 1A and 1B, all
tolerances (around .90) indicated an
absence of significant multicollinearity among the predictor
variables.
114 S. NGUYEN ET AL.
Effects of Fears About Growing Old to Life/Retirement
Satisfaction
To answer Research Question 2 and test the associated
hypotheses, the data for the respective depen-
dent variables, the covariates that were significant in Models
1A and 1B, and the independent variable
fears about growing old were analyzed with the hierarchical
method of multiple regressions.
For life satisfaction, only one outlier was eliminated, and then
the data from the remaining 189
respondents were analyzed. As Table 4 shows, Model 2A 1,
including the dependent variable life
satisfaction and the five covariates significant in Model 1A,
significantly predicted 25.6% of the
variance (R² = .256). Model 2A 2, including the dependent
variable, the same five covariates, and
the independent variable fears about growing old, significantly
predicted 31.3% (R² = .313). The
R squared change of Model 2A 2 increased by .058, compared
to Model 2A 1. The ANOVA
showed that both Models 2A 1 and 2 were significant (p = .000,
respectively). Thus, the null
hypothesis 2A was rejected. Furthermore, in both the H2A
Histogram and the Normal P-P Plot
in Figure 1, residuals were normally distributed.
134. FIGURE 1 (Continued) (Color fi gure available online.)
FEAR AS A PREDICTOR OF LIFE SATISFACTION IN
CANADA 115
As Table 4 shows, the independent variable fears about growing
old had a significantly nega-
tive regression coefficient with the dependent variable life
satisfaction (β = −.254, p = .000). All
covariates in both Models 2A 1 and 2, except for pursuing own
interest in the Model 2A 2
(β = .125, p = .053), had a respective significant regression
coefficient with the dependent vari-
able (see Table 4).
For overall retirement satisfaction, similarly, 15 outliers were
eliminated, and then the data
from the remaining 175 respondents were analyzed. Model 2B
1, which included the dependent
variable overall retirement satisfaction and the two covariates
current activity and circumstance
significant in Model 1B, significantly predicted 13.8% of the
variance (R² = .138); whereas,
Model 2B 2, including the same dependent variable and two
covariates, and the independent vari-
able fears about growing old, significantly predicted 17.1% (R²
= .171), respectively. The R
squared change of Model 2B 2 increased by .033, compared to
Model 2B 1. The ANOVA showed
that both Models 2B 1 and 2 were significant (p = .000,
respectively). Thus, the null hypothesis
2B was rejected. Furthermore, in both the H2B Histogram and
the Normal P-P Plot in Figure 1,
135. residuals were normally distributed.
The independent variable fears about growing old also had a
significantly negative regression
coefficient with the dependent variable overall retirement
satisfaction (β = −.182; p = .010) in
Model 2B 2. Both covariates in both Models 2B 1 and 2 had a
respective significant regression
coefficient with the dependent variable. For all Models 2A 1
and 2, and 2B 1 and 2, the tolerances
(around .90) indicated an absence of significant
multicollinearity among the predictor variables.
Descriptive Statistics for Fears About Growing Old
Fears about growing old significantly negatively predicted both
life satisfaction and overall retire-
ment satisfaction. Table 5 shows the results of descriptive
statistics for the highest and lowest fears
that the subjects (n = 190) had by gender and three ages
(younger than the general preretirement
age of 65 years, the young-old between 65 and 74 years, and the
old-old 75 years or older).
Generally, both genders more highly indicated fears regarding
loss of their independence or
liberty, especially loss of mobility. Males in all ages had higher
fear regarding loss of their close
life assistant (i.e., loss of spouse, kin, or family); whereas,
females in all ages highly indicated
fears of mortal diseases (i.e., cancer, heart disease, Alzheimer’s
disease, or dementia). Yet, both
genders were less likely to have fears regarding falling social
statuses, death-related concerns,
and/or loss of beauty. Moreover, lower fears among both
genders related to less income, that is,
136. loss of retirement income for the males and loss of earning
power for the females (see Table 5).
Gender Work Interaction Effects on Life/Retirement
Satisfaction
To answer Research Question 3, the Gender × Postretirement
Work interaction on the respective
dependent variables life satisfaction and overall retirement
satisfaction was used with the hierar-
chical method of multiple regressions. To create a better
interaction term, these values were used:
1: male and 2: female for gender, and 1: no work and 2: work
for postretirement work.
To examine if there was a significant Gender × Postretirement
Work interaction on life satis-
faction, only one outlier was eliminated, and then the data from
the remaining 189 respondents
116
TA
B
L
E
5
H
ig
165. w
he
n
cl
os
e
to
d
ea
th
FEAR AS A PREDICTOR OF LIFE SATISFACTION IN
CANADA 117
were analyzed. For Models 3A 1 and 3A 2, both of which
included gender, postretirement work,
and the dependent variable, adding the interaction term to
Model 3A 2 did not significantly
increase the R2 (R2change = .000; see Table 4). Thus, the null
hypothesis 3A was not rejected. Only
the ANOVA for Model 3A 1 was significant (p = .023). In both
the H3A Histogram and the
Normal P-P Plot in Figure 1, residuals were normally
distributed. Yet, the only significant regres-
sion coefficient (see Table 4) was for postretirement work (β =
.202; p = .006); people who
actively worked were more satisfied than those who did not.
166. Similarly, the data were analyzed for a significant Gender ×
Postretirement Work interaction
on overall retirement satisfaction. Eight outliers were
eliminated, and then the data from the
remaining 182 respondents were analyzed. As Table 4 shows,
Model 3B 1, including the depen-
dent variable overall retirement satisfaction, gender, and
postretirement work, barely predicted
1.3% of the variance (R² = .013). Meanwhile, Model 3B 2,
including the same dependent variable
and two covariates, and the interaction term thereof, barely
predicted 2.1% of the variance
(R² = .021). The R squared change of Model 3B 2 increased by
just 0.08, compared to Model 3B
1. However, the ANOVA did not show a significant model, and
nothing was significant in these
models. Thus, the null hypothesis 3B was not rejected. No
Gender × Postretirement Work inter-
action was found either. For both the H3B Histogram and the
Normal P-P Plot, residuals were not
normally distributed.
Discussion
Factors for Life/Retirement Satisfaction
As Laslett (1987, 1991) posited, the results revealed that the
subjects had life/retirement satisfac-
tions involving various social participation-related factors.
Current activity was the positive
factor for both life and retirement satisfactions, and this finding
supported the activity theory
(Lemon et al., 1972). Taylor-Harris and Zhan (2011) found
physical, emotional, and social ben-
efits in African Americans who participated in senior center
activities in Atlanta, Georgia.
167. Moreover, eager participants in senior center programs in the
Czech Republic chose active life-
style the most desirable in old age (Marhankova, 2011).
Social support perceived from family, friends, and significant
others (Zimet et al., 1988) was
also a positive factor for both life and retirement satisfactions.
Prominently, this finding matched
the other finding in this study that the participants showed loss
of spouse, family, or kin as one of
the highest three fears for both genders in all ages, except for
the old-old females (see Table 5).
Some of the old-old females might have already been bereaved
for their husband; thus, the pos-
sibly showed less fears for loss of spouse, family, or kin. These
results suggested that social sup-
port perceived from other family members, friends, and
significant others was especially vital for
the old-old females.
Circumstance (e.g., reached mandatory retirement age) was the
negative reason for retirement
for both life and retirement satisfactions. This result revealed
that seniors with circumstance
reluctantly retired. It also supported Narushima’s (2004)
findings in terms of disagreement with
the existing mandatory retirement system in Canada. Job stress
was a negative reason for retire-
ment for only life satisfaction. Seniors who retired to avoid job
stress seemed not to have satisfac-
tory postretirement life but to regret retirement.
118 S. NGUYEN ET AL.
168. Importantly, retirees working at a postretirement job, regardless
of volunteer or part-time job,
showed their postretirement life satisfaction, not retirement
satisfaction, unlike the finding of
Kim and Feldman (2000). As Barth et al. (1995) found, a
postretirement job is useful for senior
social participation. The subjects might also have a
postretirement job to compensate for reluc-
tant retirement. Moreover, this finding corresponded to social
expectations in the United States
for third agers to stay productive through volunteerism (Carr,
2009).
Being female was a factor for only retirement satisfaction.
Laslett (1991) mentioned that
women tended to have a longer Third Age due to their earlier
retirement and longer life, com-
pared to men. Apparently, this result might imply that women in
Canada tended to find a way to
enjoy their postretirement life during their longer Third Age.
Conversely speaking, men might be
likely to have difficulties in adapting to retirement.
Fears About Growing Old
This study’s results supported Kelly and Barratt (2007) and
Laslett (1991) suppositions of fears
about growing old. Other than Hori and Cusack’s (2006)
findings regarding fears for cognitive
decline, the findings clarified various kinds of fears about
growing old (see Table 5). Thus, the
new instrument, FAGO, derived from Laslett’s (1991)
exemplifications, was useful to identify
senior needs and will help determine policy on aging society.
Both genders tended to have higher fears about irrevocably
169. losing something and then
having that loss cause great difficulties while aging (i.e., loss of
mobility; blindness or deaf-
ness; loss of spouse, kin, and family). Those fears specific to
males were loss of life sup-
porter (i.e., spouse, kin, and family) and loss of dignity (i.e.,
loss of home or institutionalization
and contraction of the future); the fear specific to females was
having a mortal disease. In
contrast, lower fears for both genders related to something that
inevitably happened while
aging (i.e., loss of beauty) and something manageable in
advance (i.e., funeral or estate plan-
ning, loss of spiritual serenity to be mitigated with religious
piety, and falling social statuses
to be solved by having a part-time/volunteer job). Low fear for
death was specific to the males.
Most noticeably, loss of retirement income for long-term care
before death for the males and
loss of earning-power for the females were lower fears.
Generally, poverty rates among older women, especially among
those divorced, widowed,
never married, and in the old-old, were much higher than males,
but much lower in Canada than
in other six major rich countries including the United States
(Butrica, Iams, & Smith, 2003/2004).
In North America, poverty rates for general elders at the 40%
and 50% poverty lines were 1.7 %
and 7.8% for Canada and 15.0% and 24.7% for the United
States, respectively.
Canada developed plans to (a) compensate older women,
victimized during their working his-
tory due to caregiving to young children or frail older adults, so
that they could maintain their
170. living standard in retirement similar to men; and (b) guarantee
the financial life of low-income
persons (Curl & Hokenstad, 2006). Moreover, Canada has a
relatively steady public pension
program to prevent seniors from having poverty issues (Human
Resources Development Canada,
2001). Furthermore, Canada has a publicly-funded health care
system, which is mostly free of
charge and, thus, cost-effective for seniors, who tend to have
poor health conditions. Thus;
Canada is a country with successful poverty-preventing
programs for seniors, who would least
need to worry about loss of retirement income or earning-power,
as this study result showed.
FEAR AS A PREDICTOR OF LIFE SATISFACTION IN
CANADA 119
Although Hori and Cusack’s (2006) study participants who
experienced falling social statuses
seemed to view aging as a decline, the subjects in this research
reported lower fears about falling
social statuses. Having a postretirement job might be effective
to mitigate falling social statuses
and, thus, senior social marginality.
Interaction Effect of Gender and Postretirement Work
No significant Gender × Work interaction was found on both
life and retirement satisfactions. Only
postretirement work significantly positively predicted life
satisfaction similarly to the Pearson correla-
tion coefficient results (see Tables 3 and 4). In this study, the
subjects having postretirement work were
171. retirees with nonfull-time, paid jobs (n = 12, 5.4%) and those
having volunteer jobs (n = 40, 18.2%).
That is, 76.9% of the subjects with a postretirement job worked
without payment. This result implied
that having a job—even without a wage—increased Canadian
retiree life satisfaction. This implication
also supported the effectiveness of Canada’s three poverty-
preventing programs mentioned above.
Unlike old women who tended to have poverty in other
developed countries including the
United States, those in Canada seldom experienced poverty
(Butrica et al., 2003/2004) due to the
three steady programs. With sufficient retirement income from
these successful programs,
Canadian retirees undertook postretirement work probably not
for their retirement income, but
for social participation. Moreover, unlike in Japan, where only
male retirees sought part-time
jobs for their improved well-being (Weiss et al., 2005), both
male and female Canadian retirees
could have postretirement work as part of life fulfillment.
Meanwhile, only the Pearson correlation coefficient results
showed that gender (being female)
had a correlation with overall retirement satisfaction. Moreover,
the women in this study actually
had lower fear for loss of earning power (see Table 5). This
result was contrary to Narushima’s
(2004) study regarding Canadian female activists who opposed
Canada’s compulsory retirement
system. This discrepancy could be attributed to views toward
retirement that are different between
two types of Canadian women. That is, those who experienced a
long retiree life might already
find and enjoy their good retiree role (e.g., a postretirement
172. work and senior center program par-
ticipation); whereas, those who recently retired or would
imminently retire might have not real-
ized their positive retiree life and role yet.
Implications for Social Change
Based on the study results, support for older adults is essential.
Figure 2 shows recommended
processes for older adults and retirees to have more
life/retirement satisfactions through social
participation in a community in Canada, as well as the United
States and other developed
countries.
Recommendations for Further Study
This study was conducted in Canada, based on Laslett’s (1987,
1991) Third Age Theory, which
is originally British. To further closely examine factors for
life/retirement satisfactions in retirees,
120 S. NGUYEN ET AL.
FIGURE 2 Flowcharts to increase life/retirement satisfaction.
it is recommended to conduct a similar study in the United
Kingdom, European Union countries,
the United States, and other countries having retiree-related
measures (e.g., pension programs
and retirement systems) different from those in Canada. Future
research requires a random sam-
pling, the inclusion of other races, a more balanced ratio of both
genders, and the same instru-
173. ments—including the FAGO (see Appendix) newly developed in
this study. Furthermore, this
FEAR AS A PREDICTOR OF LIFE SATISFACTION IN
CANADA 121
study partly contained elders’ preretirement conditions, that is,
reasons for retirement. To help
adults better adapt to their later life, conducting research for
retirement planning, such as secure
retirement in terms of finances and housing, with preretirees
may prove informative.
REFERENCES
Barrett, A. J., & Murk, P. J. (2006). Life Satisfaction Index for
the Third Age (LSITA): A measurement of successful
aging. In E. P. Isaac (Ed.), Proceedings of the 2006 Midwest
research-to-practice conference in adult, continuing, and
community education (pp. 7–12). St. Louis, MO: University of
Missouri-St. Louis. Retrieved from https://scholar
works.iupui.edu/handle/1805/1160
Barrett, A. J., & Murk, P. J. (2009). Life Satisfaction Index for
the Third Age–Short Form (LSITA-SF): An improved and
briefer measure of successful aging. Retrieved from
http://www.neiu.edu/~hrd/mwr2p09/Papers/Barrett.pdf
Barth, M. C., McNaught, W., & Rizzi, P. (1995). Older
Americans as workers. In S. Bass (Ed.), Older and active: How
Americans over 55 are contributing to society (pp. 35–70). New
Haven, CT: York University Press.
Butrica, B. A., Iams, H. M., & Smith, K. E. (2003/2004). The
174. changing impact of social security on retirement income in
the United States. Social Security Bulletin, 65(3), 1–13.
Carr, D. (2009). Aging in America: The link between
productivity and resources in the Third Age. Ageing
International,
34(3), 154–171. doi:10.1007/s12126-009-9041-8
Curl, A. L., & Hokenstad, M. C., Jr. (2006). Reshaping
retirement policies in post-industrial nations: The need for
flexibility. Journal of Sociology & Social Welfare, 33(2), 85–
106.
Floyd, F. J., Haynes, S. N., Doll, E. R., Winemiller, D.,
Lemsky, C., Burgy, T. M., … & Heilman, N. (1992). Assessing
retirement satisfaction and perceptions of retirement
experiences. Psychology and Aging, 7(4), 609–621.
Hori, S., & Cusack, S. (2006). Third-age education in Canada
and Japan: Attitudes toward aging and participation in
learning. Educational Gerontology, 32(6), 463–481.
doi:10.1080/03601270600685677
Human Resources Development Canada. (2001). Canada’s
retirement income system: What’s in it for you? Retrieved
from http://www.sdc.gc.ca/en/isp/common/ris/ris.pdf
Kelly, M., & Barratt, G. (2007). Retirement: Phantasy and
reality—Dying in the saddle or facing up to it? Psychodynamic
Practice, 13(2), 197–202. doi:10.1080/14753630701297859
Kim, S., & Feldman, D. C. (2000). Working in retirement: The
antecedents of bridge employment and its consequences
for quality of life in retirement. The Academy of Management
Journal, 43(6), 1195–1210.
175. Larson, R. (1978). Thirty years of research on the subjective
well-being of older Americans. Journal of Gerontology, 33,
109–125.
Laslett, P. (1987). The emergence of the Third Age. Ageing and
Society, 7, 133–160.
Laslett, P. (1991). A fresh map of life: The emergence of the
Third Age (paperback ed.). London, UK: George Wiedenfield
and Nicholson.
Lemon, B. W., Bengtson, V. L., & Peterson, J. A. (1972). An
exploration of the activity theory of aging: Activity types and
life satisfaction among in-movers to a retirement community.
Journal of Gerontology, 27, 511–523.
Lohmann, N. (1980). A factor analysis of life satisfaction,
adjustment and morale measures with elderly adults.
International Journal of Aging and Human Development, 11(1),
35–43.
Lowis, M., Edwards, A. C., & Burton, M. (2009). Coping with
retirement: Well-being, health, and religion. Journal of
psychology, 143(4), 427–448.
Magai, C., Consedine, N. S., King, A. R., & Gillespie, M.
(2003). Physical hardiness and styles of socioemotional func-
tioning in later life. Journal of Gerontology: Psychological
Sciences, 58B, 269–279.
Marhankova, J. H. (2011). Leisure in old age: Disciplinary
practices surrounding the discourse of active aging.
International Journal of Ageing & Later Life, 6(1), 5–32.
Mulenga, D., & Liang, J.-S. (2008). Motivations for older
adults’ participation in distance education: A study at the
176. National Open University of Taiwan. International Journal of
Lifelong Education, 27(3), 289–314. doi:10.1080/
02601370802047791.
Narushima, M. (2004). A gaggle of raging grannies: The
empowerment of older Canadian women through social activ-
ism. International Journal of Lifelong Education, 23(1), 23–42.
Neugarten, B. L., Havighurst, R. J., & Tobin, S. S. (1961). The
measurement of life satisfaction. Journal of Gerontology,
16, 134–143.
122 S. NGUYEN ET AL.
Sadler, W. A. (2006). Changing life options: Uncovering the
riches of the Third Age. LLI Review, 1, 11–20.
Taylor-Harris, D., & Zhan, H. J. (2011). The Third Age African
American seniors: Benefits of participating in senior
multipurpose facilities. Journal of Gerontological Social Work,
54(4), 351–371. doi:10.1080/01634372.2010.539588
Trentin, G. (2004). E-learning and the Third Age. Journal of
Computer Assisted Learning, 20(1), 21–30. doi:10.1111/
j.1365-2729.2004.00061.x
Uchino, B. N. (2004). Social support and physical health:
Understanding the health consequence of relationships. New
Haven, CT: Yale University Press.
Wahrendorf, M., Ribet, C., Zins, M., & Siegrist, J. (2008).
Social productivity and depressive symptoms in early old age-
results from the GAZEL study. Aging & Mental Health, 12(3),
310–316.
177. Weiss, R. S. (2005). The experience of retirement. Ithaca, NY:
Cornell University Press.
Weiss, R. S., Bass, S. A., Heimovitz, H., & Oka, M. (2005).
Japan’s silver human resources and participant well-being.
Journal of Cross-Cultural Gerontology, 20(1), 47–66.
doi:10.1077/s/10823-005-3797-4
Zimet, G. D., Dahlem, N. W., Zimet, S. G., & Farley, G. K.
(1988). The multidimensional scale of perceived social sup-
port. Journal of Personality Assessment, 52(1), 30–41.
APPENDIX
Instrument for Fears for Growing Old (FAGO) survey, Revised
after Pilot Study
Beside each of statements presented below, please indicate how
much you have each fear about
growing old.
1: Not at all 2: Little 3: Somewhat
4: Very much
PLEASE CIRCLE A NUMBER
a. Death . . . . . . . . . . . . . . . . . . . . . . . . . . . . . . . . . . . . . . . . .
. . . . . . . . . . . 1 2 3 4
b. Alzheimer’s disease, dementia, or other mental decline . . . . .
. . . . . . . . 1 2 3 4
c. Cancer, heart disease, stroke, or major debilitating disease . .
. . . . . . . . 1 2 3 4
d. Blindness, deafness, lameness, or incontinence . . . . . . . . . . .
. . . . . . . . 1 2 3 4
e. Loss of beauty, attractiveness, fertility, or potency . . . . . . . .
. . . . . . . . . 1 2 3 4
f. Inability to recall names, events, people, or experiences . . . .
178. . . . . . . . . . 1 2 3 4
g. Loss of keenness of hearing, eyesight, and smell . . . . . . . . .
. . . . . . . . . 1 2 3 4
h. Loss of physical mobility, being indoors, and the consequent
loss
of choice of places to go and things to do . . . . . . . . . . . . . . . . .
. . . . . . . 1 2 3 4
i. Loss of earning-power, being retired, or unemployed
because of age . . . . . . . . . . . . . . . . . . . . . . . . . . . . . . . . . . . .
. . . . . . . . . 1 2 3 4
j. Falling status, public status, and private status within the
family because of chronological age . . . . . . . . . . . . . . . . . . . .
. . . . . . . . 1 2 3 4
k. Loss of spouse, siblings, kin, friends, family, and
consequent desolation . . . . . . . . . . . . . . . . . . . . . . . . . . . . . . .
. . . . . . . . 1 2 3 4
l. Loss of home, having to live with other people, or in an
institution . . . . 1 2 3 4
m. The contraction of the future and frustration in fulfilling the
chosen plan of life . . . . . . . . . . . . . . . . . . . . . . . . . . . . . . . . .
. . . . . . . . 1 2 3 4
n. Mental health issue (e.g., depression) . . . . . . . . . . . . . . . . . .
. . . . . . . . . 1 2 3 4
o. Funeral and estate planning . . . . . . . . . . . . . . . . . . . . . . . .
. . . . . . . . . . 1 2 3 4
p. Fears of running out of retirement income for long-term
care before death . . . . . . . . . . . . . . . . . . . . . . . . . . . . . . . . . .
. . . . . . . . . 1 2 3 4
q. Loss of spiritual serenity when getting close to death . . . . . .
. . . . . . . . 1 2 3 4
180. Neuroscience, Gothenburg University, Sahlgrenska University
Hospital, Sweden, 4Australian Institute
for Suicide Research and Prevention, Griffith University,
Australia, 5Department of Social Welfare,
Aomori University of Health and Welfare, Japan, 6Department
of Mental Health, Community Mental
Health Centre, Padova, Italy, 7Department of Family Medicine
& Community Health, University of
Pennsylvania School of Medicine, USA, 8Department of
Psychiatry, University of Pittsburgh, USA,
9Center for the Study and Prevention of Suicide, Psychiatry,
University of Rochester Medical Center,
New York, USA, 10Academic Department for Old Age
Psychiatry, School of Psychiatry, University of New
South Wales, Sydney, Australia, 11The QPR Institute, Inc.,
Spokane, WA, USA, 12An international network
of researchers working on suicide in older people (contact
person, Annette Erlangsen, E-mail
[email protected])
Abstract. Background: Suicide rates are highest among the
elderly, yet research on suicide prevention in old age remains a
much-ne-
glected area. Aims: We carried out a systematic review to
examine the results of interventions aimed at suicidal elderly
persons and to
identify successful strategies and areas needing further
exploration. Methods: Searches through various electronic
databases yielded 19
studies with an empirical evaluation of a suicide prevention or
intervention program designed especially for adults aged 60
181. years and
older. Results: Most studies were centered on the reduction of
risk factors (depression screening and treatment, and decreasing
isolation),
but when gender was considered, programs were mostly
efficient for women. The empirical evaluations of programs
attending to the
needs of high-risk older adults seemed positive; most studies
showed a reduction in the level of suicidal ideation of patients
or in the
suicide rate of the participating communities. However, not all
studies used measures of suicidality to evaluate the outcome of
the
intervention, and rarely did they aim at improving protective
factors. Conclusions: Innovative strategies should improve
resilience and
positive aging, engage family and community gatekeepers, use
telecommunications to reach vulnerable older adult, and
evaluate the
effects of means restriction and physicians education on elderly
suicide.
Keywords: suicide, suicidal ideation, prevention, intervention,
systematic review, elderly
Studies show that in many countries suicides rates among
elderly persons are higher than or as high as young people
(De Leo & Spathonis, 2004; Shah, 2007). Yet, suicide in
old age is a much neglected area. In fact, there is a lack of
basic knowledge and training about elderly suicide among
clinicians (Heisel & Duberstein, 2005), as well as in suicide
prevention centers (Adamek & Kaplan, 1996).
On a worldwide level, the suicide rates are found to be
highest among the elderly. In 2000, the WHO estimated the
rates of men and women, aged 75 and older, to be 50 and
186. se
r a
nd
is
n
ot
to
b
e
di
ss
em
in
at
ed
b
ro
ad
ly
.
tion in the population will increase significantly all over the
world in the coming decades (Christensen, Doblhammer,
Rau, & Vaupel, 2009), the absolute number of suicides
among older adults is expected to increase accordingly.
187. From a theoretical perspective, suicide is considered an
outcome of both distal and proximal factors (Hawton & van
Heeringen, 2009). It is often helpful to think of suicidality
as a pathway where wishes to die and depression constitute
the first steps into the process toward suicide (Caine &
Conwell, 2001). Fortunately, the pathway does not inevita-
bly lead to suicidal actions and might at any point be inter-
rupted by internal or external factors. However, the process
also fluctuates over time, which makes it difficult for health
professionals to identify suicidal individuals (De Leo, Ce-
rin, Spathonis, & Burgis, 2005).
Prevention can be implemented at different levels, aim-
ing at different stages of suicidality depending on the tar-
geted population. The Institute of Medicine (Mrazek &
Haggerty, 1994) distinguishes between universal, selective,
and indicated prevention. Universal prevention aims at re-
ducing the incidence of new cases in entire populations,
such as a nation or a local community, typically through
information and skills enhancement. Selective prevention
focuses on high-risk groups that generally display no ad-
vance signs of suicidal thoughts or behavior, but are ex-
posed to important losses and life transitions that can make
them vulnerable to depression and suicide (e.g., the very
old and highly disabled, the recently retired or bereaved, or
those who suffer from painful chronic illnesses). This type
of prevention is typically aimed at reducing risk predictors
or improving resilience. Indicated prevention aims at indi-
viduals who clearly exhibit suicide risk behaviors, such as
those who have a psychiatric illness, who express wishes
to die or suicidal ideations, or who are at imminent danger
of attempting suicide.
Although psychiatric disorders are considered to be pre-
sent in up to 90% of all elderly suicides (O’Connell et al.,
188. 2004), it is recommended that preventive efforts employ a
multifaceted approach in order to obtain optimal effect
(O’Connell et al., 2004). While interventions aimed at
small high-risk groups are often implemented, these are
thought to have only little impact on the suicide rate as a
whole, which is why population-level strategies might be
more effective (Lewis, Hawton, & Jones, 1997).
A comprehensive review of strategies for preventing
suicides in all age groups identified the following policies:
(1) awareness and education (including physician educa-
tion and gatekeeper training), (2) screening, (3) treatment
interventions, (4) means restriction, and (5) codes of con-
duct for media coverage (Mann et al., 2005). Of these, phy-
sician education, gatekeeper training, and means restriction
were considered as more promising strategies (Mann et al.,
2005). Yet, we do not know how this applies to the more
specific context of elderly suicides. The current study pre-
sents a systematic review of all programs that focus exclu-
sively on older adults in order to appraise, synthesize, and
report evidence of their outcomes. More precisely, the re-
view will try to answer the following questions: (1) What
types of program are currently used to prevent elderly sui-
cide? (2) Which type of intervention is the most efficient
to reduce suicidal ideation or behavior or their associated
risk factors in elderly persons?
The current study was carried out by the Task Force on
Elderly Suicide for the International Association for Sui-
cide Prevention.
Method
The guidelines from the Cochrane Collaboration served as
an outline for the systematic review (Higgins & Green,
189. 2008). Studies were considered eligible if published in
peer-reviewed journals and when the participants consisted
only of elderly persons, defined as persons 65 years of age
or older. This limitation was later relaxed to include age 60
or older due to the low number of studies fulfilling the orig-
inal age cutoff limit. Any intervention aiming at reducing
suicidality (suicidal ideation, suicidal behavior, or death by
suicide) and which included an empirical evaluation was
considered. Priority was given to outcomes directly related
to measures of suicidality; secondary priority was given to
depression ratings.
Studies were identified through electronic searches of
the Cochrane library, MEDLINE, ERIC, PsycINFO data-
bases (1966–2009), cross-reference checks, and the collab-
oration of the members of the International Research Group
on Suicide among the Elderly. The search was carried out
using index and free-text search terms for suicide, suicidal
ideation, suicidal behavior, attempted suicide, prevention,
intervention, mental health program, program evaluation,
as well as elderly, older adults, and aged (65 years and old-
er) in the age group. All languages and publication years
were considered. The search was carried out in November
2009.
Similar interventions, i.e., primary care interventions or
telephone counseling interventions, were presented togeth-
er. Levels of evidence were reported based on the Oxford
Centre for Evidence-Based Medicine (Oxford CEBM,
2009), where levels vary from 1 to 5, 1 being the highest
level of evidence for a randomized control study. Articles
summarizing findings from same data collection were con-
sidered jointly and priority was given to outcomes from the
longest follow-up period. Meta-analyses were preferred to
single studies. For instance, five individual cohort studies
(Oyama, Fujita, Goto, Shibuya, & Sakashita, 2006; Oyama,
199. ed
b
ro
ad
ly
.
these studies on suicide in old age only made recommen-
dations about ways to prevent elderly suicide, few describe
implemented interventions and even less evaluated them
empirically. Of the 490 articles, only 19 met the inclusion
criteria of an empirical evaluation of a suicide prevention
or intervention program. In three cases, effects of their pro-
gram were described in two subsequent publications, while
five studies were combined in a meta-analysis, yielding a
total of 11 different interventions. They are presented in
Table 1 according to the Oxford CEBM (2009).
Results
Primary Care Interventions
The systematic review identified two primary care collab-
orative treatment strategies: the IMPACT (Unützer et al.,
2002, 2006) and PROSPECT studies (Alexopoulos et al.,
2009; Bruce et al., 2004), both of which used a randomized
controlled trial design (Level 1 on the Oxford classification
of evidence) to examine the effect of their program on de-
pressed elderly patients from primary care settings and to
compare it to usual care. Participants in the intervention
groups of both studies received support from depression
205. in
at
ed
b
ro
ad
ly
.
efficacy and greater confidence in managing their depres-
sion (Hunkeler et al., 2006; Unützer et al., 2002).
In the PROSPECT study (Prevention of Suicide in Pri-
mary Care Elderly: Collaborative Trial), primary care prac-
tices were randomly assigned to provide either the care
management intervention or usual care (Alexopoulos et al.,
2009). Results showed that, after 24 months, decline in sui-
cidal ideation was 2.1 times greater [0.8–5.5] in the inter-
vention group (16.9%; at baseline, 29.7%) than in usual-
care group (17.4%; at baseline, 20.4%), though the differ-
ence was not statistically significant (p = .11). The benefits
were limited to patients with major depression who had a
significant lower level of active suicidal desire at 4, 8, and
24 months, compared to the usual-care group. The differ-
ences were not statistically significant among patients with
minor depression. It should be noted that the study carried
relatively high refusal and dropout rates. Furthermore, nei-
ther of these randomized trials made gender specific dis-
tinctions with regard to the impact of the intervention.
206. Community-Based Outreach
Various Japanese cohort studies have implemented com-
munity-based outreach programs in rural areas of the coun-
try, where the suicide rate was elevated (over 150/100,000)
for both men and women aged 65 years and older (Chiu,
Takahashi, & Suh, 2003; Oyama et al., 2004, 2005; Oyama,
Fujita et al., 2006; Oyama, Goto et al., 2006; Oyama, Ono
et al., 2006). These programs typically included mental-
health workshops for the elderly, conducted by municipal
public health nurses, to promote awareness of depression
and suicide risk. The programs also included annual de-
pression screenings of all residents aged 65 years and over.
Positive results on the screening test were followed by a
clinical interview with a psychiatrist (where available) or
a general practitioner (GP) with follow-up meetings with
mental health nurses. In another cohort study (Oyama et
al., 2005), the program was different: group activities (so-
cial, recreational, physical, volunteering) to reinforce so-
cial support and no systematic depression screenings but a
recommendation to participants to self-assess depression
with a short questionnaire.
The empirical studies from Japan (Oyama et al., 2005,
2008) were carried out in localized areas, and the age-ad-
justed incidence rate ratios of suicide (IRR: number of sui-
cide cases divided by the population) were compared to
baseline rates and to those in the comparison region. The
results of the meta-analysis (Oyama et al., 2008) showed
significant reductions in the rate ratio of suicide, compared
to baseline, but mostly among women whose risk was re-
duced by around 70%. The reduction in older men’s suicide
rate ratios appeared to be associated with the presence of
follow-up assessment by a clinical psychiatrist (IRR = 0.3
[0.1–0.7]), whereas no significant reduction was found for
follow-up by GPs (IRR = 0.7 [0.4–1.2]). Oyama et al.
207. (2005) had similar results. From the five studies included
in the meta-analysis, two showed a significant reduction in
the suicide rate for the males (Oyama et al., 2004; Taka-
hashi et al., 1998). Those particular interventions included
educational activities, which emphasized that suicide is
avoidable. During the years the programs were implement-
ed, the suicide rate of the comparison areas remained high
for both men and women, although the baseline suicide
rates and socioeconomic characteristics were similar. Inter-
vention centered on depression screening and group activ-
ities seem very efficient for females, while there was no
significant reduction for males in all but the two studies
mentioned above.
Telephone Counseling
Four studies implemented telephone counseling outreach
programs (De Leo, Carollo, & Dello Buono, 1995; De Leo,
Dello Buono, & Dwyer, 2002; Fiske & Arbore, 2000; Mor-
row-Howell, Becker-Kemppainen, & Judy, 1998). De
Leo’s team evaluated the long-term impact on suicide rates
of a telephone service that included (1) Tele-Help, a 24 h
emergency service for elders to call for help, and (2) Tele-
Check, a twice-weekly telephone support. After 11 years
(priority was given to the publication presenting the longest
follow-up period), the number of observed suicide (n = 6)
of elderly service users living in the intervention area was
statistically significantly lower (χ2 (1) = 10.6, p < .001) than
the expected number (n = 20.86) calculated from the pre-
vailing rate in the region (De Leo et al., 2002), with a stan-
dardized mortality ratio indicating that only 28.8% of the
expected suicide mortality occurred. This intervention also
had a positive impact on clients’ psychosocial functioning
(reductions in depression scores, hospital admission, and
requests for home visit by GPs). Telephone outreach pro-
213. ly
.
A paired t-test revealed that there was a significant reduc-
tion in hopelessness, but no significant changes in depres-
sive symptoms. The last two studies did not include specif-
ic measures of suicidality even if they were dedicated to
elderly at risk of suicide.
Clinical Treatment
In Szanto, Mulsant, Houck, Dew, and Reynolds’s research
(2003), data from three intervention studies were pooled to
evaluate a short-term (12-week) depression treatment using
pharmacotherapy, with or without interpersonal psycho-
therapy sessions (IPT). The goal of the analysis was to
compare the impact of the intervention on suicidal ideation
and depression according to the patients’ level of suicidal-
ity: high, moderate, or low risk. After 12 weeks of treat-
ment, suicidal ideation had resolved in all treated patients
regardless of treatment assignment, and only 4.6% still re-
ported thoughts of death. Patients with higher suicide risk
needed longer time to respond to treatment (6 weeks) com-
pared to low-suicide-risk elders (3 weeks). With a similar
intervention, Szanto et al. (2001) also found high remission
rates (defined by a score of 10 or lower on the Hamilton
Depression Scale) in both suicidal (77%) and nonsuicidal
(78%) depressed older adults; however, there was a higher
relapse rates in ideators (26% vs. 13%) during maintenance
treatment. The authors concluded that medical treatment,
and potentially IPT, was able to reduce suicidal ideations
in older persons. The studies did not report differential im-
pact of treatment on elderly men and women.
214. Improving Resilience
All previously mentioned studies addressed risk factors
(depression or isolation), basing their intervention ap-
proach on the strong associations of mental illness or social
factors with suicidal behavior. Instead, two intervention
programs focused on strengthening protective factors to
improve older adults’ resilience to suicidality. One program
included an 11-week workshop, based on a cognitive-be-
havioral approach, which was offered to small groups of
early retirees who had problems adapting to retirement. It
aimed at increasing meaning in life by helping participants
set, plan, pursue, and realize meaningful, concrete personal
goals (Lapierre, Dubé, Bouffard, & Alain, 2007). Levels of
depression and psychological distress decreased signifi-
cantly among participants in the program compared to
those of the control group (participants of another study on
adaptation to retirement) which remained high. Program
participants also improved significantly on hope, goal re-
alization, serenity, flexibility, and attitude toward retire-
ment. The gains were maintained six months later. Eighty
percent of the experimental group, but only 36% of the
control group, reported absence of suicidal ideation at the
6-month follow-up. The group intervention format could
be adding some protection against suicide as well as the
behavioral activation of the participants.
The other program provided a 16-week interpersonal
psychotherapy, for adults over 60 years at elevated risk for
suicide, to improve their social functioning and skills in
order to enhance social support and satisfaction of interper-
sonal needs (Heisel, Duberstein, Talbot, King, & Tu, 2009).
Although the group was small, results indicated a signifi-
cant reduction between pre- and posttreatment on the se-
215. verity of depressive symptoms and on the score of the Ge-
riatric Suicide Ideation Scale. The authors stressed the im-
portance of a strong therapeutic alliance, round the clock
access to the therapist, and the possibility for patients to
talk openly about suicidal thoughts during sessions. The
data concerning enhancement of social adjustment and per-
ceived social support have yet to be published.
Discussion
This systematic review showed that 19 of the 490 publica-
tions on elderly suicide presented an empirical evaluation
of a prevention or intervention program focusing on older
adults. Compared to the 83 studies on adult populations,
identified by Mann et al. (2005) in their systematic review
of suicide prevention strategies, our review showed a lack
of evidence-based studies designed for the aged. There
could be other studies that evaluated the effects of inter-
vention programs on dimensions we consider as risk fac-
tors, but if the authors did not conceive them as means for
late life suicide prevention, they could not be retrieved in
the review because they did not match the search terms.
Moreover, although all 19 studies hoped to reduce suicid-
ality by targeting known risk factors for older adults, some
did not evaluate this outcome measure, but evaluated only
the effects on depression or hopelessness.
The synthesis of the 19 studies yielded 11 different in-
terventions presented here. Of these, three studies had sui-
cide rate as the outcome measure, four studies looked at the
impact on suicidal ideation, and four studies were limited
to the assessment of depression levels. It would be interest-
ing if future research would select similar outcome vari-
ables in order to efficiently compare the effects of various
types of interventions.
220. nd
is
n
ot
to
b
e
di
ss
em
in
at
ed
b
ro
ad
ly
.
found a significant reduction in this outcome variable. The
empirical evaluations of programs attending to the needs
of high-risk older adults seemed positive.
Programs aiming at improving protective factors are still
rare, even if some authors have emphasized social interac-
221. tion and communication through activation programs (Hei-
sel et al., 2009; Oyama et al., 2005; Oyama, Ono et al.,
2006; Unützer et al., 2006) or the realization of meaningful
personal goals (Lapierre et al., 2007). Strategies that en-
hance positive aging and quality of life by increasing em-
powerment, coping and adaptive behavior (Heisel & Du-
berstein, 2005), flexibility (Brandtstädter & Rothermund,
2002), social skills (Hinrichsen & Hernandez, 1993), self-
esteem (Chatterton, Hall, & Tarrier, 2007), sense of belong-
ing (McLaren, Gomez, Bailey, & Van Der Horst, 2007),
reasons for living (Malone et al., 2000), hope (Snyder &
Rand, 2004), meaning in life (Edwards & Holden, 2001;
Heisel & Flett, 2004), religion or spirituality (Dervic et al.,
2004), and even humor (Richman, 1993) could be innova-
tive and promising ways to prevent suicide in older adults.
Gender Differences
Gender-specific distinctions regarding the impact of the in-
terventions were seldom considered. However, when gen-
der was considered, most programs appeared to have ben-
efited women more than men. Women are more likely than
men to use social resources and mental health services
(Drapeau, Boyer, & Lesage, 2009), so workshops, tele-
phone counseling, and group meetings are more likely to
appeal to them. Older men, on the other hand, are particu-
larly less inclined to seek medical advice (Drapeau et al.,
2009) and could prefer intervention programs that focus on
action and problem solving rather than the expression of
emotions or creating new relationships.
Moreover, researchers from the IMPACT trial, described
above, found that older men were significantly less likely
than women to be referred to the collaborative-care treat-
ment program (Hinton, Zweifach, Oishi, Tang, & Unützer,
2006). They observed significant gender differences in the
222. presentation of depressive symptoms. Qualitative inter-
views, with 30 clinicians involved in the IMPACT trial,
indicated that older men expressed their depression atypi-
cally, making it more difficult to recognize and complicat-
ing the referral process (Hinton et al., 2006). It seemed that
men endorsed core symptoms, like feeling down and lack
of interest, less often than older women. On the other hand,
they were also more likely to express their distress through
somatic symptoms or interpersonal stress. Informants add-
ed that older men could have difficulty assessing and rec-
ognizing their emotions and could try to conceal their de-
pression to avoid mental illness, stigma, and feelings of
shame often associated with their negative perception of
the disorder (Hinton et al., 2006). The authors suggested
that future avenues for intervention should address attitu-
dinal barriers to help-seeking and treatment in older men
by deemphasizing labeling of depression and accentuating
the focus on symptoms and stressors (Hinton et al., 2006).
Future research should also seek new ways of reaching sui-
cidal older men, for example by training community gate-
keepers (Matthieu, Cross, Batres, Flora, & Knox, 2008).
Risk assessment could be improved by addressing a wider
than usual range of issues (Lapierre et al., 2011), such as
those frequently faced by suicidal older men, such as in-
voluntary retirement, pain, dependency, daily hassles, sleep
problems, loss of driver’s license, bereavement, and, in par-
ticular, alcohol abuse. None of the suicide prevention pro-
grams addressed substance use in elderly males, even
though a retrospective case-control study showed that al-
cohol dependence or misuse was observed in 35% of the
elderly men who died by suicide, and that alcohol use dis-
order remained an independent predictor of suicide risk
(Waern, 2003). Oyama et al. (2008) added that intervention
programs should also address older men’s impulsivity,
which makes them more at risk for suicidal behavior (Neu-
223. feld & O’Rourke, 2009). Studies evaluating suicide pre-
vention programs should have sufficient power to test the
differential impact on men and women; more research is
still needed to determine the type of intervention that might
have a positive influence on older men. We should add that
no studies looked at the differential impact of their pro-
grams on young- and old- elderly persons to see if each
group presents different challenges.
Future Interventions
Improvement in the detection, treatment, and management
of mood disorders should still be the primary focus of sui-
cide prevention. In addition, new programs should involve
relatives, because they are an important part of the lives of
many elderly individuals (Richman, 1993). Moreover, fam-
ily members, but also friends, formal and informal caregiv-
ers, who are in regular contact with distressed older adults,
may have valuable information regarding life context and
suicidal risk that health professionals are lacking or un-
aware of (Waern, Beskow, Runeson, & Skoog, 1999). It
seems necessary to involve them in the treatment process.
All opportunities (home visits, case management, nursing
care, follow-up, contacts with caregivers) must be used to
increase chances for suicide prevention. According to
Jones (2002), telephone counseling outreach programs
(such as TeleHelp-TeleCheck services) seem to give the
essential elements to the prevention of suicide, that is, a
regular, confiding relationship with a helping person, and
a method of increasing the person’s sense of mastery, in
spite of the physical distance with the health care staff. One
of the important findings of the telecommunication studies
is that face-to-face contact may not be required for success-
ful mental health care interventions (De Leo et al., 2002;
Fiske & Arbore, 2000; Morrow-Howell et al., 1998). Many
elderly patients find medical centers intimidating and their
228. e
di
ss
em
in
at
ed
b
ro
ad
ly
.
considers that using telecommunications to expand educa-
tion and support as well as detection and treatment of men-
tal illness should be a key component of health service
planning. Round the clock access to the therapist could also
be helpful, creating a lifeline that could increase feelings
of security (Heisel et al., 2009).
According to Motohashi, Kaneko, and Sasaki (2004),
the content of suicide prevention programs must be multi-
faceted to answer the needs of suicidal persons. In addition
to the early detection (with the help of family and commu-
nity gatekeepers) and treatment of high-risk elderly indi-
viduals, physician education and increased outreach to old-
er adults are key strategies for suicide prevention. Suo-
minen, Isometsä, and Lönnqvist (2004) have indicated that
229. the majority (93%) of elders who have attempted suicide
have seen a health professional in the last 12 months. How-
ever, only 38% had received a diagnosis indicating a mood
disorder. Although patients seem to have difficulties in
communicating their wish to die to their doctor (Fekete,
Osvath, & Michel, 2004; Wittink, Barg, & Gallo, 2006;
Wittink, Dahlberg, Biruk, & Barg, 2008), contacts with
health professionals are probably a form of help-seeking
and could constitute a special opportunity for prevention.
Therefore, in primary care settings, valuable strategies
should include seeing patients frequently and regularly to
monitor adherence to the prescribed regimen and response
to treatment, and offer support to address sources of distress
(Grek, 2007). Furthermore, many studies found that painful
chronic diseases or sleep disorders were associated with
suicidal ideation (Lapierre et al., 2011). Since older adults
might report more easily sleep problems or physical pain
than depression to their family doctors (Pan, Lee, Chiang,
& Liao, 2009), attention should be directed to the evalua-
tion of these difficulties as part of the investigation of pos-
sible suicide risk. However, since doctors alone cannot ded-
icate the time needed by high-risk patients, collaborative
care models, such as IMPACT and PROSPECT, can im-
prove outcomes by offering access to the services of de-
pression care managers (nurses, psychologist, or social
workers). Our review did not identify any published studies
that evaluated the impact of physicians’ education on el-
derly suicide, although it is often strongly recommended
for recognition of persons at risk of suicide (Gilbody, Whit-
ty, Grimshaw, & Thomas, 2003). Considering previous suc-
cessful experience with educational programs on depres-
sive disorders for general practitioners (Rutz, von Knorr-
ing, & Wålinder, 1992), this might be an area to explore
further in future primary care intervention. Already, PROS-
PECT and IMPACT studies have included algorithm-based
recommendations for physicians.