Balancing the line by using heuristic method based on cpm in salbp –a case study

Abstract In mass production systems, line balancing plays a great role, but this is not easy even if it is a simple straight line. So, in order to solve these problems Heuristic methods are very much desirable. It is also found that Heuristic methods play a great role in the formation of metaheuristic methods.Therefore it is very much important to use more efficient heuristic methods. In this research paper we presents a heuristic method that is based on critical path method for simple assembly line balancing. This research is mainly concerned with objectives of minimizing the number of workstations, improvement of smoothness index, mean absolute deviation (MAD) and increasing line efficiency. Keywords-Heuristic methods,Assembly line balancing problem, Critical path method, Simple assembly line balancing.

Recommended
More Related Content
What's hot
What's hot (20)
Viewers also liked
Similar to Balancing the line by using heuristic method based on cpm in salbp –a case study
Similar to Balancing the line by using heuristic method based on cpm in salbp –a case study (20)
More from eSAT Journals
More from eSAT Journals (20)
Recently uploaded
Recently uploaded (20)
Balancing the line by using heuristic method based on cpm in salbp –a case study
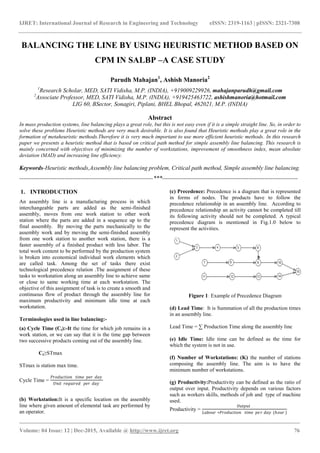
- 1. IJRET: International Journal of Research in Engineering and Technology eISSN: 2319-1163 | pISSN: 2321-7308 _______________________________________________________________________________________ Volume: 04 Issue: 12 | Dec-2015, Available @ http://www.ijret.org 76 BALANCING THE LINE BY USING HEURISTIC METHOD BASED ON CPM IN SALBP –A CASE STUDY Parudh Mahajan1 , Ashish Manoria2 1 Research Scholar, MED, SATI Vidisha, M.P. (INDIA), +919009229926, mahajanparudh@gmail.com 2 Associate Professor, MED, SATI Vidisha, M.P. (INDIA), +919425463722, ashishmanoria@hotmail.com LIG 60, BSector, Sonagiri, Piplani, BHEL Bhopal, 462021, M.P. (INDIA) Abstract In mass production systems, line balancing plays a great role, but this is not easy even if it is a simple straight line. So, in order to solve these problems Heuristic methods are very much desirable. It is also found that Heuristic methods play a great role in the formation of metaheuristic methods.Therefore it is very much important to use more efficient heuristic methods. In this research paper we presents a heuristic method that is based on critical path method for simple assembly line balancing. This research is mainly concerned with objectives of minimizing the number of workstations, improvement of smoothness index, mean absolute deviation (MAD) and increasing line efficiency. Keywords-Heuristic methods,Assembly line balancing problem, Critical path method, Simple assembly line balancing. --------------------------------------------------------------------***--------------------------------------------------------------------- 1. INTRODUCTION An assembly line is a manufacturing process in which interchangeable parts are added as the semi-finished assembly, moves from one work station to other work station where the parts are added in a sequence up to the final assembly. By moving the parts mechanically to the assembly work and by moving the semi-finished assembly from one work station to another work station, there is a faster assembly of a finished product with less labor. The total work content to be performed by the production system is broken into economical individual work elements which are called task. Among the set of tasks there exist technological precedence relation .The assignment of these tasks to workstation along an assembly line to achieve same or close to same working time at each workstation. The objective of this assignment of task is to create a smooth and continuous flow of product through the assembly line for maximum productivity and minimum idle time at each workstation. Terminologies used in line balancing:- (a) Cycle Time (Ct):-It the time for which job remains in a work station, or we can say that it is the time gap between two successive products coming out of the assembly line. Ct≥STmax STmax is station max time. Cycle Time = 𝑃𝑟𝑜𝑑𝑢𝑐𝑡𝑖𝑜𝑛 𝑡𝑖𝑚𝑒 𝑝𝑒𝑟 𝑑𝑎𝑦 𝑈𝑛𝑖𝑡 𝑟𝑒𝑞𝑢𝑖𝑟𝑒𝑑 𝑝𝑒𝑟 𝑑𝑎𝑦 (b) Workstation:It is a specific location on the assembly line where given amount of elemental task are performed by an operator. (c) Precedence: Precedence is a diagram that is represented in forms of nodes. The products have to follow the precedence relationship in an assembly line. According to precedence relationship an activity cannot be completed till its following activity should not be completed. A typical precedence diagram is mentioned in Fig.1.0 below to represent the activities. Figure 1: Example of Precedence Diagram (d) Lead Time: It is Summation of all the production times in an assembly line. Lead Time = ∑ Production Time along the assembly line (e) Idle Time: Idle time can be defined as the time for which the system is not in use. (f) Number of Workstations: (K) the number of stations composing the assembly line. The aim is to have the minimum number of workstations. (g) Productivity:Productivity can be defined as the ratio of output over input. Productivity depends on various factors such as workers skills, methods of job and type of machine used. Productivity = 𝑂𝑢𝑡𝑝𝑢𝑡 𝐿𝑎𝑏𝑜𝑢𝑟 ∗𝑃𝑟𝑜𝑑𝑢𝑐𝑡𝑖𝑜𝑛 𝑡𝑖𝑚𝑒 𝑝𝑒 𝑟 𝑑𝑎𝑦 (ℎ𝑜𝑢𝑟 )
- 2. IJRET: International Journal of Research in Engineering and Technology eISSN: 2319-1163 | pISSN: 2321-7308 _______________________________________________________________________________________ Volume: 04 Issue: 12 | Dec-2015, Available @ http://www.ijret.org 77 (h) Bottleneck: It is defined as the delay in transmission due to which there is slow down in the production rate. This can be overcome by balancing the line. (i) Smoothness Index: It tells about the load distribution between different work stations compare to a station consuming maximum time. SI = (𝑆𝑇𝑚𝑎𝑥 − 𝑆𝑇𝑖)2𝑘 𝑖=1 Where STmax = maximum station time STi = Station time of station i (j) Balance Delay: This is the ratio of total ideal time on the line to the total time spent by the job on the assembly line.. BD = 𝑘 ∗ 𝑐𝑡 − ( 𝑆𝑇𝑖𝑘 𝑙=1 ) / 𝑘 ∗ 𝐶𝑇 ∗ 100% (k) Line efficiency: Line Efficiency can be defined as the ratio of the total station time to the cycle time multiplied by the number of the work station, or, in other words it is the rate of total station time to the product of the cycle time and the number of work station. We can express this as LE = 𝑆𝑇𝑖𝑀 𝑖=1 𝑐∗𝑘 X100 % Where: k – total number of workstations, C– cycle time STi – station time 2. METHODOLOGY The suggested method is based on critical pathmethod .The critical path method (Heerkens, 2001)(CPM) is a very popular method and it is used widely inproject management problems. Steps followed for balancing line by Critical path method:- a) First of all find minimum feasible number of work stations (S) S= , If S is not an integer we round it up. b) Calculate minimum feasible cycle time (MCT) MCT= C) Calculate modified cycle time (CT* ) CT* = The stations are arranged according to this modified cycle time, the basic steps followed in critical path method are- Here we have to first find the critical path ,the activities of the critical path method are given the higher priority The other activities are used when the precedence relationship is not satisfied and when stations capacities are not used completely Precedence Diagram of Eicher Motors Pvt.Ltd. 3. PROBLEM FORMULATION In this research work, a new Heuristic method based on CriticalPath Method is compared with the existing heuristic methods and prime number of work stations are found out. Our main motive is to minimise the number of work stations in order to increase the efficiency and to improve some parameters such as Smoothness index and Mean absolute deviation. 3.1. Illustrative Example M/s EICHER, Pithampur Eicher Pvt. Ltd. Is located at Pithampur near Indore (Madhya Pradesh) It is a manufacturing unit of Eicher trucks and busses. It was set up in 1986 and it was first commercial plant in central India spread over 83 acres of land. The company is producing variety of trucks out of these models two models are the major models for which the existing line has been set up. The cycle time for each work station is 8.10 min. The Company has well equipped modern machineries for its assembly operations. The company is having multi product mixed model assembly line for producing variety of products at the same time .The Company has large range of products like Heavy commercial vehicle (HCV), Light commercial vehicle (LCV), LCV1090, and MCV. If the product of different part family is required the set- up is changed and the assembly operation of same part family can be started. Data for the present work has been collected was as follows: numbers of tasks are 15 for LCV, 59.97% is line efficiency.
- 3. IJRET: International Journal of Research in Engineering and Technology eISSN: 2319-1163 | pISSN: 2321-7308 _______________________________________________________________________________________ Volume: 04 Issue: 12 | Dec-2015, Available @ http://www.ijret.org 78 3.1.1. Task Detail of LCV(Light commercial Vehicle) Table:-1. Task details of LCV (Light commercial vehicle) TaskNo. Element Task Description TaskTime Precedence 01 Hub And Drum Washing 4.36 02 Hub And Drum Assembly 3.33 01 03 Bearing Races And Pressing 3.1 02 04 Shim Selection 4 03 05 Hub Gearing And Oil Seal Pressing 4.52 04 06 Diff. Line And Crown Assembly 7.5 05 07 Press B 3.93 06 08 Press C 4.28 07 09 Diff. Line Final Assembly 4.47 08 10 Load Main Washing Machine 4.25 11 Unload Main Washing Machine 6.29 10 12 Punching 6.93 11 13 Brake Assembly (R/L) 3.23 12 14 Hub Assembly On Rr(L/R) 6.58 09,13 15 Diff. Fitment & Painting Front Axle 6.1 14 3.1.2. Allocation of task by RPW Method to Work Station with efficiency of each station in % Table 1.1:-Allocation by RPW method TaskNo. Element Task Description TaskTime TotalTaskTime Station Eff.In% 01 hub and drum washing 4.36 7.69 01 94.93 02 Hub And Drum Assembly 3.33 03 Bearing Races And Pressing 3.1 7.1 02 87.65 04 Shim Selection 4.00 05 Hub Gearing And Oil Seal Pressing 4.52 4.52 03 55.50 10 Load Main Washing Machine 4.25 4.25 04 52.46 06 Diff. Line And Crown Assembly 7.5 7.5 05 92.59 11 Unload Main Washing Machine 6.29 6.29 06 77.65 07 Diff. Line Final Assembly 3.93 3.93 07 48.51 12 Punching 6.93 6.93 08 85.55 08 Press B 4.28 7.51 09 92.71 13 Brake Assembly (R/L) 3.23 09 Press C 4.47 4.47 10 55.18 14 Hub Assembly On Rr(L/R) 6.58 6.58 11 81.23 15 Diff. Fitment & Painting Front Axle 6.1 6.1 12 75.30 3.1.3. Allocation of task by SPT Method to Work Station with efficiency of each station in % Table 1.2:-Allocation by SPT (Shortest Processing Time) method TaskNo. Element Task Description TaskTime Station TotalTask Time Eff.In% 10 Load Main Washing M/C 4.25 01 4.25 52.46 01 Hub And Drum Washing 4.36 02 7.69 94.93 02 Hub And Drum Assembly 3.33 11 Unload Main Washing M/C 6.29 03 6.29 77.65 12 Punching 6.93 04 6.93 85.55 3 Bearing Races And Pressing 3.1 05 6.33 78.14 13 Brake Assembly (R/L) 3.23 04 Shim Selection 4 06 4 49.38 05 Hub Gearing And Oil Seal Pressing 4.52 07 4.52 55.80 06 Diff. Line And Crown Assembly 7.5 08 7.5 92.59 07 Press B 3.93 09 3.93 48.51 08 Press C 4.28 10 4.28 52.83 09 Diff. Line Final Assembly 4.47 11 4.47 55.18 14 Hub Assembly On Rr(L/R) 6.58 12 6.58 81.23 15 Diff. Fitment & Painting Front Axle 6.1 13 6.1 75.30 3.1.4. Allocation of task by proposed method based on CPM to Work Station with efficiency of each station in % Table 1.3:- Allocation by Proposed method Task No. Task Time Total Task Time Station Efficiency In % 01 4.36 7.69 01 94.93 02 3.33 03 3.10 7.35 02 90.74 10 4.25 04 4.00 4.00 03 49.38 05 4.52 4.52 04 55.80 06 7.50 7.50 05 92.59 11 6.29 6.29 06 77.65 12 6.93 6.93 07 85.55 07 3.93 7.16 08 88.39 13 3.23 08 4.28 4.28 09 52.83 09 4.47 4.47 10 55.18 14 6.58 6.58 11 81.23 15 6.10 6.10 12 75.30
- 4. IJRET: International Journal of Research in Engineering and Technology eISSN: 2319-1163 | pISSN: 2321-7308 _______________________________________________________________________________________ Volume: 04 Issue: 12 | Dec-2015, Available @ http://www.ijret.org 79 4. RESULTS Results has been taken by applying all three methods Rank positional weight, smallest processing time, heuristic method based on CPM on the data taken from EICHER Pvt. Ltd The comparison of all methods is shown in tabular form and graphical form. Table 1.4.:- Comparison between Current Method, RPW, SPT and CPM Method S. No. Description Present method RPW Method SPT Method CPM 1 Cycle time 8.10 min. 8.10 min. 8.10 min. 8.10 min. 2 Line efficiency 59.97% 74.96% 69.20% 74.96% 3 No. of work station 15 12 13 12 4 Smoothness index 13.6515 8.428 10.20 8.38 5 Mean absolute deviation 1.2146 1.1875 1.2592 1.1708 Fig 1.1 Figure 1.1, 1.2. Representing comparison in graphical form 5. CONCLUSION AND FUTUTRE SCOPE From the present analysis it is concluded that all three methods gives better results than the present method which is being used by the Eicher Pvt. Ltd. But if we compare Ranked positional method, Shortest processing time method and Heuristic method based on critical path method, it is found that Heuristic method based on CPM gives the better result in present industry. This Heuristic approach shows better results as compared with present traditional method in Eicher Pvt. Ltd. From beginning to till now procedure is going on without any change in assembly line. Any approach is not adopted by them for productivity improvement, but now a day’s competition is increasing and each company wants to manufacture a product with good quality, minimum time and in minimum cost. This research work concentrate on minimize the production time so the major role of this study is to look all these problems and introducing the heuristic approach according to minimize slack time at each workstation and get task shorter period of time. Although some of heuristic methods reduces work stations, but they do not give considerable results for other indexes. This new heuristic method based on CPM is an approximation method like the other heuristic methods, but it has better efficient results. Since heuristic approaches are the foundation of metaheuristic methods, so suggested heuristic method based on CPM can increase the effectiveness of metaheuristic approaches like simulated annealing, genetic algorithm and ant colony optimization at SALBP. Applying proposed method in parallel, U-shaped, and other types of production lines can be applied in future researches Further research may include: (i) Investigation of applying other heuristics to improve the effectiveness. (ii) Extension of methods to consider more practical resource constraints. (iii) Extension of methods in order to reduce the number of workstations required for a given number of resources. (iv) Extension of methods in order to reduce the cycle time for a given number of workstations and resources, etc. 6. REFRENCES [1] M. Krishnamoorthy (1968) “Critical Path Method -A Review,” PHD Report submitted in Department of Industrial Engineering University of Michigan, pp.(1- 110) [2] Ming Lu and Heng Li (2003) “Resource-Activity Critical-Path Method for Construction Planning,” In Journal of Construction Engineering and Management, vol.129, pp. (412-420) [3] M. Fathi; A. Jahan; M. K. A. Ariffin; N. Ismail (2011) “A new heuristic method based on CPM in SALBP” Journal of Industrial Engineering International pp. (1- 11) [4] Chowdury Md. Luthfur Rahman (2010)” Re-balancing of Generalized Assembly Lines – Searching Optimal Solutions for SALBP” In Proceedings of the 2010 International Conference on Industrial Engineering and Operations Management Dhaka, Bangladesh. [5] Hsiu-Hsueh Kao, Din-Horng Yeh and Yi-Hsien Wang (2011)” Resource Constrained Assembly Line Balancing Problem Solved with Ranked Positional Weight Rule” ISSNs: 1923-7529; 1923-8401 © Academic Research Centre of Canada. [6] Ozcan Kilincc (2011)” Firing sequences backward algorithm for simple assembly line balancing problem
- 5. IJRET: International Journal of Research in Engineering and Technology eISSN: 2319-1163 | pISSN: 2321-7308 _______________________________________________________________________________________ Volume: 04 Issue: 12 | Dec-2015, Available @ http://www.ijret.org 80 of type 1” In journal of Computers & Industrial Engineering pp.830–839 [7] Mingzhou Jina, S. David Wub (2002) “A newheuristic method for mixed model assembly linebalancing problem”. In journal of Computers& IndustrialEngineering,Vol. 44, pp.159–169. [8] Christian Becker, Armin Scholl Invited review (2006)“A survey on problems and methods in generalizedassembly line balancing”. IN European Journal ofOperational Research Vol.168, pp.694–715