1. Oligopoly is a market structure with few sellers who recognize their interdependence. Each seller's actions impact competitors and reactions are uncertain.
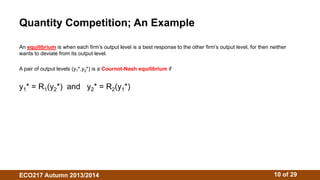
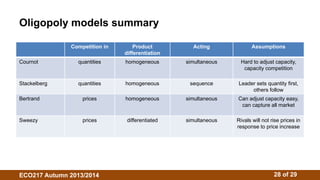
2. There is no single oligopoly theory due to different behavioral assumptions. Models include Cournot (firms choose quantities), Stackelberg (firms choose quantities sequentially), and Bertrand (firms choose prices).
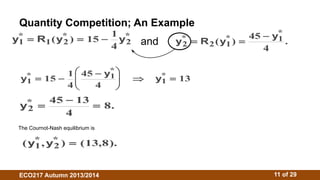
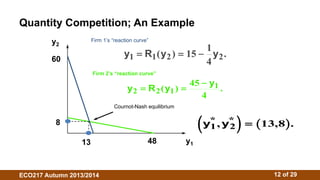
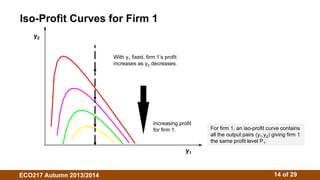
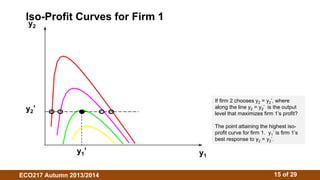
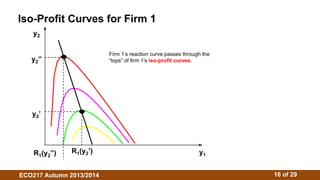
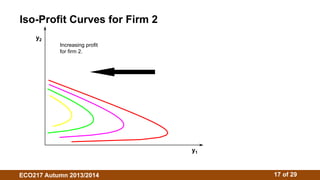
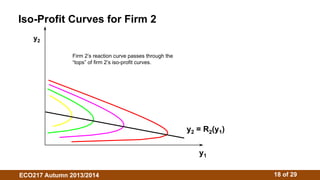
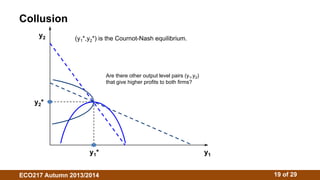
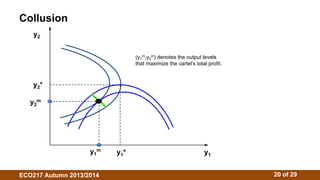
3. The Cournot model assumes firms choose outputs simultaneously. Their reaction functions determine the Cournot-Nash equilibrium where outputs maximize profits given competitors' outputs. Isoprofit curves illustrate profit-maximizing outputs under different competitor outputs.