Downloaded 3,593 times


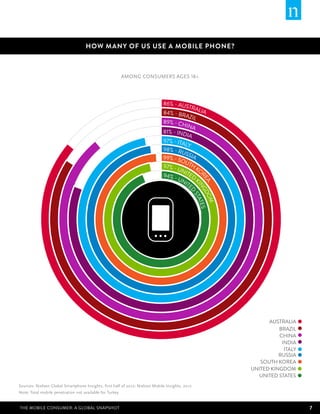
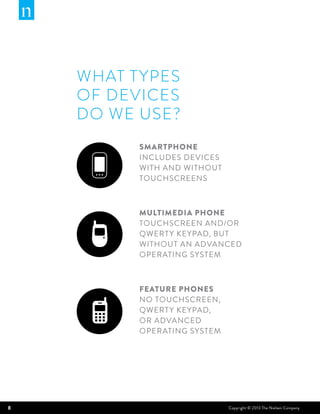
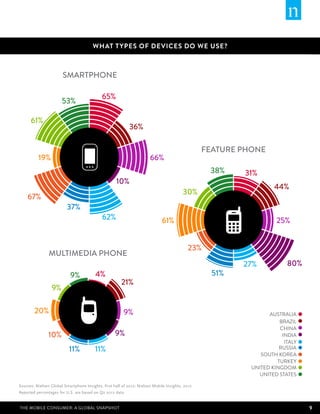
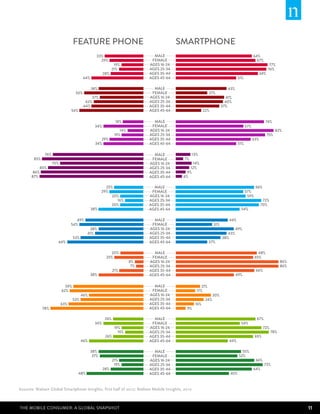


The document provides a global snapshot of mobile consumer trends based on surveys conducted in 10 countries in 2012. It finds that: 1) Smartphone ownership has reached a majority in countries like the US and UK, but feature phones remain most common in India, Brazil, and Russia where infrastructure is still developing. 2) Younger consumers are more likely to adopt smartphones globally, and their interest is expected to drive further adoption. 3) Smartphone habits vary by country, with games and social media being most popular apps worldwide, though mobile shopping is still nascent in many markets.


