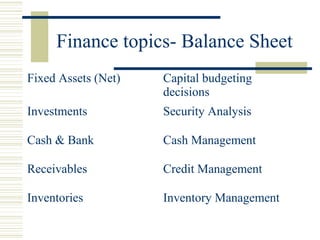
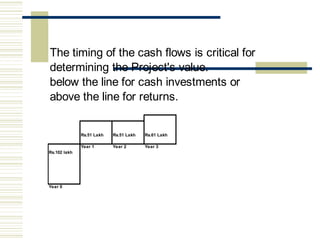
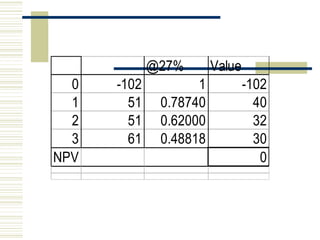
7. Phases of capital budgeting
īˇPlanning
īˇAnalysis
īˇSelection
īˇImplementation
īˇReview
8. SELECTION
Criterion Accept when
Pay back period (PBP) PBP < target period
Accounting rate of
return(ARR)
ARR > target rate
Net present value (NPV) NPV > 0
Internal Rate of
Return(IRR)
IRR > cost of capital
Benefit cost ratio
(BCR) /Profitability
Index
BCR > 1
10. Sources of finance
Permanent sources
īˇ Share capital
īˇ Retained profits
Long term sources
īˇ Redeemable preference shares
īˇ Debentures
īˇ Long term loans
īˇ Seed capital / venture capital
11. Sources of finance
Medium term sources
īˇ Medium term loans
īˇ Deferred credit
īˇ Public deposits
īˇ Working capital term loans
12. Sources of finance
Short term sources
īˇ Cash credit
īˇ Overdraft
īˇ Bills discounting
īˇ Commercial paper
īˇ Trade credit
13. Study of financial Statements:
īˇFinancial Statements means
Balance Sheet, P & L A/c and
sources and uses of funds statement
15. Finance topics- Balance Sheet
Share capital
Equity/preference
Reserves & Surplus
Secured Loans
Debentures
Capital Structure
Cost of capital
Loans & Advances
Unsecured loans
Current Lia/provisions
Trade creditors
Provisions
Working capital financial
policy
17. Basics of Financial Statement analysis
īˇ Horizontal analysis- analysis involves the
computation of amount changes and
percentage changes
īˇ Vertical Analysis- uses percentages to show
the relationship of the different items to the
total in a single statement. Sets a total figure
equal to 100 % and compute the percentage
of each component of that figure
18. Basics of Financial Statement analysis
īˇTrend Analysis :Percentage changes are
calculated for several successive years
instead of between two years.
īˇRatio Analysis: Represent meaningful
relationship between two numbers
19. Common size statements
īˇ The numbers are brought to common base
i.e. per cent.
īˇ Make comparisons of business enterprises of
different sizes more meaningful
īˇ It can be prepared in vertical analysis format
or horizontal analysis format
23. The sources and uses of
funds statement, on
working capital basis,
present I). Sources of
working capital ii). Uses of
working capital and iii) net
changes in working
capital.
24. Here working capital is
defined as the net working
capital which is simply the
difference between the
current assets and current
liabilities.
25. The sources of working
capital and uses of
working capital are as
under:
26. SOURCES USES
Operations(
net profit +
Depreciation)
Dividend
payment
Issue of
share capital
Working
capital Pool
Repayment
of long term
borrowings
Long term
borrowing
Purchase of
non current
assets
Sale of non
current
assets
27. The sources and uses of funds
statement: cash basis
The sources and uses of fund
statement, on cash basis shows, I
) the sources of cash ii) the uses
of cash and iii) the net change in
cash.
29. SOURCES
Operations( net
profit +
Depreciation)
Issue of share
capital
Long term
borrowing
Sale of non current
assets
Increase in current
liabilities
Decrease in current
assets other than
cash
USES
Dividend payment
Repayment of long
term borrowings
Purchase of non
current assets
Decrease in current
liabilities
Increase in current
assets other than
cash
30. RATIO ANALYSIS:
A Ratio is an arithmetical relationship
between two figures. Financial ratios
have been classified into five
categories as follows:
32. LEVERAGE RATIO
DER = Debt /Equity
Int.coverage.ratio =
PBIT+Depreciation / Int. on debt.
DSCR = PAT+Dep+Int. on debt /Int.
on debt + installment of debt
33. TURNOVER RATIO
Inventory turnover ratio = cost
of goods sold / Av. Inventory
Fixed assets turnover ratio =
Net sales /Av. Net fixed
assets.
Total asset turnover ratio =
Net sales / Av. Total assets
34. PROFITABILITY RATIO
GP margin = Gross profit / Net
sales
Net profit margin = Net profit / sales
Return on total assets = PAT / Av.
Total assets
35. VALUATION RATIO
EPS = Equity earnings / Number of
shares
Price Earning Ratio = Market price
per share/ EPS
Yield = Dividend + price change
/Initial price.
37. The timing of the cash flows is critical for
determining the Project's value.
below the line for cash investments or
above the line for returns.
Rs.51 Lakh Rs.51 Lakh Rs.61 Lakh
Year 1 Year 2 Year 3
Rs.102 lakh
Year 0
38. Net Present Value
Year Cash Flow Dis. Factor Present
@10% Value
0 -102 1 -102
1 51 0.90909 46.36359
2 51 0.82645 42.14895
3 61 0.75131 45.82991
NPV 32.34245
39. The evaluation of any project
depends on the magnitude of the
cash flows, the timing and the
discount rate.
The discount rate is highly
subjective. The higher the rate , the
less a rupee in the future would be
worth today.
The risk of the project should
determine the discount rate.
40. Internal Rate of Return
(IRR)
IRR is the rate at which
the discounted cash flows
in the future equal the
value of the investment
today. To find the IRR one
must try different rates
until the NPV equals zero.