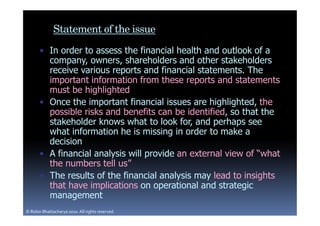
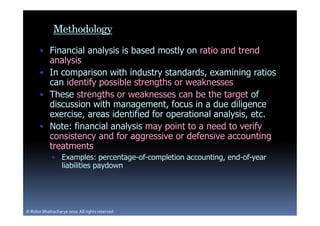
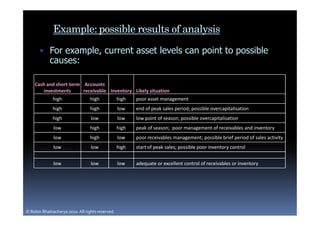
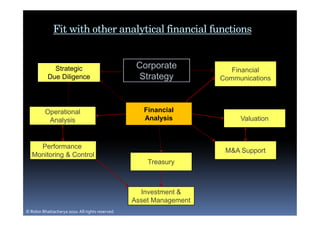
Financial Analysis Series:


FINANCIAL ANALYSIS
Statement of the issue
       • In order to assess the financial health and outlook of a
         company, owners, shareholders and other stakeholders
         receive various reports and financial statements. The
         important information from these reports and statements
         must be highlighted
       • Once the important financial issues are highlighted, the
         possible risks and benefits can be identified, so that the
         stakeholder knows what to look for, and perhaps see
         what information he is missing in order to make a
         decision
       • A financial analysis will provide an external view of “what
         the numbers tell us”
       • The results of the financial analysis may lead to insights
         that have implications on operational and strategic
         management
© Robin Bhattacharya 2010. All rights reserved.
Methodology
       • Financial analysis is based mostly on ratio and trend
         analysis
       • In comparison with industry standards, examining ratios
         can identify possible strengths or weaknesses
       • These strengths or weaknesses can be the target of
         discussion with management, focus in a due diligence
         exercise, areas identified for operational analysis, etc.
       • Note: financial analysis may point to a need to verify
         consistency and for aggressive or defensive accounting
         treatments
             • Examples: percentage-of-completion accounting, end-of-year
               liabilities paydown


© Robin Bhattacharya 2010. All rights reserved.
Example: possible results of analysis
       • For example, current asset levels can point to possible
         causes:

    Cash and short-term Accounts
       investments      receivable Inventory Likely situation
              high                high            high   poor asset management
              high                high            low    end of peak sales period; possible overcapitalisation
              high                low             low    low point of season; possible overcapitalisation
              low                 high            high   peak of season; poor management of receivables and inventory
              low                 high            low    poor receivables management; possible brief period of sales activity
              low                 low             high   start of peak sales; possible poor inventory control


              low                 low             low    adequate or excellent control of receivables or inventory


© Robin Bhattacharya 2010. All rights reserved.
Your benefit as a manger/owner
       • You receive an analysis that points out where possible
         sources of problems are that may place the
         profitability/cash flow at risk
       • The analysis can show where external stakeholders may
         have questions that need management attention and
         preparation
             • For example, a bank may be concerned about the causes of
               relatively high financial leverage. It may be due to low equity (as
               measured by sales to equity or ROE), low asset utilisation, weak
               working capital balance, or a low quick ratio
       • The analysis indicates possible focus for increasing the
         financial efficiency of a company


       • For more information, please contact
         RobinBhattacharya@yahoo.com
© Robin Bhattacharya 2010. All rights reserved.
APPENDICES
Fit with other analytical financial functions
Ratio analysis (common ratios used)
Red flags on financial accounts
Financial shenanigans
Fit with other analytical financial functions


             Strategic                             Corporate            Financial
           Due Diligence                            Strategy         Communications


          Operational                                Financial
           Analysis                                  Analysis             Valuation


     Performance
                                                                      M&A Support
   Monitoring & Control
                                                      Treasury


                                                    Investment &
                                                  Asset Management
© Robin Bhattacharya 2010. All rights reserved.
Ratio Analysis: Activity Analysis

                     Inventory Turnover
                     Average No. Days Inventory in Stock
                     Receivables Turnover
                     Average No. Days Receivables Outstanding
                     Payables Turnover
                     Average No. Days Payables Outstanding
                     Working Capital Turnover
                     Fixed Assets Turnover
                     Total Assets Turnover

© Robin Bhattacharya 2010. All rights reserved.
Ratio Analysis: Liquidity Analysis

                     Current Ratio
                     Quick Ratio
                     Cash Ratio
                     Cash Flow from Operations Ratio
                     Length of Cash Cycle
                          (Raw Material + Work-in-Progress + Inventory) Days +
                          Receivables Days – Payables Days


© Robin Bhattacharya 2010. All rights reserved.
Ratio Analysis: Long-term Debt and Solvency
              Analysis

                     Debt to Total Capital
                     Debt to Equity
                     Times Interest Earned
                     Fixed Charge Coverage
                     Capital Expenditure Ratio (CFO/Capex)
                     CFO to Debt
                     Debt Service Coverage Ratios (varying bases,
                     e.g., FCF/DSC)


© Robin Bhattacharya 2010. All rights reserved.
Ratio Analysis: Profitability Analysis

                     Return on Sales
                          Gross Margin
                          Contribution Margin
                          Operating Margin
                          EBIT/Sales
                     Return on Investment
                          Return on Assets
                          Return on Total Capital
                          Return on Equity


© Robin Bhattacharya 2010. All rights reserved.
Ratio Analysis: Operating and Financial
              Leverage

                     Contribution Margin Ratio

                     Operating Leverage (CM/Operating Income)

                     Financial Leverage (OI/NI)

                     Total Leverage (OL x FL)


© Robin Bhattacharya 2010. All rights reserved.
Ratio Analysis: Other


                     Fixed Assets Growth Rate (Net
                     Investment/Dep – 1)
                     Internal Growth Rate w Debt (Retained
                     Earnings/Equity)
                     Internal Growth Rate w/o Debt (Retained
                     Earnings/Total Capital)


© Robin Bhattacharya 2010. All rights reserved.
Some Red Flags on financial accounts*

              Divergences between net income and operating
              cash flow
              Increasing day sales outstanding (DSO)
              Increasing day sales inventory (DSI)
              Increasing other current assets to revenues
              Declines on depreciation relative to gross
              property plant and equipment
              Increasing total asset growth

         *James Montier, Societe General, 2008

© Robin Bhattacharya 2010. All rights reserved.
Value shares check*

       1. Net Income
                    Score 1 if the bottom line net income is a positive figure
       2. Operating Cash Flow
                    Score 1 if the figure is positive
       3. Return on Assets (Net Income / Total Assets)
                    Score 1 if the current year ROA exceeds the prior year ROA
       4. Quality of Earnings
                    One point if the OCF exceeds the Net Income.
       5. Long-Term Debt to Assets
                    Score 1 if the ratio of long-term debt to assets is below the
                    prior year value (If long-term debt is zero but assets are
                    increasing, score 1 anyway).
         *Elements of the Piotroski F score

© Robin Bhattacharya 2010. All rights reserved.
Value shares check (cont)

       6. Current Ratio (Current Assets / Current Liabilities)
                    One point if the ratio has increased over the prior year
       7. Issued Share Capital (No. of shares)
                    Score 1 if the number of shares in issue is no greater than the
                    prior year figure. (This is a measure of possible dilution).
       8. Gross Margin
                    Score a point if the current year GM is higher than the prior
                    year figure.
       9. Asset Turnover (Total Sales / Total Assets)
                    Score 1 if the ratio has increased over the prior year figure.

             The higher the score, the better the shares tend to perform. Historically, shares
             with 2 or fewer points were 5 times more likely to go bankrupt or delist due to
             financial problems.

© Robin Bhattacharya 2010. All rights reserved.
Financial Shenanigans*

       Howard Schilit’s book looks into seven areas of
       ‘earnings management with dubious intentions’:
       1.     Recording revenue too soon or of questionable quality
       2.     Recording bogus revenue
       3.     Boosting income with one-time gains
       4.     Shifting expenses to a later or earlier period
       5.     Failing to record or improperly reducing liabilities
       6.     Shifting current revenue to a later period
       7.     Shifting future expenses to the current period as a special charge


         *Source: Howard Schilit, Financial Shenanigans

© Robin Bhattacharya 2010. All rights reserved.

Financial Analysis Series: Financial Analysis

  • 1.
  • 2.
    Statement of theissue • In order to assess the financial health and outlook of a company, owners, shareholders and other stakeholders receive various reports and financial statements. The important information from these reports and statements must be highlighted • Once the important financial issues are highlighted, the possible risks and benefits can be identified, so that the stakeholder knows what to look for, and perhaps see what information he is missing in order to make a decision • A financial analysis will provide an external view of “what the numbers tell us” • The results of the financial analysis may lead to insights that have implications on operational and strategic management © Robin Bhattacharya 2010. All rights reserved.
  • 3.
    Methodology • Financial analysis is based mostly on ratio and trend analysis • In comparison with industry standards, examining ratios can identify possible strengths or weaknesses • These strengths or weaknesses can be the target of discussion with management, focus in a due diligence exercise, areas identified for operational analysis, etc. • Note: financial analysis may point to a need to verify consistency and for aggressive or defensive accounting treatments • Examples: percentage-of-completion accounting, end-of-year liabilities paydown © Robin Bhattacharya 2010. All rights reserved.
  • 4.
    Example: possible resultsof analysis • For example, current asset levels can point to possible causes: Cash and short-term Accounts investments receivable Inventory Likely situation high high high poor asset management high high low end of peak sales period; possible overcapitalisation high low low low point of season; possible overcapitalisation low high high peak of season; poor management of receivables and inventory low high low poor receivables management; possible brief period of sales activity low low high start of peak sales; possible poor inventory control low low low adequate or excellent control of receivables or inventory © Robin Bhattacharya 2010. All rights reserved.
  • 5.
    Your benefit asa manger/owner • You receive an analysis that points out where possible sources of problems are that may place the profitability/cash flow at risk • The analysis can show where external stakeholders may have questions that need management attention and preparation • For example, a bank may be concerned about the causes of relatively high financial leverage. It may be due to low equity (as measured by sales to equity or ROE), low asset utilisation, weak working capital balance, or a low quick ratio • The analysis indicates possible focus for increasing the financial efficiency of a company • For more information, please contact RobinBhattacharya@yahoo.com © Robin Bhattacharya 2010. All rights reserved.
  • 6.
    APPENDICES Fit with otheranalytical financial functions Ratio analysis (common ratios used) Red flags on financial accounts Financial shenanigans
  • 7.
    Fit with otheranalytical financial functions Strategic Corporate Financial Due Diligence Strategy Communications Operational Financial Analysis Analysis Valuation Performance M&A Support Monitoring & Control Treasury Investment & Asset Management © Robin Bhattacharya 2010. All rights reserved.
  • 8.
    Ratio Analysis: ActivityAnalysis Inventory Turnover Average No. Days Inventory in Stock Receivables Turnover Average No. Days Receivables Outstanding Payables Turnover Average No. Days Payables Outstanding Working Capital Turnover Fixed Assets Turnover Total Assets Turnover © Robin Bhattacharya 2010. All rights reserved.
  • 9.
    Ratio Analysis: LiquidityAnalysis Current Ratio Quick Ratio Cash Ratio Cash Flow from Operations Ratio Length of Cash Cycle (Raw Material + Work-in-Progress + Inventory) Days + Receivables Days – Payables Days © Robin Bhattacharya 2010. All rights reserved.
  • 10.
    Ratio Analysis: Long-termDebt and Solvency Analysis Debt to Total Capital Debt to Equity Times Interest Earned Fixed Charge Coverage Capital Expenditure Ratio (CFO/Capex) CFO to Debt Debt Service Coverage Ratios (varying bases, e.g., FCF/DSC) © Robin Bhattacharya 2010. All rights reserved.
  • 11.
    Ratio Analysis: ProfitabilityAnalysis Return on Sales Gross Margin Contribution Margin Operating Margin EBIT/Sales Return on Investment Return on Assets Return on Total Capital Return on Equity © Robin Bhattacharya 2010. All rights reserved.
  • 12.
    Ratio Analysis: Operatingand Financial Leverage Contribution Margin Ratio Operating Leverage (CM/Operating Income) Financial Leverage (OI/NI) Total Leverage (OL x FL) © Robin Bhattacharya 2010. All rights reserved.
  • 13.
    Ratio Analysis: Other Fixed Assets Growth Rate (Net Investment/Dep – 1) Internal Growth Rate w Debt (Retained Earnings/Equity) Internal Growth Rate w/o Debt (Retained Earnings/Total Capital) © Robin Bhattacharya 2010. All rights reserved.
  • 14.
    Some Red Flagson financial accounts* Divergences between net income and operating cash flow Increasing day sales outstanding (DSO) Increasing day sales inventory (DSI) Increasing other current assets to revenues Declines on depreciation relative to gross property plant and equipment Increasing total asset growth *James Montier, Societe General, 2008 © Robin Bhattacharya 2010. All rights reserved.
  • 15.
    Value shares check* 1. Net Income Score 1 if the bottom line net income is a positive figure 2. Operating Cash Flow Score 1 if the figure is positive 3. Return on Assets (Net Income / Total Assets) Score 1 if the current year ROA exceeds the prior year ROA 4. Quality of Earnings One point if the OCF exceeds the Net Income. 5. Long-Term Debt to Assets Score 1 if the ratio of long-term debt to assets is below the prior year value (If long-term debt is zero but assets are increasing, score 1 anyway). *Elements of the Piotroski F score © Robin Bhattacharya 2010. All rights reserved.
  • 16.
    Value shares check(cont) 6. Current Ratio (Current Assets / Current Liabilities) One point if the ratio has increased over the prior year 7. Issued Share Capital (No. of shares) Score 1 if the number of shares in issue is no greater than the prior year figure. (This is a measure of possible dilution). 8. Gross Margin Score a point if the current year GM is higher than the prior year figure. 9. Asset Turnover (Total Sales / Total Assets) Score 1 if the ratio has increased over the prior year figure. The higher the score, the better the shares tend to perform. Historically, shares with 2 or fewer points were 5 times more likely to go bankrupt or delist due to financial problems. © Robin Bhattacharya 2010. All rights reserved.
  • 17.
    Financial Shenanigans* Howard Schilit’s book looks into seven areas of ‘earnings management with dubious intentions’: 1. Recording revenue too soon or of questionable quality 2. Recording bogus revenue 3. Boosting income with one-time gains 4. Shifting expenses to a later or earlier period 5. Failing to record or improperly reducing liabilities 6. Shifting current revenue to a later period 7. Shifting future expenses to the current period as a special charge *Source: Howard Schilit, Financial Shenanigans © Robin Bhattacharya 2010. All rights reserved.