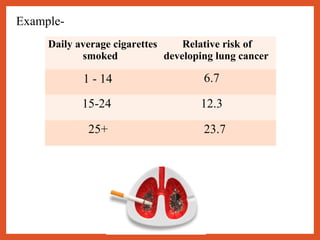
Criteria for Causal Association
•Name: Kaushik.P
•Roll Number: 4050
•Guide: Dr.Akila.G.V
Contents
•Introduction
•Types of causal association
•Criteria for causal association
•Summary
•References
Introduction
Association may be defined as the concurrence
of two variables more often than would be
expected by chance.
Epidemiological studies determine various
associations between an exposure and a disease.
Further, its important to find out whether the
exposure is causal for the disease or not.
Types of association
•Spurious association
•Indirect association
•Direct (causal) association
a) One-to-one causal association
b) Multifactorial association
Spurious association
Association between a disease and suspected
factor may not be real.
Indirect association
Associations which at first appeared to be
causal have been found on further study to be due
to indirect association. This is due to a
confounding variable.
Example for Spurious association:
PMR of 5.4 PMR of 27.8
Example for Indirect association:
High altitude Goiter
Direct (Causal) association
a)One-to-One causal association
Two variables(AB) are stated to be
causally related if a change in A is
followed by a change in B.
b)Multifactorial association
Considered when the etiology is
multifactorial.
All the causal factors can act
individually or cumulatively to produce
the outcome.
One to one causal association-
Measles virus Measles
Multifactorial association-
CHD
Criteria for Causal Association
Bradford Hill’s criteria for making causal inferences-
1.Strength of association
2.Dose-Response relationship
3.Lack of temporal ambiguity
4.Consistency of findings
5.Biologic plausibility
6.Coherence of evidence
7.Specificity of association
1.Strength of association
• Measured by the relative risk (or odds
ratio).
• The stronger the association, the more
likely it is that the relation is causal.
• Relative risk is the ratio of the incidence
of the disease among exposed and the
incidence among non-exposed.
Example-
Risk for development
lung cancer
8.6 times higher in smokers than in non-smokers.
2.Dose-Response relationship
• As the dose of exposure increases, the risk
of disease also increases
• If present, it is strong evidence for a causal
relationship.
• Absence of a dose-response relationship
does not necessarily rule out a causal
relationship.
• In some cases in which a threshold may
exist, no disease may develop up to a
certain level.
Daily average cigarettes
smoked
Relative risk of
developing lung cancer
1 - 14 6.7
15-24 12.3
25+ 23.7
Example-
3.Lack of temporal ambiguity
• Exposure to the factor must have occurred
before the disease developed
• The temporal relationship is important in
regard to the length of the interval
between exposure and disease
• It’s easier to establish a temporal
relationship in a prospective cohort study
than in a case-control study or a
retrospective cohort study.
Example-
Consumption of contaminated food should
precede the symptoms of food poisoning.
4.Consistency of findings
• The relationship should
be found consistently in
different studies and in
different populations.
• Unless there is a clear
reason to expect different
results, replication of the
findings should be there.
5.Biologic plausibility
• Biologic plausibility refers to coherence with
the current body of biologic knowledge
• Epidemiologic findings should be consistent
with existing biologic knowledge.
• Example- Carcinogens from
cigarette smoke deposits in the
lung over a period of time
leading to lung cancer.
6.Coherence of evidence
• If a relationship is causal, we would
expect the findings to be consistent with
other data.
• For the appraisal of causal significance of
an association it should be coherent with
known facts that are thought to be
relevant.
Example- Peptic ulcer disease
• Prevalence of H.pylori is same
in men as in women. Incidence of
duodenal ulcer in both have been
proved to be equal in recent
years.
• Prevalence of peptic ulcer
disease is believed to have
peaked in the latter part of 19th
century cause of poor living
standards.
7.Specificity of association
• Association is specific when a certain
exposure is associated with only one disease
• When specificity of an association is found,
it provides additional support for a causal
inference
• Absence of specificity in no way negates a
causal relationship.
Example-
Prevalence of H.pylori in
patients with duodenal ulcer
is 90% to 100%.
However, it is found even in
some patients of gastric
ulcer and even in
asymptomatic individuals.
Few other criteria which might be
useful are:
• Cessation of exposure-   Risk of the
disease declines when exposure to the
factor is reduced or eliminated.
• Consideration of alternate explanations-
Extent to which the investigators have
taken other possible explanations into
account and the extent to which they have
ruled out such explanations are important
considerations.
Summary:
• Association in
epidemiological studies
and its types
• Causal association
• Bradford Hill’s criteria for
causal association
References:
• Gordis L. Epidemiology. 4th
ed.
Saunders Elsevier : Philadelphia ;
2009. Pg 227 to 246.
• Park K.Textbook of Preventive and
Social Medicine. 21th
ed.
Bhanarasidas Bhanot : Jabalpur
(India); 2011. Pg 84 to 87.
Criteria for causal association

Criteria for causal association

  • 1.
    Criteria for CausalAssociation •Name: Kaushik.P •Roll Number: 4050 •Guide: Dr.Akila.G.V
  • 2.
    Contents •Introduction •Types of causalassociation •Criteria for causal association •Summary •References
  • 3.
    Introduction Association may bedefined as the concurrence of two variables more often than would be expected by chance. Epidemiological studies determine various associations between an exposure and a disease. Further, its important to find out whether the exposure is causal for the disease or not.
  • 4.
    Types of association •Spuriousassociation •Indirect association •Direct (causal) association a) One-to-one causal association b) Multifactorial association
  • 5.
    Spurious association Association betweena disease and suspected factor may not be real. Indirect association Associations which at first appeared to be causal have been found on further study to be due to indirect association. This is due to a confounding variable.
  • 6.
    Example for Spuriousassociation: PMR of 5.4 PMR of 27.8 Example for Indirect association: High altitude Goiter
  • 7.
    Direct (Causal) association a)One-to-Onecausal association Two variables(AB) are stated to be causally related if a change in A is followed by a change in B. b)Multifactorial association Considered when the etiology is multifactorial. All the causal factors can act individually or cumulatively to produce the outcome.
  • 8.
    One to onecausal association- Measles virus Measles Multifactorial association- CHD
  • 9.
    Criteria for CausalAssociation Bradford Hill’s criteria for making causal inferences- 1.Strength of association 2.Dose-Response relationship 3.Lack of temporal ambiguity 4.Consistency of findings 5.Biologic plausibility 6.Coherence of evidence 7.Specificity of association
  • 10.
    1.Strength of association •Measured by the relative risk (or odds ratio). • The stronger the association, the more likely it is that the relation is causal. • Relative risk is the ratio of the incidence of the disease among exposed and the incidence among non-exposed.
  • 11.
    Example- Risk for development lungcancer 8.6 times higher in smokers than in non-smokers.
  • 12.
    2.Dose-Response relationship • Asthe dose of exposure increases, the risk of disease also increases • If present, it is strong evidence for a causal relationship. • Absence of a dose-response relationship does not necessarily rule out a causal relationship. • In some cases in which a threshold may exist, no disease may develop up to a certain level.
  • 13.
    Daily average cigarettes smoked Relativerisk of developing lung cancer 1 - 14 6.7 15-24 12.3 25+ 23.7 Example-
  • 14.
    3.Lack of temporalambiguity • Exposure to the factor must have occurred before the disease developed • The temporal relationship is important in regard to the length of the interval between exposure and disease • It’s easier to establish a temporal relationship in a prospective cohort study than in a case-control study or a retrospective cohort study.
  • 15.
    Example- Consumption of contaminatedfood should precede the symptoms of food poisoning.
  • 16.
    4.Consistency of findings •The relationship should be found consistently in different studies and in different populations. • Unless there is a clear reason to expect different results, replication of the findings should be there.
  • 17.
    5.Biologic plausibility • Biologicplausibility refers to coherence with the current body of biologic knowledge • Epidemiologic findings should be consistent with existing biologic knowledge. • Example- Carcinogens from cigarette smoke deposits in the lung over a period of time leading to lung cancer.
  • 18.
    6.Coherence of evidence •If a relationship is causal, we would expect the findings to be consistent with other data. • For the appraisal of causal significance of an association it should be coherent with known facts that are thought to be relevant.
  • 19.
    Example- Peptic ulcerdisease • Prevalence of H.pylori is same in men as in women. Incidence of duodenal ulcer in both have been proved to be equal in recent years. • Prevalence of peptic ulcer disease is believed to have peaked in the latter part of 19th century cause of poor living standards.
  • 20.
    7.Specificity of association •Association is specific when a certain exposure is associated with only one disease • When specificity of an association is found, it provides additional support for a causal inference • Absence of specificity in no way negates a causal relationship.
  • 21.
    Example- Prevalence of H.pyloriin patients with duodenal ulcer is 90% to 100%. However, it is found even in some patients of gastric ulcer and even in asymptomatic individuals.
  • 22.
    Few other criteriawhich might be useful are: • Cessation of exposure-   Risk of the disease declines when exposure to the factor is reduced or eliminated. • Consideration of alternate explanations- Extent to which the investigators have taken other possible explanations into account and the extent to which they have ruled out such explanations are important considerations.
  • 23.
    Summary: • Association in epidemiologicalstudies and its types • Causal association • Bradford Hill’s criteria for causal association
  • 24.
    References: • Gordis L.Epidemiology. 4th ed. Saunders Elsevier : Philadelphia ; 2009. Pg 227 to 246. • Park K.Textbook of Preventive and Social Medicine. 21th ed. Bhanarasidas Bhanot : Jabalpur (India); 2011. Pg 84 to 87.