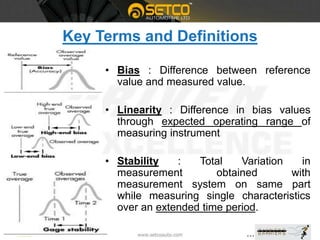
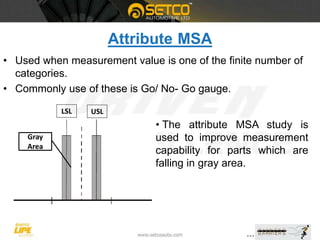
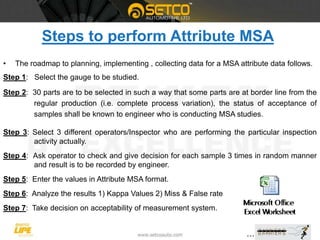
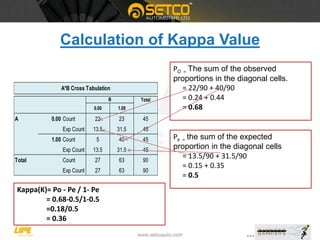
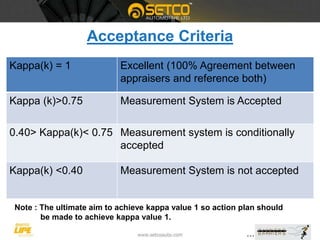
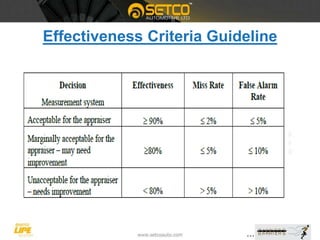
Measurement System Analysis
Date : 12/9/2018
Prepared By: Disha Jain
Index
 What is MSA?
 Type of MSA
 Key terms and definition
 Attribute MSA and its Importance
 Steps to perform Attribute MSA
 Calculation of Kappa Value
 Calculation of Miss Rate and False Rate
IATF 16949 Requirement
What is MSA?
• An experimental and mathematical method
of determining the amount of variation that
exists within a measurement process
• The purpose of MSA is to analyze and
establish correct measurement system
to evaluate process capability.
• The sources of variation in a measurement
process can include the following:
Typical Reasons for an MSA Study
• There is a new
manufacturing process.
• There is a new product to
manufacture.
• There is new equipment.
• There are customer
concerns.
• There are internal quality
issues
Major Source of Variation
Error Present into Measurement System
1) Location Error : Assessed using bias, linearity, stability
studies.
2) Width (Spread) Error : Assessed using repeatability and
reproducibility studies.
Observed Variation
due to measurement
system error
Observed Variation
due to measurement
system error
Actual Variation
MSA
Variable
Bias
Linearity
Stability
G R&R
Attribute
Type of MSA
LocationError
Width
Error
• Attribute Data : Data that can be counted for recording
and analysis (sometimes referred to as go/ no go data)
• Variable Data : Continuous variable data can have an
infinite number of values.
• Accuracy : The closeness of the data to the reference
value.
• Precision : Closeness of repeated readings to each
other.
Key Terms and Definitions
• Bias : Difference between reference
value and measured value.
• Linearity : Difference in bias values
through expected operating range of
measuring instrument
• Stability : Total Variation in
measurement obtained with
measurement system on same part
while measuring single characteristics
over an extended time period.
Key Terms and Definitions
• Repeatability : Variation in measurements obtained with one
measurement instrument when used several times by one
assessor while measuring identical characteristics on the
same part . (Instrument Variation)
• Reproducibility : Variation in average of measurements
made by different assessor using same measuring instrument
when measuring identical characteristic on same part.
(Appraiser Variation)
Attribute MSA
• Used when measurement value is one of the finite number of
categories.
• Commonly use of these is Go/ No- Go gauge.
USLLSL
Gray
Area
• The attribute MSA study is
used to improve measurement
capability for parts which are
falling in gray area.
Steps to perform Attribute MSA
• The roadmap to planning, implementing , collecting data for a MSA attribute data follows.
Step 1: Select the gauge to be studied.
Step 2: 30 parts are to be selected in such a way that some parts are at border line from the
regular production (i.e. complete process variation), the status of acceptance of
samples shall be known to engineer who is conducting MSA studies.
Step 3: Select 3 different operators/Inspector who are performing the particular inspection
activity actually.
Step 4: Ask operator to check and give decision for each sample 3 times in random manner
and result is to be recorded by engineer.
Step 5: Enter the values in Attribute MSA format.
Step 6: Analyze the results 1) Kappa Values 2) Miss & False rate
Step 7: Take decision on acceptability of measurement system.
Calculation of Expected Count
Total
0.00 1.00
A 0.00 Count 22 23 45
Exp Count 13.5 31.5 45
1.00 Count 5 40 45
Exp Count 13.5 31.5 45
Total Count 27 63 90
Exp Count 27 63 90
B
A*B Cross Tabulation
Pae= {(A+B)*(A+C)} / Total Count
= {(22+23)*(22+5)}/90
= 1215/90 = 13.5
Pbe= {(B+A)*(B+D)} / Total Count
= {(23+22)*(23+40)}/90
= 2835/90 = 31.5
Pce= {(C+D)*(C+A)} / Total Count
= {(5+40)*(5+22)}/90
= 1215/90 = 13.5
Pde= {(D+C)*(D+B)} / Total Count
= {(40+5)*(40+23)}/90
= 2835/90 = 31.5
Calculation of Kappa Value
• Kappa :Kappa is an inter- rater agreement i.e. the ratio
of the proportion of agreement divided by the maximum
number of times they could agree.
pe
pepo
Kappa
-
-
=
1
Po = the sum of the
observed proportions in
the diagonal cells
Pe = the sum of the
expected proportion in
the diagonal cells
Calculation of Kappa Value
Total
0.00 1.00
A 0.00 Count 22 23 45
Exp Count 13.5 31.5 45
1.00 Count 5 40 45
Exp Count 13.5 31.5 45
Total Count 27 63 90
Exp Count 27 63 90
B
A*B Cross Tabulation
PO = The sum of the observed
proportions in the diagonal cells.
= 22/90 + 40/90
= 0.24 + 0.44
= 0.68
Pe = the sum of the expected
proportion in the diagonal cells
= 13.5/90 + 31.5/90
= 0.15 + 0.35
= 0.5
Kappa(K)= Po - Pe / 1- Pe
= 0.68-0.5/1-0.5
=0.18/0.5
= 0.36
Acceptance Criteria
Kappa(k) = 1 Excellent (100% Agreement between
appraisers and reference both)
Kappa (k)>0.75 Measurement System is Accepted
0.40> Kappa(k)< 0.75 Measurement system is conditionally
accepted
Kappa(k) <0.40 Measurement System is not accepted
Note : The ultimate aim to achieve kappa value 1 so action plan should
be made to achieve kappa value 1.
Miss Rate & False Rate for Appraiser A
Total
0.00 1.00
A 0.00 Count 24 6 30
Exp Count 15.0 15.0 30
1.00 Count 21 39 60
Exp Count 30.0 30.0 60
Total Count 45 45 90
Exp Count 45 45 90
Reference
A*Reference Cross tabulation Miss Rate: Calling “ BAD” part
“GOOD”.
i.e. Customer Risk
=21/90 = 23.3%
False Rate: Calling a “ GOOD”
part “BAD”.
i.e. Manufacturer’s Risk
=6/90= 6.66%
Effectiveness = Number of correct Decisions = 63 = 70%
Total opportunities for a decision 90
Effectiveness Criteria Guideline
Why Attribute MSA Fails?
• Failure due to appraiser
- Improper clarification on reject/accept
- Eyesight of appraiser
• Failure due to inspection process
- Poor illumination of the work area.
- Poor objectivity and clarity of conformance standards and test
instructions.
- Not enough time allowed for inspection.
Attribute MSA

Attribute MSA

  • 1.
    Measurement System Analysis Date: 12/9/2018 Prepared By: Disha Jain
  • 2.
    Index  What isMSA?  Type of MSA  Key terms and definition  Attribute MSA and its Importance  Steps to perform Attribute MSA  Calculation of Kappa Value  Calculation of Miss Rate and False Rate
  • 3.
  • 4.
    What is MSA? •An experimental and mathematical method of determining the amount of variation that exists within a measurement process • The purpose of MSA is to analyze and establish correct measurement system to evaluate process capability. • The sources of variation in a measurement process can include the following:
  • 5.
    Typical Reasons foran MSA Study • There is a new manufacturing process. • There is a new product to manufacture. • There is new equipment. • There are customer concerns. • There are internal quality issues
  • 6.
    Major Source ofVariation
  • 7.
    Error Present intoMeasurement System 1) Location Error : Assessed using bias, linearity, stability studies. 2) Width (Spread) Error : Assessed using repeatability and reproducibility studies. Observed Variation due to measurement system error Observed Variation due to measurement system error Actual Variation
  • 8.
  • 9.
    • Attribute Data: Data that can be counted for recording and analysis (sometimes referred to as go/ no go data) • Variable Data : Continuous variable data can have an infinite number of values. • Accuracy : The closeness of the data to the reference value. • Precision : Closeness of repeated readings to each other. Key Terms and Definitions
  • 10.
    Key Terms andDefinitions • Bias : Difference between reference value and measured value. • Linearity : Difference in bias values through expected operating range of measuring instrument • Stability : Total Variation in measurement obtained with measurement system on same part while measuring single characteristics over an extended time period.
  • 11.
    Key Terms andDefinitions • Repeatability : Variation in measurements obtained with one measurement instrument when used several times by one assessor while measuring identical characteristics on the same part . (Instrument Variation) • Reproducibility : Variation in average of measurements made by different assessor using same measuring instrument when measuring identical characteristic on same part. (Appraiser Variation)
  • 12.
    Attribute MSA • Usedwhen measurement value is one of the finite number of categories. • Commonly use of these is Go/ No- Go gauge. USLLSL Gray Area • The attribute MSA study is used to improve measurement capability for parts which are falling in gray area.
  • 13.
    Steps to performAttribute MSA • The roadmap to planning, implementing , collecting data for a MSA attribute data follows. Step 1: Select the gauge to be studied. Step 2: 30 parts are to be selected in such a way that some parts are at border line from the regular production (i.e. complete process variation), the status of acceptance of samples shall be known to engineer who is conducting MSA studies. Step 3: Select 3 different operators/Inspector who are performing the particular inspection activity actually. Step 4: Ask operator to check and give decision for each sample 3 times in random manner and result is to be recorded by engineer. Step 5: Enter the values in Attribute MSA format. Step 6: Analyze the results 1) Kappa Values 2) Miss & False rate Step 7: Take decision on acceptability of measurement system.
  • 14.
    Calculation of ExpectedCount Total 0.00 1.00 A 0.00 Count 22 23 45 Exp Count 13.5 31.5 45 1.00 Count 5 40 45 Exp Count 13.5 31.5 45 Total Count 27 63 90 Exp Count 27 63 90 B A*B Cross Tabulation Pae= {(A+B)*(A+C)} / Total Count = {(22+23)*(22+5)}/90 = 1215/90 = 13.5 Pbe= {(B+A)*(B+D)} / Total Count = {(23+22)*(23+40)}/90 = 2835/90 = 31.5 Pce= {(C+D)*(C+A)} / Total Count = {(5+40)*(5+22)}/90 = 1215/90 = 13.5 Pde= {(D+C)*(D+B)} / Total Count = {(40+5)*(40+23)}/90 = 2835/90 = 31.5
  • 15.
    Calculation of KappaValue • Kappa :Kappa is an inter- rater agreement i.e. the ratio of the proportion of agreement divided by the maximum number of times they could agree. pe pepo Kappa - - = 1 Po = the sum of the observed proportions in the diagonal cells Pe = the sum of the expected proportion in the diagonal cells
  • 16.
    Calculation of KappaValue Total 0.00 1.00 A 0.00 Count 22 23 45 Exp Count 13.5 31.5 45 1.00 Count 5 40 45 Exp Count 13.5 31.5 45 Total Count 27 63 90 Exp Count 27 63 90 B A*B Cross Tabulation PO = The sum of the observed proportions in the diagonal cells. = 22/90 + 40/90 = 0.24 + 0.44 = 0.68 Pe = the sum of the expected proportion in the diagonal cells = 13.5/90 + 31.5/90 = 0.15 + 0.35 = 0.5 Kappa(K)= Po - Pe / 1- Pe = 0.68-0.5/1-0.5 =0.18/0.5 = 0.36
  • 17.
    Acceptance Criteria Kappa(k) =1 Excellent (100% Agreement between appraisers and reference both) Kappa (k)>0.75 Measurement System is Accepted 0.40> Kappa(k)< 0.75 Measurement system is conditionally accepted Kappa(k) <0.40 Measurement System is not accepted Note : The ultimate aim to achieve kappa value 1 so action plan should be made to achieve kappa value 1.
  • 18.
    Miss Rate &False Rate for Appraiser A Total 0.00 1.00 A 0.00 Count 24 6 30 Exp Count 15.0 15.0 30 1.00 Count 21 39 60 Exp Count 30.0 30.0 60 Total Count 45 45 90 Exp Count 45 45 90 Reference A*Reference Cross tabulation Miss Rate: Calling “ BAD” part “GOOD”. i.e. Customer Risk =21/90 = 23.3% False Rate: Calling a “ GOOD” part “BAD”. i.e. Manufacturer’s Risk =6/90= 6.66% Effectiveness = Number of correct Decisions = 63 = 70% Total opportunities for a decision 90
  • 19.
  • 20.
    Why Attribute MSAFails? • Failure due to appraiser - Improper clarification on reject/accept - Eyesight of appraiser • Failure due to inspection process - Poor illumination of the work area. - Poor objectivity and clarity of conformance standards and test instructions. - Not enough time allowed for inspection.