1. Q4 2011 | INDUSTRIAL MARKET
HOUSTON INDUSTRIAL MARKET
RESEARCH & FORECAST REPORT
2.9M SF in Houston’s Industrial Construction Pipeline -
1.8M SF is Spec Development
Houston’s industrial market fundamentals continue to strengthen with over 1.5M
CITYWIDE MARKET INDICATORS SF of positive net absorption in the fourth quarter, pushing year-end absorption to
4.4M SF. Houston’s industrial vacancy continues to decrease, averaging 5.2% in
4Q-10 4Q-11 the fourth quarter, 40 basis points (bps) less than the previous quarter, and 100
bps below the 6.2% recorded in the same quarter last year. Houston’s overall
QUARTERLY NET ABSORPTION
average quoted industrial rental rate increased from $5.41 to $5.45 per SF NNN
354,079 SF 1,541,538 SF between quarters increasing by 2.3% on a year-over-year basis from $5.33 per SF
YEAR-END NET ABSORPTION
NNN. 2011 leasing activity reached 13.1M SF with the help of large lease
transactions, many of which are listed on the following page.
4,760,762 SF 4,379,039 SF
QUOTED RENTAL RATE NNN
For several years, developers have shown restraint due to the economic
downturn; however, construction activity increased in 2011. Houston’s industrial
$5.33/SF $5.45/SF market currently has 2.9M SF in the construction pipeline and delivered 1.7M SF
in 2011. Much of the increased activity in the first half of the year was driven by
INDUSTRIAL VACANCY
build-to-suit projects for companies expanding in and relocating to the Houston
6.2% 5.2% market, however, the fourth quarter saw a significant increase in spec
development representing 1.8M SF of the 2.9M under construction. As Houston’s
QUARTERLY DELIVERIES
available industrial inventory shrinks, we believe the demand for new projects will
204,793 176,950 continue to increase, both build-to-suit and spec development.
YEAR-END DELIVERIES
With solid expansion in the energy sector and a strong housing market (up 4.1%
2,239,377 SF 1,670,619 SF year-to-date through November), Houston’s economy is expected to continue
UNDER CONSTRUCTION
outperforming the national economy over the next twelve to eighteen months.
206,671 SF 2,942,666 SF
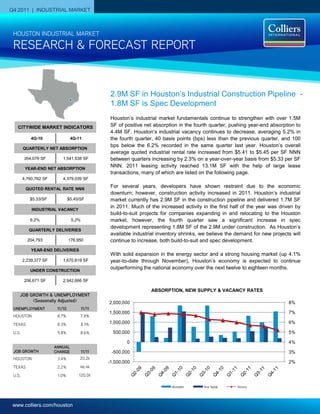
ABSORPTION, NEW SUPPLY & VACANCY RATES
JOB GROWTH & UNEMPLOYMENT
(Seasonally Adjusted) 2,000,000 8%
UNEMPLOYMENT 11/10 11/11
1,500,000 7%
HOUSTON 8.7% 7.8%
TEXAS 8.3% 8.1% 1,000,000 6%
U.S. 9.8% 8.6% 500,000 5%
0 4%
ANNUAL
JOB GROWTH CHANGE 11/11 -500,000 3%
HOUSTON 3.4% 20.2k
-1,000,000 2%
TEXAS 2.2% 46.4k
U.S. 1.0% 120.0k
Absorption New Supply Vacancy
www.colliers.com/houston
2. RESEARCH & FORECAST REPORT | Q4 2011 | HOUSTON INDUSTRIAL MARKET
Vacancy & Availability $4.19 per SF for bulk warehouse space; 2011 TOP INDUSTRIAL LEASES
$6.36 per SF for Flex/Service space;
Houston’s industrial vacancy continues Forum Energy
with Tech/R&D space averaging $7.13 Guhn Road Distribution Center
to shrink averaging 5.2% in the fourth
per SF. Aug-11 253,838 SF
quarter. Over the past three years,
Houston’s industrial vacancy has Ferguson Enterprises, Inc.*
decreased each quarter, outperforming
Absorption & Demand Port Crossing Commerce Center
Sep-11 206,296 SF
all other commercial real estate Houston’s industrial market posted
property sectors citywide. 1.5M SF of positive net absorption in Exel Inc.
8705 Citypark Loop
the fourth quarter, bringing the year-to- Jun-11 191,537 SF
At the end of the fourth quarter, date total to 4.4M SF.
Houston had 26.3M SF of vacant UnitedTrans**
Eastport 5
industrial space citywide, 1M SF less Among Houston’s major industrial Aug-11 165,035 SF
than the previous quarter. Among the corridors, the Northeast and Northwest
major industrial corridors, the Northwest submarkets outperformed all others in K2 Logistics
Hardy Distribution Center I
submarket held the largest amount of the fourth quarter posting the highest Jun-11 143,600 SF
vacant space with 6.1M SF (5.1% positive net quarterly absorption of
American Packing & Crating*
vacancy), followed by the Southeast 515K SF and 295K SF respectively.
404 N Witter St
submarket with 4.9M SF vacant (5.7% The North submarket followed with Feb-11 140,782 SF
vacancy), the North submarket with 227K SF of positive net absorption.
Packwell Inc.**
4.3M SF vacant (6.0% vacancy), and Wallisville Road Industrial Park - 1
the Southwest submarket with 4.2M SF There were several major tenant move- May-11 136,928 SF
vacant (6.1% vacancy). ins contributing to net absorption gains
Mahindra USA Inc.
in the fourth quarter, including Excel
Satsuma Distribution Center I
Houston’s industrial construction Inc. (191,537 SF); Chemplast Inc. Sep-11 132,913 SF
pipeline significantly increased between (175,000 SF); Del Papa Distributing
Polytex Fibers Corporation**
quarters from 1.0M SF to 2.9M SF, with (98,599 SF); Velocity Express(60,000 Fairbanks Distribution Center II
1.8M SF of this being spec SF); and Consolidated Container Sep-11 102,001 SF
development. The largest project under Company of Texas, LLC (93,170SF).
Pollock Paper Distributors**
construction is a 475,000 SF state-of- 6001 West by Northwest Blvd.
the-art foodservice distribution facility
Leasing Oct-11 99,965 SF
that will be the new Gulf Coast regional Houston’s industrial leasing activity
Eaton Corporation
distribution hub for the Ben E. Keith reached 3.4M SF in the fourth quarter, Sago Plaza
Company. The facility is being 200K SF less than the previous quarter Aug-11 99,125 SF
constructed on an 82 acre tract located and 900K SF more than the same Sercel Inc.**
in Missouri City in the Beltway Crossing quarter last year. For a select list of Techway SW Business Park - 1
Business Park. A list of additional Houston’s top industrial leases signed May-11 99,000 SF
buildings currently under construction to date, please see the column at right. Consolidated Container Company of
can be found on page 4 of this report. Texas, LLC
Eastport 7
Sep-11 93,170 SF
Rental Rates
Palmer Logistics
Houston’s overall average quoted Portwall Distribution Center I
industrial rental rate increased from Sep-11 65,000 SF
$5.41 to $5.45 per SF NNN between
Concept Reinforced LLC**
quarters, and increased by 2.3% on a 12300 Amelia Dr.
year-over-year basis from $5.33 per SF Dec-11 63,000 SF
NNN. By property type, the average
Penske
quoted NNN rental rates are as follows: Westland Business Park Bldg. 1, Ph. 2
$5.17 per SF for distribution space; Dec-11 56,340SF
*Colliers International transaction
** Renewal
COLLIERS INTERNATIONAL | P. 2
3. RESEARCH & FORECAST REPORT | Q4 2011 | HOUSTON INDUSTRIAL MARKET
HOUSTON INDUSTRIAL INVESTMENT SALES Sales Activity Patrick Henry Properties purchased
the 7401 Railhead Lane, a Class B
4Q 2011 Houston’s industrial investment activity
industrial warehouse from West Rail
decreased between quarters, with 23
Total Volume: $28.6M Ind Park Owners for $63 per SF. The
properties trading in the fourth quarter
# of Properties: 23 12,000 SF single-tenant warehouse,
compared to 50 in the third quarter.
Total SF: 1.3M built in 2008, was 100% leased at the
Average Price/SF: $53 time of sale.
The most significant transaction was
Average Cap: 7.5% the sale of Colglazier Properties’
Source: Costar Comps 111,000 SF, Class B Industrial
Warehouse to Cabot Investment
Properties LLC for $43 per SF. The
building, located at 8017 Pinemont
Drive in the Northwest Inner Loop
Industrial submarket, is a multi-tenant
8017 Pinemont 7401 Railhead Ln.
warehouse distribution center which
was 82% occupied at the time of sale.
HOUSTON INDUSTRIAL MARKET SUMMARY
Direct Sublet Total
Direct Sublet Total 4Q Net 2011 Net 4Q 2011 SF Under
Market Rentable Area Vacancy Vacancy Vacancy
Vacant SF Vacant SF Vacant SF Absorption Absorption Completions Completions Construction
Rate Rate Rate
Greater Houston Total 508,774,532 25,650,720 5.0% 633,434 0.1% 26,284,154 5.2% 1,541,538 4,379,039 176,950 1,670,619 2,942,666
0
NW Inner Loop 12,796,454 537,073 4.2% - 0.0% 537,073 4.2% 82,657 69,504 - - -
CBD 32,753,573 1,658,800 5.1% - 0.0% 1,658,800 5.1% (17,423) 42,535 - - -
North Inner Loop 5,344,049 545,113 10.2% - 0.0% 545,113 10.2% - (15,000) - - -
SW Inner Loop 10,308,342 153,769 1.5% - 0.0% 153,769 1.5% 61,566 40,335 - - -
Total Inner Loop 61,202,418 2,894,755 4.7% - 0.0% 2,894,755 4.7% 126,800 137,374 - - -
0
North Fwy/Tomball Pky 15,182,984 1,074,425 7.1% 58,892 0.4% 1,133,317 7.5% 30,903 239,452 - 130,962 370,556
North Hardy Toll Rd 24,730,930 1,315,766 5.3% 7,617 0.0% 1,323,383 5.4% 104,456 449,790 - 216,082 180,238
North Outer Loop 17,810,995 1,061,081 6.0% 100,000 0.6% 1,161,081 6.5% 44,364 238,040 50,225 528,651 146,630
The Woodlands/Conroe 14,807,533 703,850 4.8% - 0.0% 703,850 4.8% 47,263 86,777 - 19,721 65,000
Total North Corridor 72,532,442 4,155,122 5.7% 166,509 0.2% 4,321,631 6.0% 226,986 1,014,059 50,225 895,416 762,424
0
Northeast Hwy 321 1,501,740 - 0.0% - 0.0% - 0.0% 12,000 0 - - -
Northeast Hwy 90 16,525,880 329,851 2.0% 129,000 0.8% 458,851 2.8% 245,501 53,291 - - 20,000
Northeast I-10 4,426,297 136,722 3.1% 17,808 0.4% 154,530 3.5% 27,152 (50,335) - - -
Northeast Inner Loop 11,666,780 539,704 4.6% - 0.0% 539,704 4.6% 230,388 458,614 - - -
Total Northeast Corridor 34,120,697 1,006,277 2.9% 146,808 0.4% 1,153,085 3.4% 515,041 461,570 - - 20,000
0
Hwy 290/Tomball Pky 15,766,407 606,306 3.8% 17,524 0.1% 623,830 4.0% 141,348 263,840 83,225 83,225 242,028
Northwest Hwy 6 6,961,025 106,427 1.5% - 0.0% 106,427 1.5% (3,733) 674,619 - -
Northwest Inner Loop 62,368,037 3,321,880 5.3% 109,852 0.2% 3,431,732 5.5% 92,685 (30,039) - - 267,273
Northwest Near 16,776,186 1,037,166 6.2% 50,512 0.3% 1,087,678 6.5% (52,443) (143,061) - 24,377 -
Northwest Outlier 14,083,318 315,375 2.2% 49,055 0.3% 364,430 2.6% 101,774 142,399 13,500 34,469 51,000
West Outer Loop 22,663,542 1,452,291 6.4% - 0.0% 1,452,291 6.4% 15,302 298,776 - 334,125 83,710
Total Northwest Corridor 138,618,515 6,839,445 4.9% 226,943 0.2% 7,066,388 5.1% 294,933 1,206,534 96,725 476,196 644,011
0
South Highway 35 32,413,863 1,169,633 3.6% - 0.0% 1,169,633 3.6% 80,215 287,175 - - -
South Inner Loop 13,701,524 459,214 3.4% 42,000 0.3% 501,214 3.7% (35,721) 870,866 - 158,210 -
Total South Corridor 46,115,387 1,628,847 3.5% 42,000 0.1% 1,670,847 3.6% 44,494 (162,116) - 158,210 -
906,937
East I-10 Outer Loop 15,692,562 176,135 1.1% - 0.0% 176,135 1.1% 8,800 8,800 - - -
East-SE Far 48,901,733 4,060,326 8.3% 42,666 0.1% 4,102,992 8.4% 146,149 157,474 - - 640,800
SE Outer Loop 21,398,798 648,672 3.0% - 0.0% 648,672 3.0% 16,312 (133,089) - - -
Total Southeast Corridor 85,993,093 4,885,133 5.7% 42,666 0.0% 4,927,799 5.7% 171,261 33,185 - - 640,800
0
Highway 59/Highway 90 23,354,515 1,188,477 5.1% 3,058 0.0% 1,191,535 5.1% 59,181 178,881 - - 728,727
Southwest Far 10,970,085 913,322 8.3% 5,450 0.0% 918,772 8.4% 24,647 109,678 - 58,797 50,449
Southwest Outer Loop 15,148,759 922,959 6.1% - 0.0% 922,959 6.1% 8,245 168,735 - - -
Fort Bend County/Sugar Land 20,718,621 1,216,383 5.9% - 0.0% 1,216,383 5.9% 69,950 117,592 30,000 82,000 96,255
Total Southwest Corridor 70,191,980 4,241,141 6.0% 8,508 0.0% 4,249,649 6.1% 162,023 574,886 30,000 140,797 875,431
COLLIERS INTERNATIONAL | P. 3
4. RESEARCH & FORECAST REPORT | Q4 2011 | HOUSTON INDUSTRIAL MARKET
4Q 2011 Industrial Under Construction
Estimated
Submarket Building Address RBA % Leased Developer Delivery
Southwest Corridor Ind 1001 Cravens Rd 475,000 100.00 Ben E Keith Jan-13
Southeast Corridor Ind 1445 Sens Rd 267,320 71.45 Carson Companies Apr-12
Northwest Corridor Ind 10650 Okanella Ln 267,273 0.00 Proterra Properties, Inc. Feb-12
Southeast Corridor Ind 300 Delta Pky 168,480 100.00 National Property Holdings, LP Feb-12
Southeast Corridor Ind 5200 Gulf Fwy 165,000 100.00 Del Papa Distributing Apr-12
North Corridor Ind 330 Northpark Central Dr 146,700 0.00 Prologis Apr-12
Northwest Corridor Ind W Little York & Langfield Rd 133,480 0.00 CBRE Nov-12
North Corridor Ind 14200 Hollister Rd 128,000 0.00 Liberty Property Trust Feb-12
Southwest Corridor Ind 13423 S Gessner Dr 116,480 0.00 Stream Jul-12
North Corridor Ind 4554 Kennedy Commerce Dr 101,250 100.00 Clay Development Feb-12
Southwest Corridor Ind 12682 Cardinal Meadow 96,255 100.00 API Realty Feb-12
Southwest Corridor Ind 13323 S Gessner Dr 91,520 0.00 Stream Jul-12
North Corridor Ind 5500 N Sam Houston Pky W 84,000 0.00 Liberty Property Trust Jan-12
North Corridor Ind 12309 Cutten Rd 80,000 0.00 Clay Development Mar-12
North Corridor Ind 7607 Bluff Point Dr 78,556 0.00 Insite Jun-12
North Corridor Ind 3375 Pollock Dr 65,000 100.00 KDW Jun-12
Northwest Corridor Ind 10120 Houston Oaks Dr. 51,000 100.00 Urban Construction Southwest Inc. Jan-12
Southwest Corridor Ind 30444 Southwest Fwy 50,449 100.00 Steam Feb-12
Northwest Corridor Ind 13411 West Rd 45,835 100.00 PROEM Mar-12
Southwest Corridor Ind 4230 Greenbriar Dr 45,727 100.00 Puffer Sweiven Jan-12
North Corridor Ind 14000 Vickery Dr 45,380 100.00 Clay Development Jul-12
Southeast Corridor Ind 310 W Deerwood Glen Dr 40,000 0.00 Clay Development Mar-12
Northwest Corridor Ind 12223 FM 529 37,875 0.00 Texas Development Co Jun-12
North Corridor Ind 2438 Greens Rd 33,538 0.00 Capital Commercial Mar-12
Northwest Corridor Ind 12616 N Houston Rosslyn Rd 30,145 0.00 Capital Commercial Jun-12
Northwest Corridor Ind 7645 Railhead Ln 30,000 0.00 TNRG Jul-12
Northwest Corridor Ind 12626 N Houston Rosslyn Rd 21,403 0.00 Capital Commercial May-12
Northeast Corridor Ind 14446 Smith Rd 20,000 0.00 Capital Real Estate Commercial Jan-12
Northwest Corridor Ind 8725 Golden Spike Ln 15,000 0.00 TNRG Jul-12
Northwest Corridor Ind 8715 Golden Spike Ln 12,000 0.00 TNRG Jul-12
2,942,666 Total SF Under Construction
4Q 2011 Industrial Deliveries
Submarket Building Address RBA % Leased Developer Delivered
Hwy 290/Tomball Pky Ind 12606 N Houston Rosslyn - B3 57,415 100 2004 Nw Park Ltd 11-Oct
North Outer Loop Ind 4551 Kennedy Commerce Dr 50,225 100 Clay Development 11-Oct
Sugar Land Ind 1101 Gillingham Ln 30,000 100 Himalaya Herbal Healthcare 11-Nov
Hwy 290/Tomball Pky Ind 8105 Breen 25,810 100 Woodland Oaks Ventures LP 11-Oct
Northwest Outlier 1777 Westborough Dr. B 5 13,500 0 Southwind Properties 11-Oct
176,950 Total SF Delivered 4Q 2011
COLLIERS INTERNATIONAL | P. 4
5. RESEARCH & FORECAST REPORT | Q4 2011 | HOUSTON INDUSTRIAL MARKET
Colliers International Statistics
Revenues: $1.5 Billion
Countries: 61
Offices: 512
Professionals & Staff: 12,509
Brokers: 4,387
Square Feet Managed: 979 Million*
Lease/Sale Transactions: 73,972
Total Transaction Value: $59.6 Billion
(Based on 2010 results.)
*The combination of Colliers International and FirstService results in
2.2 Billion under management (2nd largest in the world).
COLLIERS INTERNATIONAL | HOUSTON
1300 Post Oak Boulevard
Suite 200
Houston, Texas 77056
MAIN +1 713 222 2111
Accelerating success.
COLLIERS INTERNATIONAL | P. 5