Economy... at a glance January 2019
•
0 likes•47 views

Monthly summary of the state of the Spanish and international economy.

Recommended
Recommended
More Related Content
What's hot
What's hot (20)
Similar to Economy... at a glance January 2019
Similar to Economy... at a glance January 2019 (20)
More from Círculo de Empresarios
More from Círculo de Empresarios (20)
Recently uploaded
Recently uploaded (20)
Economy... at a glance January 2019
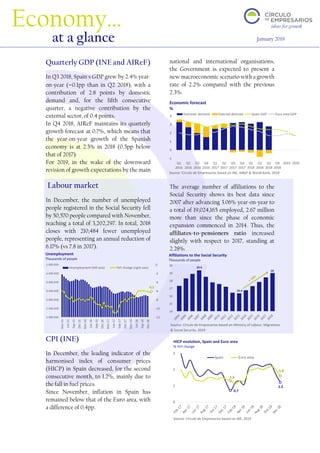
- 1. Source: Círculo de Empresarios based on Ministry of Labour, Migrations & Social Security, 2019 Source: Círculo de Empresarios based on INE, 2019 19.4 16.4 19 14 15 16 17 18 19 20 -1 0 1 2 3 4 Q1 2016 Q2 2016 Q3 2016 Q4 2016 Q1 2017 Q2 2017 Q3 2017 Q4 2017 Q1 2018 Q2 2018 Q3 2018 Q4 2018 2019 2020 Domestic demand External demand Spain GDP Euro area GDP -6.2 -12 -10 -8 -6 -4 -2 0 2.000.000 2.500.000 3.000.000 3.500.000 4.000.000 4.500.000 5.000.000 Mar-15 Jun-15 Sep-15 Dec-15 Mar-16 Jun-16 Sep-16 Dec-16 Mar-17 Jun-17 Sep-17 Dec-17 Mar-18 Jun-18 Sep-18 Dec-18 Unemployment (left axis) YoY change (right axis) 0.7 1.2 1.3 1.6 0 1 2 3 Spain Euro area Quarterly GDP (INE and AIReF) In Q3 2018, Spain's GDP grew by 2.4% year- on-year (-0.1pp than in Q2 2018), with a contribution of 2.8 points by domestic demand and, for the fifth consecutive quarter, a negative contribution by the external sector, of 0.4 points. In Q4 2018, AIReF maintains its quarterly growth forecast at 0.7%, which means that the year-on-year growth of the Spanish economy is at 2.5% in 2018 (0.5pp below that of 2017). For 2019, in the wake of the downward revision of growth expectations by the main national and international organisations, the Government is expected to present a new macroeconomic scenario with a growth rate of 2.2% compared with the previous 2.3%. Labour market In December, the number of unemployed people registered in the Social Security fell by 50,570 people compared with November, reaching a total of 3,202,297. In total, 2018 closes with 210,484 fewer unemployed people, representing an annual reduction of 6.17% (vs 7.8 in 2017). The average number of affiliations to the Social Security shows its best data since 2007 after advancing 3.06% year-on-year to a total of 19,024,165 employed, 2.67 million more than since the phase of economic expansion commenced in 2014. Thus, the affiliates-to-pensioners ratio increased slightly with respect to 2017, standing at 2.28%. CPI (INE) In December, the leading indicator of the harmonised index of consumer prices (HICP) in Spain decreased, for the second consecutive month, to 1.2%, mainly due to the fall in fuel prices. Since November, inflation in Spain has remained below that of the Euro area, with a difference of 0.4pp. Economy… at a glance January 2019 Unemployment Thousands of people Affiliations to the Social Security Thousands of people Economic forecast % Source: Círculo de Empresarios based on INE, AIReF & World Bank, 2019 HICP evolution, Spain and Euro area % YoY change
- 2. ‘Economy at a glance’, a publication of the Círculo de Empresarios produced by its Department of the Economy, contains information and opinion from reliable sources. However, the Círculo de Empresarios does not guarantee its accuracy and does not take responsibility for any errors or omissions. This document is merely informative. As a result, the Círculo de Empresarios is not responsible for any uses that may be made of the publication. The opinions and estimates of the Department can be modified without prior warning. www.circulodeempresarios.org July August September October November December Economic sentiment 112.1 111.6 110.9 109.7 109.5 107.3 Industry 5.8 5.6 4.7 3 3.4 1.1 Services 15.3 14.4 14.7 13.3 13.4 12 Consumer -0.5 -1.9 -2.9 -2.7 -3.9 -6.2 Retail trade 0.3 1.9 2.4 -0.8 -0.5 0 Construction 5.4 6.4 8.3 7.9 8.2 7.2 -2 -1 0 1 2 49.4 54.1 45 50 55 60 65 Apr-14 Aug-14 Dec-14 Apr-15 Aug-15 Dec-15 Apr-16 Aug-16 Dec-16 Apr-17 Aug-17 Dec-17 Apr-18 Aug-18 Dec-18 China US Economic contraction Economic expansion -30000 -20000 -10000 0 -8 -6 -4 -2 0 Primary income (right axis) Secondary income (right axis) Trade balance of goods and services (right axis) Current account in % of GDP (left axis) United Kingdom In Q3 2018, the current account deficit increased 64% year-on-year to £26.52bn (5% of GDP), its worst record since Q3 2016. By components, the largest setbacks occurred in the primary income (108%) and in the trade balance of goods and services (63%). Manufacturing PMI In December, despite the slight rise in production, China's Manufacturing PMI (a leading indicator of GDP evolution) stood at 49.7 points, hinting to an economic contraction. In the case of the US, this indicator of business sentiment fell by 5.2 points, to 54.1, in comparison with November. The evolution of this indicator in these two superpowers (The US & China) coincides with that of the five major European economies. In this context, the World Bank has lowered its growth forecasts to 2.9% in 2019, compared to its previous estimate of 3%. Recession in Germany In November, the industrial activity in Germany continued its third consecutive month of contraction (1.9% per month), mainly due to the weakening of the energy sector. Additionally, in Q3 2018, the German GDP shrank by 0.2% quarterly. Should this trend continue in Q4 the German economy would enter into technical recession1 . Economic sentiment for the Euro area In December, the Economic Sentiment Index of the European Commission, which analyses the confidence of households and companies, suffered a greater decline than expected as it stood at its lowest level since 2016. The worsening private-sector expectations are mainly explained by the possibility of a looming recession in Germany, the global trade tensions, and the risks associated with a no-deal Brexit. Signs of global economic slowdown Source: Círculo de Empresarios based on Office for National Statistics, 2019 Source: Círculo de Empresarios based on CaixaBank Research, National Bureau of Statistics of China & ISM, 2019 Manufacturing PMI Points Current account balance % of GDP, millions of £ Economic Sentiment Index in the Euro area (European Commission) Source: Círculo de Empresarios based on European Commission, 2019 Industrial activity in Germany Monthly percentage change Source: Círculo de Empresarios based on Financial Times & FactSet, 2019 1When you have an economic contraction for two consecutive quarters