Economy... at a glance April 2019
•
0 likes•39 views

Monthly study of the state of the Spanish and international economy

Recommended
Recommended
More Related Content
What's hot
What's hot (20)
Similar to Economy... at a glance April 2019
Similar to Economy... at a glance April 2019 (20)
More from Círculo de Empresarios
More from Círculo de Empresarios (20)
Recently uploaded
Recently uploaded (20)
Economy... at a glance April 2019
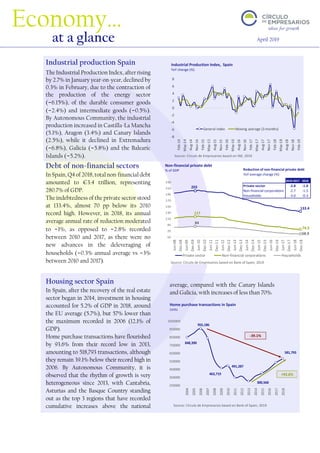
- 1. 203 133.4 117 74.5 84 58.9 50 70 90 110 130 150 170 190 210 230 Jun-08 Dec-08 Jun-09 Dec-09 Jun-10 Dec-10 Jun-11 Dec-11 Jun-12 Dec-12 Jun-13 Dec-13 Jun-14 Dec-14 Jun-15 Dec-15 Jun-16 Dec-16 Jun-17 Dec-17 Jun-18 Dec-18 Private sector Non-financial corporations Households Source: Círculo de Empresarios based on INE, 2019 Source: Círculo de Empresarios based on Bank of Spain, 2019 Source: Círculo de Empresarios based on Bank of Spain, 2019 848,390 955,186 463,719 491,287 300,568 581,793 250000 350000 450000 550000 650000 750000 850000 950000 1050000 2004 2005 2006 2007 2008 2009 2010 2011 2012 2013 2014 2015 2016 2017 2018 -39.1% +93.6% Reduction of non-financial private debt YoY average change (%) 2010-2017 2018 Private sector -2.8 -1.0 Non-financial corporations -2.7 -1.5 Households -3.0 -0.3 -8 -6 -4 -2 0 2 4 6 8 Feb-14 May-14 Aug-14 Nov-14 Feb-15 May-15 Aug-15 Nov-15 Feb-16 May-16 Aug-16 Nov-16 Feb-17 May-17 Aug-17 Nov-17 Feb-18 May-18 Aug-18 Nov-18 Feb-19 General index Moving average (3 months) Industrial production Spain The Industrial Production Index, after rising by 2.7% in January year-on-year, declined by 0.3% in February, due to the contraction of the production of the energy sector (-6.15%), of the durable consumer goods (-2.4%) and intermediate goods (-0.5%). By Autonomous Community, the industrial production increased in Castilla-La Mancha (5.1%), Aragon (3.4%) and Canary Islands (2.5%), while it declined in Extremadura (-6.8%), Galicia (-5.8%) and the Balearic Islands (-5.2%). Debt of non-financial sectors In Spain, Q4 of 2018, total non-financial debt amounted to €3.4 trillion, representing 280.7% of GDP. The indebtedness of the private sector stood at 133.4%, almost 70 pp below its 2010 record high. However, in 2018, its annual average annual rate of reduction moderated to -1%, as opposed to -2.8% recorded between 2010 and 2017, as there were no new advances in the deleveraging of households (-0.3% annual average vs -3% between 2010 and 2017). Housing sector Spain In Spain, after the recovery of the real estate sector began in 2014, investment in housing accounted for 5.2% of GDP in 2018, around the EU average (5.7%), but 57% lower than the maximum recorded in 2006 (12.1% of GDP). Home purchase transactions have flourished by 93.6% from their record low in 2013, amounting to 518,793 transactions, although they remain 39.1% below their record high in 2006. By Autonomous Community, it is observed that the rhythm of growth is very heterogeneous since 2013, with Cantabria, Asturias and the Basque Country standing out as the top 3 regions that have recorded cumulative increases above the national average, compared with the Canary Islands and Galicia, with increases of less than 70%. Economy… at a glance April 2019 Industrial Production Index, Spain YoY change (%) Home purchase transactions in Spain Units Non-financial private debt % of GDP
- 2. ‘Economy at a glance’, a publication of the Círculo de Empresarios produced by its Department of the Economy, contains information and opinion from reliable sources. However, the Círculo de Empresarios does not guarantee its accuracy and does not take responsibility for any errors or omissions. This document is merely informative. As a result, the Círculo de Empresarios is not responsible for any uses that may be made of the publication. The opinions and estimates of the Department can be modified without prior warning. www.circulodeempresarios.org 0% 100% Western Europe 60.4% Eastern Europe 62.7% Central Asia 78.4% Western Asia 59.1% South Asia 60.1% Eastern Asia 65% Sub-SaharanAfrica 49.1% Northern Africa 49.3% South-EasternAsia 61.4% Other more developedregions* 47% Central America 59.6% Caribbean 39.2% South America 58.5% Source: Círculo de Empresarios based on OECD,2019 *Includes US, Canada, Australia, Japan and New Zealand. -30 0 30 60 Jun-14 Sep-14 Dec-14 Mar-15 Jun-15 Sep-15 Dec-15 Mar-16 Jun-16 Sep-16 Dec-16 Mar-17 Jun-17 Sep-17 Dec-17 Mar-18 Jun-18 Sep-18 Dec-18 Mar-19 Exports Imports Note: In 2018, China's nominal GDP reached $13.4 trillion Source: Círculo de Empresarios based on Bloomberg and China Customs, 2019 IMF Forecasts The International Monetary Fund has forecasted a 3.3% growth of the world economy thisyear,0.2%belowitsJanuaryforecast(3.5%), its lowest growth since 2009. This downward revision occurs against the backdrop of soaring risks, alluding to the possible collapse of the negotiations between the United States and China, in its attempt to end the trade war, and theuncertainty associated with the withdrawal oftheUnitedKingdomfromtheEU,interalia. The world economy evinces a trend change. Currently, 70% of the advanced and emerging economies have embarked on a synchronised deceleration, while in 2017, 75% of them exhibitedasynchronisedexpansion. Among the main economies, the biggest downward revision of their growth was in Italy (-0.5 pp), Germany (-0.5 pp), Canada (-0.4 pp)andtheUnitedKingdom(-0.3pp). Industrial production Eurozone In February, the industrial production of the Eurozone declined by 0.3% year-on-year for the fourth consecutive month, mainly explained by the decline of 2% year-on-year in the production of the German industry, which currently represents 37.9% of the total EMU. Specifically, in the absence of external demand, orders for new industrial orders in Germany fell by 8.4% year-to-year, their biggest drop since 2009. As for other main economies of the Eurozone, industrial production in Spain fell by 0.4% year-on-year, that of France stagnated (0%), and Italy recovers by 0.9%. China trade In March, exports of goods from China, after plunging by 20.8% year-on-year in February mainly due to the brief hiatus in activity for the Chinese New Year celebrations, recorded a surge of 14.2% year-on-year, to $198.7 billion. However, the fragility of domestic demand persists, as imports continued to decline for the fourth consecutive month by 7.6% year- on-year (to $166 billion). Underestimated growth, by region % of countries on the total of each region Trade in China YoY change (%)