Independent Lucknow Call Girls 8923113531WhatsApp Lucknow Call Girls make you...
Business... at a glance May 2020
1. (12-29)
(12-9)
(9-6)
-4.3
-6.2
-7
-5
-3
-1
1
3
Q1 2019 Q2 2019 Q3 2019 Q4 2019 Q1 2020
Exports of goods
Imports of goods
-1.8
-4.1
-7
-5
-3
-1
1
3
Q1 2019 Q2 2019 Q3 2019 Q4 2019 Q1 2020
Exports of goods
Imports of goods
-50
-25
0
25
50
4000
8000
12000
16000
20000
1996 1999 2002 2005 2008 2011 2014 2017 2020
Number of companies created
YoY change (right axis)
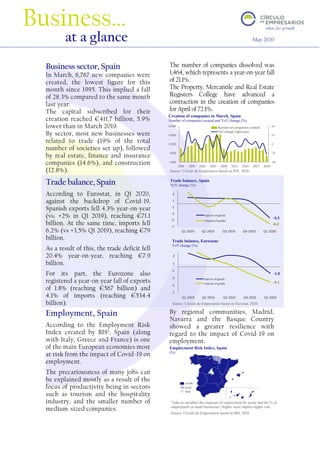
Business sector, Spain
In March, 6,767 new companies were
created, the lowest figure for this
month since 1995. This implied a fall
of 28.3% compared to the same month
last year.
The capital subscribed for their
creation reached €411.7 billion, 5.9%
lower than in March 2019.
By sector, most new businesses were
related to trade (19% of the total
number of societies set up), followed
by real estate, finance and insurance
companies (14.6%), and construction
(12.8%).
The number of companies dissolved was
1,464, which represents a year-on-year fall
of 21.1%.
The Property, Mercantile and Real Estate
Registers College have advanced a
contraction in the creation of companies
for April of 72.1%.
Tradebalance,Spain
According to Eurostat, in Q1 2020,
against the backdrop of Covid-19,
Spanish exports fell 4.3% year-on-year
(vs. +2% in Q1 2019), reaching €71.1
billion. At the same time, imports fell
6.2% (vs +3,5% Q1 2019), reaching €79
billion.
As a result of this, the trade deficit fell
20.4% year-on-year, reaching €7.9
billion.
For its part, the Eurozone also
registered a year-on-year fall of exports
of 1.8% (reaching €567 billion) and
4.1% of imports (reaching €534.4
billion).
Employment, Spain
According to the Employment Risk
Index created by BIS1, Spain (along
with Italy, Greece and France) is one
of the main European economies most
at risk from the impact of Covid-19 on
employment.
The precariousness of many jobs can
be explained mostly as a result of the
focus of productivity being in sectors
such as tourism and the hospitality
industry, and the smaller number of
medium-sized companies.
By regional communities, Madrid,
Navarra and the Basque Country
showed a greater resilience with
regard to the impact of Covid-19 on
employment.
Business…
at a glance May 2020
Employment Risk Index, Spain
(%)
v
Source: Círculo de Empresarios based on Eurostat, 2020.
Trade balance, Spain
YoY change (%)
v
Creation of companies in March, Spain
Number of companies created and YoY change (%)
v
Source: Círculo de Empresarios based on INE, 2020.
Source: Círculo de Empresarios based on BIS, 2020.
1
Take as variables the exposure of employment by sector and the % of
employment in small businesses. Higher score implies higher risk.
Trade balance, Eurozone
YoY change (%)
v
2. ‘Business at a glance’, a publication of the Círculode Empresarios produced by its Department of the Economy, contains information and opinion from reliable sources. However,
the Círculo de Empresarios does not guarantee its accuracy and does not take responsibility for any errors or omissions. This document is merely informative. As a result, the
Círculo de Empresarios is not responsible for any uses that may be made of the publication. The opinions and estimates of the Department can be modified without prior warning.
www.circulodeempresarios.org
-100
-50
0
50
100
0
200
400
600
800
1000
1200
1400
Apr-18
Jun-18
Aug-18
Oct-18
Dec-18
Feb-19
Apr-19
Jun-19
Aug-19
Oct-19
Dec-19
Feb-20
Apr-20
YoY change (right axis)
Number of registrations
-20
-15
-10
-5
0
5
10
Apr-90
Apr-92
Apr-94
Apr-96
Apr-98
Apr-00
Apr-02
Apr-04
Apr-06
Apr-08
Apr-10
Apr-12
Apr-14
Apr-16
Apr-18
Apr-20
Dec-19 Jan-20 Feb-20 Mar-20 Apr-20
EU 1,066,079 956,779 957,052 567,308 270,682
Germany 283,38 246,3 239,943 215,119 120,84
France 211,194 134,229 167,782 62,668 20,997
Italy 140,075 155,528 162,793 28,326 4,279
Spain 105,853 86,443 94,62 37,644 4,163
90
95
100
105
110
115
120
Mar-12
Jul-12
Nov-12
Mar-13
Jul-13
Nov-13
Mar-14
Jul-14
Nov-14
Mar-15
Jul-15
Nov-15
Mar-16
Jul-16
Nov-16
Mar-17
Jul-17
Nov-17
Mar-18
Jul-18
Nov-18
Mar-19
Jul-19
Nov-19
Mar-20
EU
Germany
Automobile industry, EU
In April, the sale of cars in the EU
dropped for the second consecutive
month, registering a year-on-year
fall of 76.3%. Car registrations
decreased to 292,182, the lowest
figure since reporting began in 1990.
Among the main economies in the
region, Italy and Spain showed the
largest year-on-year decreases, with
97.5% and 96.5%, respectively. Sales
in each of these countries were
barely above 4,000 units.
In France, there was a decrease of
88% (with 20,997 new
registrations), and in Germany,
where the impact was less
pronounced, there was a fall of 66%
(120,840 new registrations).
Construction industry, EU
In March, production in the EU
construction industry decreased by
13.4% year-on-year, the biggest fall
since February 2012.
By areas, the public works sector
fell 14.9% year-on-year and building
construction by 13.3%.
Among member countries, decreases
in France (-41.2% year-on-year),
Italy (-35.4%) and Belgium
(-23.2%), stand out, while Germany
remained in positive figures
(+5.1%).
Industrial production, the US
In April, industrial production in
the US shrank by 15% year-on-year
(-11.2% monthly), the biggest drop
since June 2009. This represents 8
consecutive months of year-on-year
falls in production.
By type of goods, durable goods fell
44% year-on-year, hit hard by the
contraction of the car industry
(-70.8% year-on-year). Capital
goods fell 25.9% and non-durable
goods by 7.4%.
Industrial production in construction, EU
Index 2015=100
New car registrations, EU
Thousands of registrations and YoY change (%)
New car registrations, EU
Number of cars
Source: Círculo de Empresarios based on ACEA, 2020.
Source: Círculo de Empresarios based on Eurostat, 2020.
Source: Círculo de Empresarios based on Fed, 2020.
Industrial production, US
YoY change (%)