Agricultural greenhouse gas calculators overestimate fluxes in tropical farming systems
•
1 like•707 views

Agricultural greenhouse gas calculators overestimate fluxes in tropical farming systems Poster presented by Meryl Breton Richards at the 3rd Global Science Conference on Climate-Smart Agriculture in Montpellier. Read more: http://ccafs.cgiar.org/3rd-global-science-conference-%E2%80%9Cclimate-smart-agriculture-2015%E2%80%9D#.VRurLUesXX4
Recommended

Recommended
More Related Content
What's hot
What's hot (20)
Similar to Agricultural greenhouse gas calculators overestimate fluxes in tropical farming systems
Similar to Agricultural greenhouse gas calculators overestimate fluxes in tropical farming systems (20)
More from CCAFS | CGIAR Research Program on Climate Change, Agriculture and Food Security
More from CCAFS | CGIAR Research Program on Climate Change, Agriculture and Food Security (20)
Recently uploaded
Recently uploaded (20)
Agricultural greenhouse gas calculators overestimate fluxes in tropical farming systems
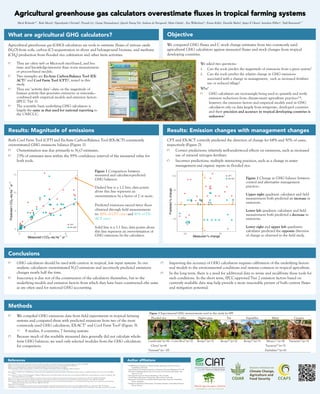
- 1. We compared GHG fluxes and C stock change estimates from two commonly used agricultural GHG calculators against measured fluxes and stock changes from tropical developing countries. Agricultural greenhouse gas calculators overestimate fluxes in tropical farming systems Figure 3 Experimental GHG measurements used in this study (n=49) Flooded rice Coffee Napier grass Tea Vegetables Maize Cassava Cambodia6 (n=8) Costa Rica9 (n=2) Kenya10 (n=1) Kenya10 (n=2) Kenya10 (n=2) Mexico11 (n=4) Tanzania10 (n=1) China7 (n=6) Tanzania10 (n=7) Vietnam8 (n= 10) Zimbabwe12 (n=6) Meryl Richardsa,b*, Ruth Metzelc, Ngonidzashe Chirindad, Proyuth Lye, George Nyamadzawof, Quynh Duong Vug, Andreas de Neergaardi, Myles Oelofsei , Eva Wollenberga,b, Emma Kellerj, Daniella Malink, Jørgen E Olesenl, Jonathan Hillierm, Todd Rosenstockn** Both Cool Farm Tool (CFT) and Ex-Ante Carbon-Balance Tool (EX-ACT) consistently overestimated GHG emissions balance (Figure 1). ! Overestimation was due primarily to N2O estimates. ! 23% of estimates were within the 95% confidence interval of the measured value for both tools. ! GHG calculators should be used with caution in tropical, low input systems. In our analysis, calculators overestimated N2O emissions and incorrectly predicted emissions changes nearly half the time. ! Inaccuracy is due not of the construction of the calculators themselves, but to the underlying models and emission factors from which they have been constructed—the same as are often used for national GHG accounting. ! Improving the accuracy of GHG calculators requires calibration of the underlying factors and models to the environmental conditions and systems common in tropical agriculture. ! In the long term, there is a need for additional data to revise and recalibrate these tools for such conditions. In the short term, IPCC-approved Tier 2 emission factors based on currently available data may help provide a more reasonable picture of both current fluxes and mitigation potential. 1Bernoux, M., Branca, G., Carro, A. & Lipper, L. Ex-ante greenhouse gas balance of agriculture and forestry development programs. Sci. Agric. 31–40 (2010). 2Hillier, J. et al. A farm-focused calculator for emissions from crop and livestock production. Environ. Model. Softw. 26, 1070–1078 (2011). 3Keller, E. et al. Footprinting farms: a comparison of three GHG calculators. Greenh. Gas Meas. Manag. 1–34 (2014). 4The Gold Standard. Climate Smart Agriculture: Cool Farm Tool to Calculate Gold Standard Credits for Smallholders. (2014). Accessible at www.goldstandard.org/climate-smart-agriculture-cool-farm-tool-to-calculate-gold-standard-credits-for-smallholders 5Rosenstock, T. S., Rufino, M. C. & Wollenberg, E. Toward a protocol for quantifying the greenhouse gas balance and identifying mitigation options in smallholder farming systems. Environ. Res. Lett. 021003, (2013). 6Ly, P., Jensen, L. S., Bruun, T. B. & de Neergaard, A. Methane (CH4) and nitrous oxide (N2O) emissions from the system of rice intensification (SRI) under a rain-fed lowland rice ecosystem in Cambodia. Nutr. Cycl. Agroecosystems 97, 13–27 (2013). 7Qin, Y., Liu, S., Guo, Y., Liu, Q. & Zou, J. Methane and nitrous oxide emissions from organic and conventional rice cropping systems in Southeast China. Biol. Fertil. Soils 46, 825–834 (2010). 8Pandey, A. et al. Organic matter and water management strategies to reduce methane and nitrous oxide emissions from rice paddies in Vietnam. Agric. Ecosyst. Environ. 196, 137–146 (2014). 9Hergoualc’h, K., Blanchart, E., Skiba, U., Hénault, C. & Harmand, J.-M. Changes in carbon stock and greenhouse gas balance in a coffee (Coffea arabica) monoculture versus an agroforestry system with Inga densiflora, in Costa Rica. Agric. Ecosyst. & Environ. 148, 102–110 (2012). 10Rosenstock et al. Forthcoming 11Dendooven, L. et al. Greenhouse gas emissions under conservation agriculture compared to traditional cultivation of maize in the central highlands of Mexico. Sci. Total Environ. 431, 237–44 (2012). 12Nyamadzawo, G. et al. Combining organic and inorganic nitrogen fertilisation reduces N2O emissions from cereal crops: a comparative analysis of China and Zimbabwe. Mitig. Adapt. Strateg. Glob. Chang. (2014). Objective Results: Magnitude of emissions Methods Conclusions Agricultural greenhouse gas (GHG) calculators are tools to estimate fluxes of nitrous oxide (N2O) from soils, carbon (C) sequestration in above and belowground biomass, and methane (CH4) production from flooded rice cultivation and other farm activities. What are agricultural GHG calculators? We asked two questions: 1. Can the tools predict the magnitude of emissions from a given system? 2. Can the tools predict the relative change in GHG emissions associated with a change in management, such as increased fertilizer use or reduced tillage? Why? ! GHG calculators are increasingly being used to quantify and verify emission reductions from climate-smart agriculture practices3,4, however, the emission factors and empirical models used in GHG calculators rely on data largely from temperate, developed countries and their precision and accuracy in tropical developing countries is unknown5. ● ●● ● ● ● ● ● ● ● ● ● ● ● ● ● ● ● ● ● ● ● ● ● ● ●● ● ● ● ● ●●●●●●● ●● ●● ●● ● ●● ● 0 5 10 15 0 2 4 6 Measured t CO2−eq ha−1 yr−1 PredictedtCO2−eqha−1 yr−1 ● CFT EX−ACT Figure 1 Comparison between measured and calculator-predicted GHG balances. Dashed line is a 1:2 line; data points above this line represent an overestimation by a factor of 2 or more. Predicted emissions exceed twice those obtained through field measurements in: 45% of CFT cases and 41% of EX- ACT cases Solid line is a 1:1 line; data points above this line represent an over-estimation of GHG emissions by the calculator. ! They are often web or Microsoft excel-based, and less time- and knowledge-intensive than in-situ measurement or process-based models. ! Two examples are Ex-Ante Carbon-Balance Tool (EX- ACT)1 and Cool Farm Tool (CFT)2, tested in this study. ! They use ‘activity data’—data on the magnitude of human activity that generates emissions or removals— combined with empirical models and emission factors (IPCC Tier 1). ! The scientific basis underlying GHG calculators is largely the same as that used for national reporting to the UNFCCC. = ? ! We compiled GHG emissions data from field experiments in tropical farming systems and compared them with predicted emissions from two of the most commonly used GHG calculators, EX-ACT1 and Cool Farm Tool2 (Figure 3). ! 8 studies, 8 countries, 7 farming systems ! Because much of the available measured data generally did not calculate whole- farm GHG balances, we used only selected modules from the GHG calculators for comparison. References a CGIAR Research Program on Climate Change, Agriculture and Food Security, Copenhagen, Denmark b Gund Institute of Ecological Economics, University of Vermont, Burlington VT, USA c Yale School of Management & School of Forestry and Environmental Studies, New Haven CT, USA d International Center for Tropical Agriculture, Cali, Colombia e United Nations Development Programme, Phnom Penh, Cambodia f Department of Soil Science and Agricultural Engineering, University of Zimbabwe, Harare, Zimbabwe g Institute for Agricultural Environment, Vietnamese Academy of Agricultural Sciences, Hanoi, Vietnam Author affiliations CFT and EX-ACT correctly predicted the direction of change for 64% and 50% of cases, respectively (Figure 2). ! Correct predictions: relatively well-understood effects on emissions, such as increased use of mineral nitrogen fertilizer. ! Incorrect predictions: multiple interacting practices, such as a change in water management and organic inputs in flooded rice. Results: Emission changes with management changes Figure 2 Change in GHG balance between control and alternative management practices. Upper right quadrant: calculator and field measurement both predicted an increase in emissions. Lower left quadrant: calculator and field measurement both predicted a decrease in emissions. Lower right and upper left quadrants: calculator predicted the opposite direction of change as observed in the field study. ● ● ● ● ● ● ● ● ● ● ● ● ● ● ● ● ● ● ● ● ● ● ● ● ● ● ● ● ● ● ● ● ● −50 0 50 100 −50 0 50 Measured % change Predicted%change ● CFT EX−ACT - - + +