Atlas of Military Compensation
•
0 likes•4,417 views

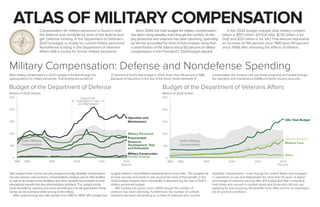
In the President’s 2024 budget request, total military compensation is $551 billion, including veterans' benefits. That amount represents an increase of 134 percent since 1999 after removing the effects of inflation.

Recommended
More Related Content
What's hot
What's hot (20)
Similar to Atlas of Military Compensation
Similar to Atlas of Military Compensation (20)
More from Congressional Budget Office
More from Congressional Budget Office (20)
Recently uploaded
Recently uploaded (20)
Atlas of Military Compensation
- 1. Budget of the Department of Defense Billions of 2024 Dollars Military Personnel Operation and Maintenance Procurement Research, Development, Test, and Evaluation Military Construction Family Housing Large-Scale Operations in Iraq and Afghanistan DoD’s Military Compensation Budget of the Department of Veterans Affairs Billions of 2024 Dollars VA’s Total Budget Income Security Medical Care Other DoD’s Military Compensation S N E W Compensation for military personnel is found in both the defense and nondefense parts of the federal bud- get. Defense funding, in the Department of Defense’s (DoD’s) budget, is mostly for current military personnel. Nondefense funding in the Department of Veterans Affairs (VA) is mostly for former military personnel. Since 2000, the total budget for military compensation has been rising steadily, even though the number of mili- tary personnel and veterans has been declining. Spending by VA has accounted for most of that increase, rising from a small fraction of the total to about 60 percent of military compensation in the President’s 2024 budget request. In the 2024 budget request, total military compen- sation is $551 billion. (Of that total, $230 billion is for DoD and $321 billion is for VA.) That amount represents an increase of 144 percent since 1980 (and 134 percent since 1999) after removing the effects of inflation. Military Compensation: Defense and Nondefense Spending Most military compensation in DoD’s budget is funded through the appropriations for military personnel. That funding accounted for 27 percent of DoD’s total budget in 2024, down from 34 percent in 1980 (because of reductions in the size of the force). Some elements of compensation (for medical care and family programs) are funded through the operation and maintenance (O&M) and family housing accounts. VA’s budget funds income security programs (mostly disability compensation but also pension and survivors’ compensation), medical care (in VA’s facilities as well as at private-sector facilities), and other benefits and activities (mostly educational benefits but also administrative activities). The budget mostly funds benefits for veterans, but some benefits (such as VA-guaranteed home loans) can be accessed while serving in the military. After experiencing very little growth from 1980 to 1999, VA’s budget has roughly tripled in real (inflation-adjusted) terms since then. The budgets for income security and medical care account for most of that growth; in the 2024 budget request, each individually is approaching the size of DoD’s military personnel budget. VA’s funding has grown since 2000, though the number of veterans has been declining. Furthermore, the number of combat veterans has been decreasing as a share of veterans who receive disability compensation—even though the United States was engaged in operations in Iraq and Afghanistan for more than 10 years. A higher percentage of veterans serving after 9/11 (called Gulf War II veterans), both those who served in combat zones and those who did not, are applying for and receiving VA benefits more often and for an expanded list of covered conditions. ATLAS OF MILITARY COMPENSATION
- 2. Trends in Total Compensation in DoD’s Budget Compensation for military service members in DoD’s budget falls into three categories: cash, noncash, and deferred. Cash compensation is what service members get in their paychecks, covering things like basic pay and allow- ances for housing and food. Noncash compensation includes health care for service members and their families as well as services that improve military families’ quality of life (such as schools and commissaries). Deferred compen- sation includes funds for service members’ military pensions, contributions to the Thrift Savings Plan, and health care for future retirees. (Although not reflected here, VA’s spending is a form of deferred compensation.) From the end of the draft in 1973 to the mid-1990s, the costs of compen- sation per service member (adjusted for inflation) grew slowly. After 1997, those costs began to grow more rapidly, driven by pay raises and increas- es in allowances, benefits, and health care costs. Around 2010, compensa- tion costs leveled off—even receding a little from 2013 to 2021, when fiscal spending caps were in place. In the 2024 budget request, DoD’s inflation-adjusted compensation costs per service member are 184 percent more than they were in 1973; most of that growth (a change of 70 percent) occurred between 1999 and 2011.1 For context, if DoD’s costs of military compensation had grown at the same rate as DoD’s civilian compensation between 1999 and 2011, the increase would have been 29 percent. 1. To identify trends in military compensation and remove the effects of changes in the size of the force, total spending is divided by the number of full-time military service members (defined as active component and active guard and reserve service members). This per-person rate only shows trends in costs and does not represent an average service member’s wages. 1973. Ended the Draft: Switched from a conscripted force to an all-volunteer force in the United States. 1981. Raised Pay by 11.7%: Boosted pay and allowances one time to make military pay commensurate with civilian wages. 1981. Adjusted Retirement to High-3 Formula: Shifted from a retirement annuity based on final pay to one based on the highest three years of pay to reduce the cost of pension benefits and increase cash compensation. 1982. Raised Pay by 14.3%: Boosted basic pay one time to improve retention and help the military services achieve their staffing objectives. 1986. Enacted the Military Retirement Reform Act: Put in place legisla- tion that resulted in what is referred to as the Redux military retirement system, which reduced the multipliers in the defined benefit plan for service members with less than 30 years of service. 1996. Created the Military Housing Privatization Initiative: Formed a public-private partnership to improve the quality of military family housing. Private contractors are granted very long leases and financial assistance to build and maintain housing on military bases. Service members use their basic allowance for housing (BAH) to pay rent to the contractors managing the housing areas. 1998. Adjusted BAH: Legislated a new formula for computing BAH: The allowance was set to cover 85 percent of service members’ housing costs (rent, utilities, and insurance) if they rented housing that was equivalent to the housing they would get on a military base. 1999. Repealed Redux: Made enrollment in Redux optional. Service members who joined after August 1, 1986, could choose whether to retire under the pre-Redux system or opt for Redux plus an immediate $30,000 cash payment. 2000. Reformed Pay Table: Began an initiative to adjust military pay targeted to members at certain pay grades and with certain lengths of service. Over the next 10 years, the Congress would go on to adjust pay tables, pay raises, and bonuses to retain talented personnel once they reached mid-career. 2002. Created TRICARE for Life: Provided additional coverage to military retirees and their families who are eligible for Medicare. Paid most of the costs that would otherwise have been paid by retirees out of pocket under Medicare alone. 2004. Established Concurrent Receipt: Allowed some retired military personnel to receive military retirement pay without any offset for dis- ability compensation received from VA. The benefit was phased in over time. 2005. Increased BAH to Cover All Housing Costs: Reduced to zero service members’ out-of-pocket expenses for housing. Applied only to those not living in government-owned-and-operated quarters. 2005. Eliminated Social Security Offset: Increased the benefit paid to spouses of deceased service members, age 62 or older, from 35 per- cent to 55 percent of the deceased service member’s retirement pay. 2008. Changed Reservist Retirement: Lowered the age of eligibility for some reservists to start receiving retirement pay based on periods of active-duty service in support of contingency operations. 2018. Established Blended Retirement System: Created a new retire- ment system for those who joined after 2017. Major changes included matching contributions to the Thrift Savings Plan and reducing the multi- plier (from 2.5 percent to 2.0 percent) for the defined benefit plan. 2019. Reduced BAH: Set BAH to 95 percent of service members’ housing costs (for those not living in government-owned-and-operated quarters). 2021. Repealed Survivor Benefit Offset: Eliminated gradually the loss of any portion of the annuity for survivors of deceased military members who were awarded VA’s Dependency and Indemnity Compensation. 2023. Added Inflation Adjustments for DoD: Increased appropriations across all categories of military compensation in response to unexpect- edly high inflation. 2024. Proposed Pay Increase: Would increase cash compensation (pay raise and BAH) and noncash compensation to address uncharacteristi- cally high inflation as part of the President’s budget request. 2024. Proposed Increase in Bonuses: Would raise recruitment and retention bonuses included in the special pay category of noncash funding to address shortfalls as part of the President’s budget request. 2024. Proposed Adjustment in Military Retirement Accounts: Would adjust the payments into the military retirement accrual fund as part of the 2024 budget request. The normal cost percentage paid by the Treasury for future concurrent receipt payments would increase, and the normal cost percent- age paid by DoD for future nonconcurrent receipt costs would decrease. Timeline of DoD’s Compensation and Landmark Events, 1970 to 2024 Thousands of 2024 Dollars per Person DoD’s Military Compensation Deferred Cash Noncash 1973 1981 1982 1986 1996 1998 2000 2002 2005 2018 2021 2023 2008 2004 1999 2019 2024 Request DoD’s Civilian Compensation
- 3. Noncash Thousands of 2024 Dollars per Person Family Housing Relocationc Benefits Supportd Health Careb Created TRICARE for Life b.Health care is funded out of the operation and maintenance accounts. c. When service members are required to change geographic location for their job. d.Programs that improve the quality of life for service members and their families. Examples are DoD’s schools, commissaries, child care, and welfare and recreation. Cash Thousands of 2024 Dollars per Person Basic Pay Special Pay Food Allowancea Housing Allowancea Reserve Pay Reformed Pay Table a. The allowances for housing and food are not taxed, increasing the cost of military compensation in the federal budget, not shown here. Deferred Thousands of 2024 Dollars per Person Concurrent Receipte Retirees’ Health Care Retirement Created TRICARE for Life Proposal to Adjust Military Retirement Accounts e.The cost of paying retired military personnel their military retirement pay without any offset for disability compensation received from VA. Basic Pay Thousands of 2024 Dollars per Person Basic Pay Budget for Basic Pay if It Grew With the ECI After 1999a Reformed Pay Table a. The ECI is based on measurements from the Bureau of Labor Statistics that are reported by CBO in its historical budget and economic data: www.cbo.gov/data/budget-economic-data. Military Housing Benefits Thousands of 2024 Dollars per Person Total Military Housing Family Housing Budget for Basic Allowance for Housing if It Grew at the Same Rate as Residential Rents After 1999b Basic Allowance for Housing Increased BAH to 100% of Housing Costs Reduced BAH to 95% b.The rate of growth in residential rents can be found in CBO’s historical budget and economic data: www.cbo.gov/data/budget- economic-data. A Detailed Look at the Categories of DoD’s Compensation Trends in Cash Compensation Two of the largest elements of cash compensation are basic pay (30 percent of compensation) and the basic allowance for housing (10 percent of compensation). Since 2000, military pay reform caused basic pay to grow faster in real terms than if it had grown with the civilian employment cost index, or ECI. Growth was particularly high from 2002 to 2005. That trend ended around 2010 as DoD began reducing the size of its force. After 2010, the budget for basic pay was relatively flat, even receding a bit between 2010 and 2023. Starting in the late 1990s, DoD standardized how it compensated ser- vice members who paid for off-base housing in the United States and cre- ated the BAH. Then, starting in the early 2000s, DoD privatized much of its on-base family housing. Service members who live in that housing use their BAH to pay the cost of rent and utilities to private contractors who manage that housing. (Family housing accounts retain some funding to maintain government-owned-and-operated quarters and to oversee the contractors that manage the military housing privatization program.) Those changes in how DoD accounts for the cost of military housing shifted most funding for on-base family housing from an in-kind benefit (paid out of the family housing account) to a tax-free cash benefit (BAH) in the military personnel account. Starting in 2000, as more and more military housing was privatized, BAH grew, leveling off around 2010.
- 4. Cost of Compensation per Service Member, 2023 Tax Advantagea 5% Active-Duty Health Care 11% Noncash $19,800 Cash (Regular military compensation) $67,100 Deferred $23,500 Allowances for Housing and Food 26% Basic Pay 30% Retirement Pay 11% Retirement Pay 16% Retirees’ Health Care 10% Retirees’ Health Care 6% Other Noncash 7% 3% Tax Advantagea 7% Active-Duty Health Care Noncash $19,800 Cash (Regular military compensation) $119,800 Deferred $40,900 Allowances for Housing and Food 19% Basic Pay 45% Other Noncash 4% Total compensation costs = $110,400 Median Enlisted Personnel (E-4 with dependents, average age: 22) Total compensation costs = $180,500 Median Officers (O-3 with dependents, average age: 28) a. DoD’s estimate of the benefit a service member receives from the tax-free allowances for food and housing. That amount represents a cost to the federal government in terms of lost tax revenues. Components of Service Members’ Compensation In setting pay and benefits, DoD aims to offer a package that adequately compensates for the rigors of military life, including overseas deployments and extended time away from family members. Through a mix of cash, noncash, and deferred compensation, DoD attempts to attract and retain the high-quality personnel it needs to fill specialized occupations and to motivate service members to perform their best. Service members receive the cash and noncash components of their compensation each year that they are on active duty. They receive deferred compensation once they leave service— any money and matching funds they invested in the Thrift Savings Plan (if they opted in) and an annuity for those who retire after 20 or more years of service. How Elements of Military Compensation Might Be Valued DoD’s compensation mix is intended to attract and retain service mem- bers at different stages of their careers. In general, younger people value cash compensation (like enlistment and reenlistment bonuses and cash pay) more than noncash and deferred compensation. A dollar that they can spend immediately is worth more to them than a dollar of noncash compensation and much more to them than a dollar of a deferred benefit. However, as service members reach the middle and latter portions of their careers, they tend to place more value on noncash and deferred compen- sation because they have families and are getting closer to retirement. In fact, most service members who stay past 10 years remain until retirement in part because of the increasing value of those benefits to them. For enlisted personnel in labor-intensive services (the Army and Marine Corps), cash compensation is very important. That is because almost 80 percent of Marine Corps recruits and about half of Army recruits serve only one tour of duty (or about four years). By contrast, roughly one-quarter of enlisted personnel in platform-centric forces (the Navy and the Air Force) stay until retirement. So noncash and deferred compensation play a more important role for them. Average Length of Military Service Percentage of Personnel Remaining in the Military, by Years of Service Officers Enlisted Personnel Air Force Navy Navy Marine Corps Army Average First Term (4 years) Typical Service Needed to Retire (20 years) Air Force Marine Corps Army
- 5. Yearly Median Cash Earnings, by Years of Experience Thousands of 2024 Dollars 1 Civilian Median Civilian Median Military RMC Military RMC Military Basic Pay Military Basic Pay DoD’s Goal for RMC DoD’s Goal for RMC Civilian 90th Percentile Enlisted Personnel Officers In this figure, a civilian’s years of experience correlate to the median military pay based on years of service. Civilians with a high school diploma and some college education are compared with enlisted personnel; civilians with a bachelor’s degree or more are compared with officers. This publication was prepared by F. Matthew Woodward in December 2023 in response to a request from the Chair of the Subcommittee on Personnel of the Senate Armed Services Committee. Christine Bogusz edited it, and R. L. Rebach formatted it and produced the graphics. The fact-checker was Nikhil Bhandarkar. The data were provided by the Department of Defense and are available at www.cbo.gov/publication/59475#data. All data are for federal fiscal years, which run from October 1 to September 30 and are designated by the calendar year in which they end. Numbers may not add up to totals because of rounding. How Military Compensation Compares With Civilian Compensation When setting or adjusting pay for service members, DoD compares military compensation with that of civilians by using the metric of regular military compensation (RMC), which includes all cash compensation and the value of the tax-free allowances for service members of different ages. DoD estimates that to attract and retain quality personnel, RMC must be at or above the 70th percentile of compensation for civilians of the same ages and education levels. Even without including noncash or deferred components of compensation, RMC for enlisted personnel and officers currently exceeds the cash compensation of 90 percent of comparable civilians. Despite compensating its service members well relative to comparable civilians, DoD is having trouble recruiting in the current tight labor market.