Remarks
09/22/2018 - Bold section headings enhance the work's overall organization. Recurring Professional Communication (Articulation) concerns are evident with parts of speech, varying issues such as verb form(s), subject-verb agreement, and sentence fluency, varying issues such as run-on sentences, comma splices. These writing concerns diminish the clarity of the response.
10/7/18 - Financial institutions' use of data is adequately presented as a real-world business situation, yet the summary is lacking details particularly how the business situation can be addressed by data collection and analysis. One specific question or scenario for data analysis could not be located.
For instruction on describing the relevant data collected, please revisit the section titled “The Case for Quantitative Analysis” in the study plan for this course by clicking on the link located in the top left in this rubric item’s name,“B1. Summary of Data.”
9/22/18 - The submission includes an adequate summary of a real-world business situation regarding financial institutions. The provided detail is insufficient as it is unclear how this business situation can be addressed by collecting and analyzing a set of data, and more specifically a research question is not clearly identified.
10/7/18 - The submission provides financial data as relevant data for the analysis. It is unclear whether the described data relates to a relevant business situation. Please review this response for alignment to the business situation once aspect A has been revised
9/22/18 - The submission provides a limited discussion on financial data as relevant data for the analysis. It is unclear whether the described data relates to a relevant business situation. Please review this response for alignment to the business situation once aspect A has been revised.
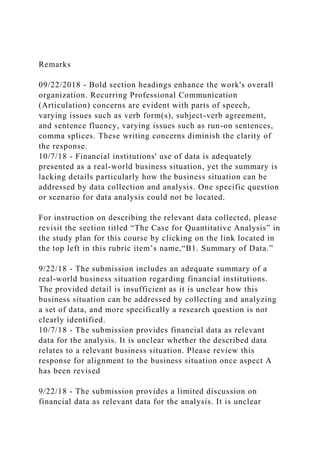
10/7/18 - The work provides graphics of processes and generalized financial information as a graphical display of the data collected. It is not clear whether this graphical display is appropriate,as the relevancy of the data collected to the business situation could not be verified. Please review the response to this aspect after revising the data collected in aspect B1.
9/22/18 - Two bar graphs are provided as a graphical display. It is unclear whether the provided graphical display is appropriate, as the description of the data collected in aspect B1 is insufficient.
10/7/18 - The submission describes several common techniques in the finance realm as the data analysis techniques. It is not clear whether this is an appropriate technique to be used to analyze the collected data. Please review this response for alignment to the data to be collected once aspect B1 has been revised
9/22/18 - Numerous possible techniques are described. However, it is unclear whether any of these techniques is appropriate for data that is relevant to the business situation.
10/7/18 - The submission provides several examples of how data could be used in fina.
Remarks09222018 - Bold section headings enhance the works o.docx
1. Remarks
09/22/2018 - Bold section headings enhance the work's overall
organization. Recurring Professional Communication
(Articulation) concerns are evident with parts of speech,
varying issues such as verb form(s), subject-verb agreement,
and sentence fluency, varying issues such as run-on sentences,
comma splices. These writing concerns diminish the clarity of
the response.
10/7/18 - Financial institutions' use of data is adequately
presented as a real-world business situation, yet the summary is
lacking details particularly how the business situation can be
addressed by data collection and analysis. One specific question
or scenario for data analysis could not be located.
For instruction on describing the relevant data collected, please
revisit the section titled “The Case for Quantitative Analysis” in
the study plan for this course by clicking on the link located in
the top left in this rubric item’s name,“B1. Summary of Data.”
9/22/18 - The submission includes an adequate summary of a
real-world business situation regarding financial institutions.
The provided detail is insufficient as it is unclear how this
business situation can be addressed by collecting and analyzing
a set of data, and more specifically a research question is not
clearly identified.
10/7/18 - The submission provides financial data as relevant
data for the analysis. It is unclear whether the described data
relates to a relevant business situation. Please review this
response for alignment to the business situation once aspect A
has been revised
9/22/18 - The submission provides a limited discussion on
financial data as relevant data for the analysis. It is unclear
2. whether the described data relates to a relevant business
situation. Please review this response for alignment to the
business situation once aspect A has been revised.
10/7/18 - The work provides graphics of processes and
generalized financial information as a graphical display of the
data collected. It is not clear whether this graphical display is
appropriate,as the relevancy of the data collected to the
business situation could not be verified. Please review the
response to this aspect after revising the data collected in aspect
B1.
9/22/18 - Two bar graphs are provided as a graphical display. It
is unclear whether the provided graphical display is appropriate,
as the description of the data collected in aspect B1 is
insufficient.
10/7/18 - The submission describes several common techniques
in the finance realm as the data analysis techniques. It is not
clear whether this is an appropriate technique to be used to
analyze the collected data. Please review this response for
alignment to the data to be collected once aspect B1 has been
revised
9/22/18 - Numerous possible techniques are described.
However, it is unclear whether any of these techniques is
appropriate for data that is relevant to the business situation.
10/7/18 - The submission provides several examples of how
data could be used in finance. The output or any calculation
from an analytical analysis is not evident.
9/22/18 - The submission provides a discussion around the use
of data for financial institutions. The output or any calculation
from an analytical analysis is not evident.
10/7/18 - The submission explains a background of mistrust
with financial institutions. A justification of why a specific
analytic technique was chosen could not be located.
3. 9/22/18 - The potential benefits from data analysis is described.
A logical justification for a chosen data analysis technique
could not be found.
10/7/18 - The submission provides an explanation with a flow
chart for how data plays a role in management. A discussion of
the data analysis results is not apparent.
9/22/18 - Several techniques are described, including possible
uses for financial institutions. Results and discussions about the
results of an analytic technique could not be identified.
10/7/18 - The work provides a conclusion on data usage in
business. A discussion of the limitations of the data analysis
could not be found
9/22/18 - Two graphs are sufficiently provided. A discussion on
the limitations on the attempted analytic technique could not be
identified.
10/7/18 - The work explains several potentially viable
techniques that could be used. A discussion of a recommended
course of action based on the analysis results could not be
located.
9/22/18 - A discussion on the variety of ways that data can be
used is noted. A logical recommendation for action based on the
results of an analytic technique could not be identified.
Data Driven Decision MakingTemplate
Student name:
ID number:
Date:
13/8/2018
PROMPT
4. RESPONSE
B.
Describe a real-world business situation that could be addressed
by collecting and analyzing a set of data.
Poor corporate governance in the U.S is of concern to
businesses as it could lead to heavy fines disrupting a business.
Financial institutions are experiencing huge fines for failing to
adhere to the required standards and regulations. Poor corporate
governance costs the financial institutions over $150 billion
since 2009.
B1.
Summarize one question or decision relevant to the real-world
business situation you will answer by collecting and analyzing a
set of data.
What is the effect of shady dealings in financial institutions?
B2.
Explain why the situation or question would benefit from a data
analysis.
Prevention is believed to be better than cure; therefore, there is
need to list huge fines experienced by some banks to help other
financial institutions avoid shady dealings that could incur them
5. huge fines that could disrupt business.
B3.
Identify data you will need to collect that is relevant to the
situation or question. Note: A sample size of 30 or more is
suggested to provide a statistically reliable finding.
The sample will consist of 10 recorded years from the Boston
Consulting Group website. The samples measured are the huge
fines banks have incurred due to shady dealings thus the need to
avoid such dealings.
B4.
Describe the data gathering methodology you will use to collect
data.
Secondary data collection will help collect information about
the hefty fines imposed on financial institutions to help prevent
illegal and unethical conduct of financial institutions. This
information will be obtained from the Boston Consulting Group
research website.
B5.
Identify the appropriate data analysis technique youwill use to
analyze this data (e.g., linear programming, crossover analysis,
t-test, regression).
The regression analysis will be the most suitable data analysis
technique to be used. Linear regression will be used to
understand the changes in hefty fines imposed on financial
6. institutions over years.
B5a.
Explain why the data analysis technique you chose isan
appropriatetechnique to analyze the data collected.
Regression analysis, in particular, linear regression, uses
statistical processes for determining relationships. It will help
model relationships and find trends in data. An equation
obtained from the data can help draw a graph to better illustrate
the trends in data. This can help make predictions of the data.
Additionally, linear regression is straightforward and easy to
use.
C.
Sources Used (if applicable)
Staying the Course in Banking. (2017). Retrieved from The
Boston Consulting Group: http://image-
src.bcg.com/BCG_COM/BCG-Staying-the-Course-in-Banking-
Mar-2017_tcm9-146794.pdf
7. As we discussed, consider running a regression analysis on the
data below to determine if there is a significant (downward)
trend over those 7 years. See attached on how you could run
this.
Regression, Trend Analysis & Multiple Regression using Excel
Regression allows for…
· Determining if there is a statistically significant relationship
between a target (dependent) variable and one or more predictor
(independent) variables (e.g., Is on-time progress for course
work related to GPA?)
· Determining if there is a trend over time
· Possibility for predicting the value of a target variable given
the value of one or more predictor variables (e.g., Predict the
number of months to graduate based on an Objective
Assessment score for this course.)
Let’s look at a regression example involving one target variable
and one predictor variable (i.e., Simple Linear Regression, also
known as Least Squares Regression). Here we’ll determine
whether there’s a significant trend from 1998 to 2014 in U.S.
deaths from heroin (source: http://wonder.cdc.gov/mcd.html).
Below is a scatter plot of the data (note that a scatter plot is
usually the plot of choice for regression).
8. This type of regression analysis is a Trend Analysis given that
our predictor variable is time.
There are 16 observations (1999 to 2014). With this type of
analysis, there should generally be at least 15 observations.
Using Excel to Conduct a Simple Linear Regression
Below are the actual values, from the previous chart, shown in
an Excel table.
Note: If you are running a trend analysis based on days, weeks,
months, quarters, etc., you should code each time period as 1, 2,
3, etc. (e.g., month 1 = 1, month 2 = 2, …).
In this example we can use the actual years, given that they are
consecutive numbers.
In Excel, select … Data Data Analysis (note: if you cannot find
the “Data Analysis” option, then check out this tip sheet)
Then select “Regression” from the analyses options.
Fill in the Regression Analysis pop-up box as shown below.
Note: The “Labels” option is only appropriate if the first row of
9. your selected Input contains labels for your columns (“Year”
and “Heroin Deaths” in the case above).
Upon hitting “OK”, you should get the following output (you
may need to expand some of the columns).
Key information has been highlighted including:
· R-square = .645; this is the correlation coefficient squared and
is a measure of the “goodness of fit” between the two variables
of time and heroin deaths [recall, R-square can vary between 0
(no fit) and 1 (perfect fit); a value of .645 indicates a
reasonably high fit]
· While ANOVA is most commonly used to test for significant
mean differences for 3 or more groups, in this case it is used to
statistically test whether there is a significant relationship
between the two variables.
· In this case, F=25.4 and p = .00018
· Because p < .05, we reject the null hypothesis (of no
relationship) and instead conclude that there is a significant
relationship (trend) between time and heroin deaths
· As can be seen from the previous chart, heroin deaths
progressively increase from 1999 to 2014
(note: for the “Significance F or P-value”, Excel has a specific
notation for very small numbers/fractions. For example,
suppose that a p-value is reported in Excel as 1.73E-8. This is
Excel’s notation for “move the decimal place to the left 8
places”, or 0.0000000173. In other words, this is much smaller
than 0.05, so we could conclude in this case that p<.05 and that
there is a significant relationship).
· Finally, the regression coefficients are given for the straight
regression line.
10. · Recall, the formula for a straight line … Y = mX + b
· Here, m and b are coefficients from the prior table
· So, our regression line formula is
· Y = 435.4 X – 870,120.1
· Because our regression is statistically significant, we can use
this formula to predict future heroin deaths
· For example, the predicted number of Heroin deaths for 2015
is…
· Y = 435.4 (2015) – 870,120.1 = 7,231
· Notice that the 2015 predicted value (7,231) is less than the
actual values for 2014 (10,574) and 2013 (8,257)
· This is because a straight line through the data points isn’t the
best fit of the trend. As we’ll see, a curvi-linear trend captures
the data pattern more accurately.
Here is an appropriate write-up of these results (notice the
inclusion and interpretation of R-square, F-value, p-value, and
regression formula):
There is a relatively strong goodness of fit between time and
increasing heroin deaths as indicated by an R-square of 0.645.
This relationship is statistically significant (F=25.4, p<.05).
The regression formula is Y = 435.4 X – 870,120.1, and
indicates that the predicated number of heroin deaths for the
next time period (i.e., 2015) is 7,231.
To add a trend (regression) line to the chart select (left click
on) the data points Add Trendline
Then select “Linear” trend. You can also check the boxes to
include the Regression Equation and R-Square value.
11. For the math inclined, a better predictive trend can be derived
using a polynomial function as shown below. Notice that the R-
square approaches 1.0, indicating that time and heroin deaths
are very highly related in this curvi-linear function.
Multiple Regression
Multiple regression is used when there are multiple predictors
and a single target (dependent) variable.
For example, can the number of annual heroin deaths be
predicted from the percent of U.S. adults who use Marijuana,
Cocaine, Hallucinogens, and/or Psychotherapeutics?
The screen shot on the next page shows such data from 2002-
2013 (source:
http://www.samhsa.gov/data/sites/default/files/NSDUHresultsP
DFWHTML2013/Web/NSDUHresults2013.htm).
Within Excel Data Data Analysis Regression
In this case our Y (target) variable is annual heroin deaths.
Notice in the following screen shot that we specify the entire
range of the X (predictor) variables (columns C through F).
In this analysis, we’re going to exclude “Year” as a variable per
se.
After clicking OK, here are the results.
12. · The overall R-square is 0.796, indicating a good fit between
the number of heroin deaths and one or more of the predictor
variables.
· The ANOVA shows F=6.84, p=.014. Because p < .05 we can
conclude that overall there is a significant relationship between
the number of heroin deaths and one or more of the predictor
variables.
· The individual t-tests reveal that only Marijuana usage is
significantly related to number of heroin deaths (p = .015; for
all other predictors p > .05).
An appropriate write-up of these results would be:
The R-square of 0.80 indicates a relatively strong goodness of
fit between annual heroin deaths and the predicator variables
(incidence of use of marijuana, cocaine, hallucinogens, and
psychotherapeutics). Overall, there is a significant relationship
(F=6.84, p<.05). However, only marijuana use is significantly
related to heroin deaths (p<.05). The regression formula for
predicating annual heroin deaths is
Y = 3,226.6 X1 + 871.4 X2 – 3,376.5 X3 -1,093.1 X4 -13,854.5.
Where X1, X2, X3, and X4 are, respectively, incidence of
marijuana, cocaine, hallucinogens and psychotherapeutics use.
Below is a scatterplot of Number of Heroin Deaths and
Marijuana Usage across 12 years. Included in the scatterplot
are: the simple regression line, as well as the R-Square and the
Regression Equation for just these 2 variables.
So, can we conclude that a rise in marijuana use is a cause of
the increase in deaths by heroin? While these are significantly
related, we cannot conclude that one causes the other (You may
have heard the expression “correlation does not imply
causation”; the same applies to regression).
13. For example, below are findings for 2002-2013 of Harvard
Tuition rates (source:
http://kwharbaugh.blogspot.com/2005/02/educational-
costs.html) and Heroin deaths. Despite a statistically
significant relationship (p < .001), we wouldn’t conclude that
the rise in Harvard tuition rates is a cause of the increase in
heroin deaths.
1
1
Data Driven Decision-Making Report
Bryan West
WGU
14. Note to Student: Throughout this document, a Professional
Communications Evaluator has identified examples of the most
pervasive and repetitive writing concerns that are limiting
readability.
The student must carefully review the entire submission, using
the
identified examples as a guide, to correct the additional writing
concerns that recur throughout the submission. With
resubmissions,
different writing concerns will be noted in order to provide the
student
with additional examples of the most pervasive writing
concerns.
8
Table of Contents
1. Summary
...............................................................................................
.......................................... 3
2. Data Collected Report
15. ...............................................................................................
....................... 3
3. Graphical Representation of Data Analysis
...................................................................................... 4
4. Effect of unethical dealings in financial institutions
.......................................................................... 6
5. The technique used for financial institution data analysis
................................................................. 6
6. Conclusion
............................................................................................. ..
....................................... 7
7. References
...............................................................................................
........................................ 8
16. 8
1. Summary
For several years many financial institutions have been
criticized and had been linked with a
negative understanding and the impression. There are those who
claims they inspires greediness
and also encourages pleasure and thereby causes anxiety to their
customers as they utilize their
products and services.
The basis of analyzing financial data is very useful to all
financial intuitions as it will bind the
baking organizations’ information so that it can ease the
identification of better business
environment and chances for expanding the business structure.
The idea of implementing data analysis in banks has been in the
business discussion forums
and several researches have been done about the most pertinent
ways of how to gather all the
information that revolves around the business organizations and
how useful information can be
17. retrieved from these data.
2. Data Collected Report
From all spheres of industries, data is the most crucial
component that can reflect the image
of the company and it can also change and determines how the
business organization can
function. This data in the form that can be read and interpreted
by the machine as well as the
human-readable information.
Commented [PC61]: Parts of Speech – subject-verb
agreement
Note: Errors of this nature recur in the work.
Module 6: Parts of Speech
https://lrps.wgu.edu/provision/71484265
Click the link above to be directed to the Guide to
Academic Writing created by the WGU Writing Center.
This link includes information on the writing trait of
Parts of Speech, more specifically, subject-verb
agreement.
https://lrps.wgu.edu/provision/71484265
8
Figure 1 Process of analyzing in financial institutions
18. The process of collecting data is dependent mostly on how that
information will be used.
Financial institution data collected for the purposes of market
analysis would need to undergo a
comprehensive procedure that entails a calculated searching
technique by the analysts.
There are two types of data that are very important to the
organizations. The primary data
which is collected directly by those carrying out analysis and
research and they are usually very
important in addressing the issues that the organization is
facing in the present. Secondary data,
on the other hand, refers to data that has been collected and is
readily available for use by those
carrying out the analysis. Secondary data is very useful
especially in cases where the primary
data are not available (Barth, & Levine, 2016).
3. Graphical Representation of Data Analysis
Sometimes the organizational data can be devastating,
businesses are often challenged by the
huge amount of information and therefore having some means to
summarize this data would be
more sensible even for the organization especially during
decision-making process or in the
19. analysis.
Financial institution data can be represented in the histogram,
bar chart etc. the graph
representation of the financial institution data is usually used
when the organization wants to
8
illustrate this information for analysis and to assist in predicting
the business growth, competition
and expansion where necessary.
Figure 2 Capex Finance
8
Figure 3 Data Analysis in Financial Institutions
4. Effect of unethical dealings in financial institutions
The perception of the unethical dealings in financial institutions
has a diverse effect on its
20. consumers and their customers such as providing inaccurate
information and deceptive
illustrations of productions and services, it will also fail to
recognize precisely what the client
needs hence a greater disappointment to the client on giving
proper recommendation. Further to
this, there is also absence of necessary skills and information.
5. The technique used for financial institution data analysis
A study that was done in Toronto, Canada in 2013 shows that
the financial institution data is
one of the top three crucial issues that matter most in every
organization. There are various
techniques that can be used to analyze data as stated below;
4.1 Classification tree analysis
In this technique, the numerical data are identified, and the
findings are grouped together
depending or subject to the observation made. The team
carrying out the observation would also
need to do a specific training particularly using the past
findings while comparing to the present
observation.
4.2 Genetic algorithm
21. Genetic algorithm technique is usually motivated by the
solution and the development of
analysis progression. It normally employs the natural methods
as well as the inheritance
technique. Such methods are very useful when developing very
valuable resolutions to the
hitches that would need more improvements to be made.
4.3 Regression Analysis
Commented [PC62]: Sentence Fluency – run-on sentence
(comma splice)
Note: Varying Sentence Fluency issues recur in the work.
Module 8.24: Comma Splices
https://lrps.wgu.edu/provision/117997324
Click the link above to be directed to the Guide to
Academic Writing created by the WGU Writing Center.
This link includes information on comma splices.
https://lrps.wgu.edu/provision/117997324
8
Basically, regression analysis technique comprises the aspects
of deploying some of the self-
determining variances so as to examine how it affects those
variables especially on the issues
22. such as the duration that was taken during the whole process.
The technique is more suitable
when applied to situations such as a progressive quantitative
technique like that of speed and
weight.
4.4 Social Network Analysis
This technique was implemented in telecommunication
production and almost immediately
was also implemented by the sociology for the purposes of
learning interactive relationships. The
technique is currently practical especially in examining the
associations among personnel in
different fields as well as those of money-making firms (Lone,
2016).
6. Conclusion
There are numerous and various ways of presenting defining
and presenting financial
institution data during the analysis. Tools such as frequency
data tables, histogram and bar charts
are some of the convenient and valuable tools for necessary in
presenting a summarized data.
The data the represented on a frequency table normally depicts
the existence of precise data
23. including the particular data at a specified interval.
Additionally, the other means to observe the data can be
concluded by the use of the
percentages. The percentages depict the amount that is recorded
and analyze at a particular given
time in the financial institution data score set.
Commented [PC63]: Parts of Speech – verb form
Note: Varying Parts of Speech issues recur in the work.
Module 6: Parts of Speech
https://lrps.wgu.edu/provision/71484265
Click the link above to be directed to the Guide to
Academic Writing created by the WGU Writing Center.
This link includes information on the writing trait of
Parts of Speech, more specifically, verbs.
https://lrps.wgu.edu/provision/71484265
8
7. References
Barth, J. R., & Levine, R. (2016). Regulation and governance of
financial institutions.
24. Cheltenham, UK: Edward Elgar.
Global financial development report 2017/2018: Bankers
without borders. (2018).
Washington, DC: World Bank Group.
In Cavanillas, J. M., In Curry, E., & In Wahlster, W. (2016).
New horizons for a data-driven
economy: A roadmap for usage and exploitation of big data in
Europe. Switzerland:
SpringerOpen.
International Halal Conference, & In Nurhidayah, M. H. (2018).
Proceedings of the 3rd
International Halal Conference (INHAC 2016).
Lone, F. A. (2016). Islamic Banks and Financial Institutions: A
Study of their Objectives and
Achievements. (Springer eBooks 2016 [recurso electrónico].)
Evaluation Results
Requirement : Data-Driven Decision Making: VPT Task 2
25. AUTHOR: Bryan West
DATE EVALUATED: 10/07/2018 07:37:46 AM (MDT)
DRF TEMPLATE: Data-Driven Decision Making (GR, C207,
VPT2-1016)
PROGRAM: Data-Driven Decision Making (GR, C207, VPT2-
1016)
EVALUATION METHOD : Using Rubric
FINAL SCORE
Does not
Meet
General comments:
10/7/18 - Please confer with a Course Mentor/Instructor before
working further on this
assessment.
A work is presented that clearly explains the role of data in
decision making, particularly
highlighting financial institutions. A specific data analysis
scenario and research question
were not specified and all the subsequent aspects regarding the
use of data to infer a
response to the research question could not be identified.
Detailed Results
( Rubric used : VPT Task 2 (1016))
ARTICULATION OF RESPONSE (CLARITY,
26. ORGANIZATION, MECHANICS)
NOT EVIDENT APPROACHING
COMPETENCE
COMPETENT
The candidate provides
unsatisfactory
articulation of response.
The candidate provides
weak articulation of
response.
The candidate provides
adequate articulation of
response.
CRITERION SCORE :
Competent
COMMENTS ON THIS CRITERION:
10/7/18 - The artifact is adequately articulated.
09/22/2018 - Bold section headings enhance the work's overall
organization.
Recurring Professional Communication (Articulation) concerns
are evident with parts
of speech, varying issues such as verb form(s), subject-verb
agreement, and
sentence fluency, varying issues such as run-on sentences,
27. comma splices. These
writing concerns diminish the clarity of the response.
Please click on the pdf file attached to this evaluation; this
markup includes
examples of the submission’s most pervasive writing concerns.
The concerns
noted are representative errors; similar errors appear throughout
the document and
require revision. Direct links to the Guide to Academic Writing
Resource are also
included to assist with revision efforts. For more information
regarding the five writing
competency categories and assistance with addressing writing
concerns, please access
the Guide to Academic Writing and contact the WGU Writing
Center by clicking on the
link located in the rubric item “Articulation of Response.”
Students are encouraged to schedule a live appointment with the
WGU Writing
Center. Program Mentors and Course Instructors may also assist
students with
scheduling WGU Writing Center appointments.
A. SUMMARY OF SITUATION
NOT EVIDENT APPROACHING
COMPETENCE
COMPETENT
The candidate does not
provide a logical
summary of the real-
world business situation
28. identified in task 1.
The candidate provides
a logical summary, with
insufficient detail, of
the real-world business
situation identified in
task 1.
The candidate provides a
logical summary, with
sufficient detail, of the
real-world business
situation identified in
task 1.
CRITERION SCORE :
Approaching Competence
COMMENTS ON THIS CRITERION:
10/7/18 - Financial institutions' use of data is adequately
presented as a real-world
business situation, yet the summary is lacking details
particularly how the business
situation can be addressed by data collection and analysis. One
specific question or
scenario for data analysis could not be located.
For instruction on describing the relevant data collected, please
revisit the section
titled “The Case for Quantitative Analysis” in the study plan for
this course by clicking
29. on the link located in the top left in this rubric item’s
name,“B1. Summary of Data.”
9/22/18 - The submission includes an adequate summary of a
real-world business
situation regarding financial institutions. The provided detail is
insufficient as it is
unclear how this business situation can be addressed by
collecting and analyzing a set
of data, and more specifically a research question is not clearly
identified.
B1. SUMMARY OF DATA
NOT EVIDENT APPROACHING
COMPETENCE
COMPETENT
The candidate does not
provide an appropriate
description of the
relevant data the
candidate collected.
The candidate provides
an appropriate
description, with
insufficient detail, of the
relevant data the
candidate collected, OR
the data is not relevant.
The candidate provides
an appropriate
description, with
30. sufficient detail, of the
relevant data the
candidate collected.
CRITERION SCORE :
Not Evident
COMMENTS ON THIS CRITERION:
10/7/18 - The submission provides financial data as relevant
data for the analysis. It
is unclear whether the described data relates to a relevant
business situation. Please
review this response for alignment to the business situation
once aspect A has been
revised
9/22/18 - The submission provides a limited discussion on
financial data as relevant
data for the analysis. It is unclear whether the described data
relates to a relevant
business situation. Please review this response for alignment to
the business situation
once aspect A has been revised.
B2. GRAPHICAL DISPLAY
NOT EVIDENT APPROACHING
COMPETENCE
COMPETENT
The candidate does not
31. provide a graphical
display of the data
collected.
The candidate provides
an inappropriate and/or
incorrect graphical
display of the data
collected.
The candidate provides
an appropriate and
correct graphical display
of the data collected.
CRITERION SCORE :
Not Evident
COMMENTS ON THIS CRITERION:
10/7/18 - The work provides graphics of processes and
generalized financial
information as a graphical display of the data collected. It is not
clear whether this
graphical display is appropriate,as the relevancy of the data
collected to the business
situation could not be verified. Please review the response to
this aspect after revising
the data collected in aspect B1.
9/22/18 - Two bar graphs are provided as a graphical display. It
is unclear whether
the provided graphical display is appropriate, as the description
of the data collected
in aspect B1 is insufficient.
32. C1. DESCRIPTION OF ANALYSIS TECHNIQUE
NOT EVIDENT APPROACHING
COMPETENCE
COMPETENT
The candidate does not
provide a description of
an appropriate analysis
technique used to
analyze the data.
The candidate provides a
description, with
insufficient detail, of the
analysis technique used
to analyze the data, OR
the analysis technique is
not appropriate and/or
not approved.
The candidate provides a
description, with
sufficient detail, of an
appropriate and
approved analysis
technique used to
analyze the data.
CRITERION SCORE :
Not Evident
COMMENTS ON THIS CRITERION:
33. 10/7/18 - The submission describes several common techniques
in the finance realm
as the data analysis techniques. It is not clear whether this is an
appropriate
technique to be used to analyze the collected data. Please
review this response for
alignment to the data to be collected once aspect B1 has been
revised
9/22/18 - Numerous possible techniques are described.
However, it is unclear
whether any of these techniques is appropriate for data that is
relevant to the
business situation.
C2. OUTPUT AND CALCULATIONS
NOT EVIDENT APPROACHING
COMPETENCE
COMPETENT
The candidate does not
include the output or
any calculations of the
analysis performed.
The candidate includes
incorrect output or
calculations of the
analysis performed.
The candidate includes
34. correct output and any
calculations of the
analysis performed.
CRITERION SCORE :
Not Evident
COMMENTS ON THIS CRITERION:
10/7/18 - The submission provides several examples of how
data could be used in
finance. The output or any calculation from an analytical
analysis is not evident.
9/22/18 - The submission provides a discussion around the use
of data for financial
institutions. The output or any calculation from an analytical
analysis is not evident.
C3. JUSTIFICATION OF ANALYSIS TECHNIQUE
NOT EVIDENT APPROACHING
COMPETENCE
COMPETENT
The candidate does not
provide a logical
justification of why the
analysis technique was
chosen.
The candidate provides a
logical justification, with
insufficient support, of
35. why the analysis
technique was chosen.
The candidate provides a
logical justification, with
sufficient support, of
why the analysis
technique was chosen.
CRITERION SCORE :
Not Evident
COMMENTS ON THIS CRITERION:
10/7/18 - The submission explains a background of mistrust
with financial
institutions. A justification of why a specific analytic technique
was chosen could not
be located.
9/22/18 - The potential benefits from data analysis is described.
A logical justification
for a chosen data analysis technique could not be found.
D1. DATA ANALYSIS RESULTS
NOT EVIDENT APPROACHING
COMPETENCE
COMPETENT
The candidate does not
provide a logical
36. discussion of the results
of the candidate’s data
analysis.
The candidate provides a
logical discussion, with
insufficient detail, of the
results of the candidate’s
data analysis.
The candidate provides a
logical discussion, with
sufficient detail, of the
results of the candidate’s
data analysis.
CRITERION SCORE :
Not Evident
COMMENTS ON THIS CRITERION:
10/7/18 - The submission provides an explanation with a flow
chart for how data
plays a role in management. A discussion of the data analysis
results is not apparent.
9/22/18 - Several techniques are described, including possible
uses for financial
institutions. Results and discussions about the results of an
analytic technique could
not be identified.
D2. DATA ANALYSIS LIMITATIONS
NOT EVIDENT APPROACHING
37. COMPETENCE
COMPETENT
The candidate does not
provide a logical
discussion of the
limitations of the
candidate’s data
analysis.
The candidate provides a
logical discussion, with
insufficient detail, of the
limitations of the
candidate’s data
analysis.
The candidate provides a
logical discussion, with
sufficient detail, of the
limitations of the
candidate’s data
analysis.
CRITERION SCORE :
Not Evident
COMMENTS ON THIS CRITERION:
10/7/18 - The work provides a conclusion on data usage in
business. A discussion of
the limitations of the data analysis could not be found
38. 9/22/18 - Two graphs are sufficiently provided. A discussion on
the limitations on the
attempted analytic technique could not be identified.
D3. RECOMMENDED COURSE OF ACTION
NOT EVIDENT APPROACHING
COMPETENCE
COMPETENT
The candidate does not
provide a plausible
recommendation for a
course of action based
on the candidate’s
results.
The candidate provides a
plausible
recommendation, with
insufficient support, for
a course of action based
on the candidate’s
results.
The candidate provides a
plausible
recommendation, with
sufficient support, for a
course of action based
on the candidate’s
results.
CRITERION SCORE :
39. Not Evident
COMMENTS ON THIS CRITERION:
10/7/18 - The work explains several potentially viable
techniques that could be used.
A discussion of a recommended course of action based on the
analysis results could
not be located.
9/22/18 - A discussion on the variety of ways that data can be
used is noted. A logical
recommendation for action based on the results of an analytic
technique could not be
identified.
E. SOURCES
NOT EVIDENT APPROACHING
COMPETENCE
COMPETENT
There is evidence of
quoted, paraphrased, or
summarized content
without
acknowledgement of
source information. This
level is also appropriate
if task instructions
require the candidate to
quote, paraphrase, or
40. summarize content from
a source to complete the
assessment, and this has
not yet been done.
The candidate provides
required
acknowledgement of
source information for
quoted, paraphrased,
and summarized
content. However, in-
text citations and/or
source information is
incomplete or inaccurate
with respect to author,
date, title, and/or the
location of the
information (e.g.,
publisher, journal, or
website URL).
The candidate provides
source information for
all quoted, paraphrased,
and summarized
content. Source
information appears to
include accurate and
complete
acknowledgement of
source information
regarding the author,
date, title, and location
of the information (e.g.,
publisher, journal, or
41. website URL), as well as
appropriate in-text
citation. This level is
also appropriate if there
is no evidence of
quoted, paraphrased, or
summarized content,
and it is not required by
the instructions.
CRITERION SCORE :
Competent
In this task, you will address the real-world business situation
that you identified in task 1. Using relevant data you have
gathered, analyze the data and recommend a solution. This
recommendation will be included in a report that you will write,
summarizing the key details of your analysis.
Note: You must successfully pass task 1 before work on task 2
is started.
Approved data analysis techniques for this task include the
following:
Recommended Analysis Techniques:
· regression (linear regression, multiple regression, or logistic
regression)
· time series or trend analysis (regression, exponential
smoothing, or moving average)
· chi-square
· t-test
· ANOVA
· crossover analysis
42. · break-even analysis
Additional Approved Analysis Techniques:
· statistical process control
· linear programming
· decision tree
· simulation
Requirements
Create a report (suggested length of 4 written pages) by doing
the following:
A. Summarize the real-world business situation you identified
in task 1.
B. Report the data you collected, relevant to the business
situation, by doing the following:
1. Describe the relevant data you collected.
2. Create an appropriate graphical display (e.g., bar chart,
scatter plot, line chart, or histogram) of the data you collected.
Note: This display should be a summary or representation of
your data, not raw data.
C. Report how you analyzed the data using an analysis
technique from the given list by doing the following:
1. Describe an appropriate analysis technique that you used to
analyze the data.
2. Include the output and any calculations of the analysis you
performed.
Note: The output should include the output from the software
you used to perform the analysis.
3. Justify why you chose this analysis technique.
D. Summarize the implications of your data analysis by doing
43. the following:
1. Discuss the results of your data analysis.
2. Discuss the limitation(s) of your data analysis.
3. Recommend a course of action based on your results.
Note: Your recommendation should focus on the results of your
analytic technique output from part C2.
E. When you use sources to support ideas and elements in a
paper or project, provide acknowledgement of source
information for any content that is quoted, paraphrased, or
summarized. Acknowledgement of source information includes
in-text citation noting specifically where in the submission the
source is used and a corresponding reference, which includes
the following:
· author
· date
· title
· location of information (e.g., publisher, journal, or website
URL)