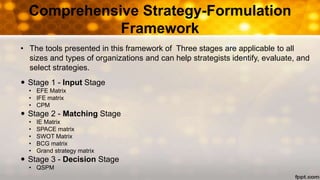
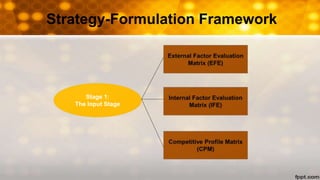
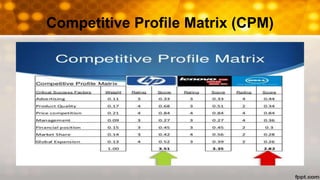
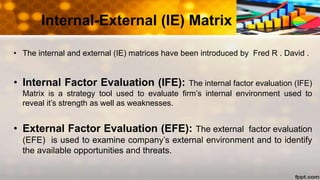
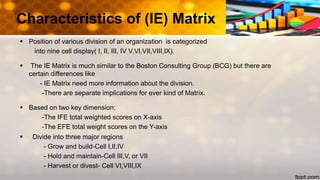
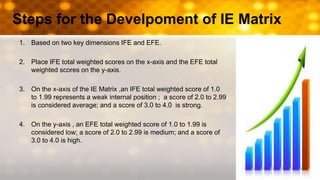
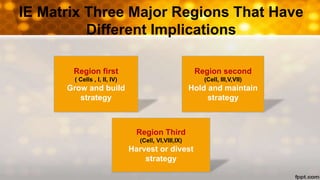
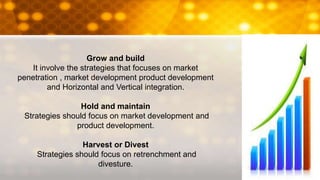
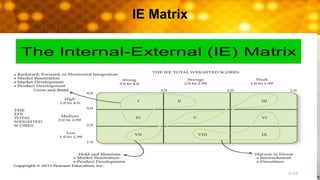
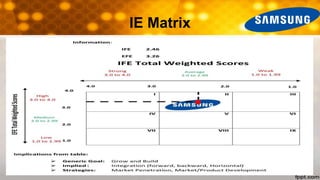
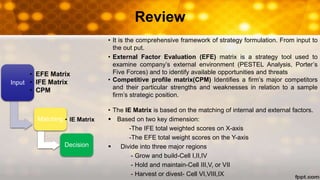
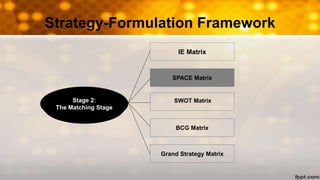
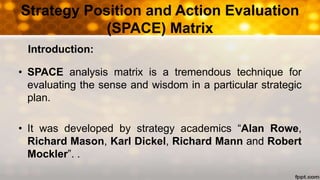
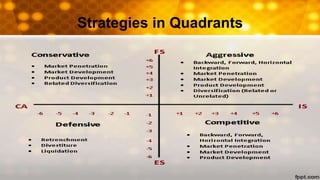
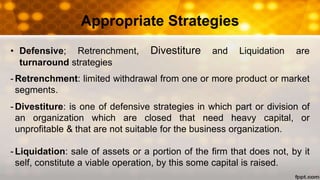
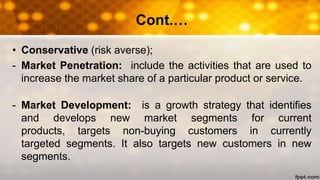
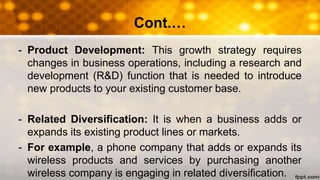
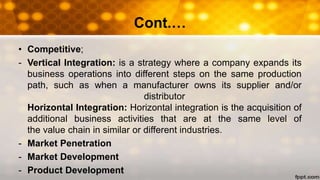
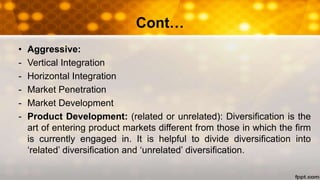
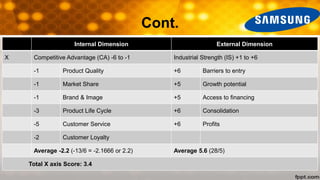
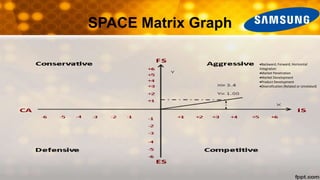
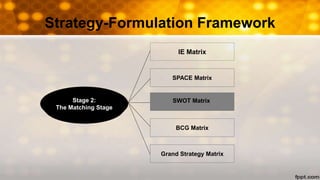
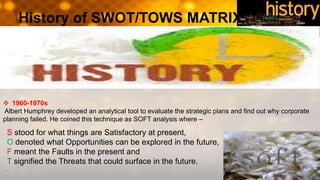
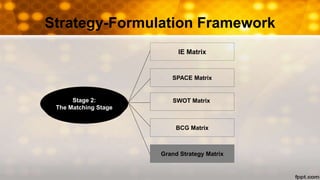
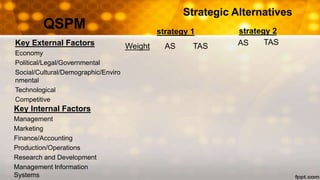
‫السالم‬ ‫عليه‬ ‫ؤمنين‬ُ‫م‬‫ال‬ ‫أمير‬ َ‫ل‬‫ا‬َ‫ق‬ َ‫و‬:ُ‫م‬ْ‫ل‬ِ‫ع‬ْ‫ال‬ٌ‫ة‬َ‫ث‬‫ا‬َ‫ر‬ِ‫و‬
َ‫و‬ ٌ‫ة‬َ‫د‬َّ‫د‬َ‫ج‬ُ‫م‬ ٌ‫ل‬َ‫ل‬ُ‫ح‬ ُ‫اب‬َ‫د‬ ْ‫اْل‬ َ‫و‬ ٌ‫ة‬َ‫م‬‫ي‬ ِ‫ر‬َ‫ك‬ِِ‫ا‬ََ ٌ‫ة‬‫ة‬ ْ‫ر‬ِ‫م‬ ُ‫ر‬ْ‫ك‬ِِْ‫ال‬ٌ‫ة‬َ‫ي‬.
Ameer al-Mu’mineen, peace be upon him,
said: Knowledge is a venerable estate; good manners
are new dresses; and thinking is clear mirror.
G-9
Atta Hussain Syed 2k14/com/26
Sanjay Kumar 2k14/com/93
Ameer Hyder Memon 2k14/com/15
Unsa Soomro 2k14/com/116
Kanwal Soomro 2k14/com/55
Sajjad Burghri 2k14/com/88
Ab Karim Malik 2k14/com/06
Tofique Malak 2k14/com/132
Mahesh Kumar 2k14/com/59
Strategy Analysis and
Change
Chapter Six
Outline
• Introduction
• Formulation Process
• Stage 1
• Stage 2
• Stage 3
Ameer Hyder Memon
2k14/com/15
Introduction to Matrix
• It is a type of organizational management wherein
employees of similar skills are shared for work
assignments.
• It is a structure in which the workforce reports to multiple
managers of different roles.
• It is recognizing that companies have both vertical and
horizontal chains of command, for which matrix model is
created.
Historical background
• • • •
1970s1960s
1990s
Comprehensive Strategy-Formulation
Framework
• The tools presented in this framework of Three stages are applicable to all
sizes and types of organizations and can help strategists identify, evaluate, and
select strategies.
 Stage 1 - Input Stage
• EFE Matrix
• IFE matrix
• CPM
 Stage 2 - Matching Stage
• IE Matrix
• SPACE matrix
• SWOT Matrix
• BCG matrix
• Grand strategy matrix
 Stage 3 - Decision Stage
• QSPM
Strategy-Formulation Framework
Stage 1:
The Input Stage
External Factors Evaluation (EFE) Matrix
• External Factor Evaluation (EFE) matrix is a strategy tool
used to examine company’s external environment
(PESTEL-G, Porter’s Five Forces) and to identify
available opportunities and threats.
PESTEL Analysis
Porter’s Five Forces
Process of EFE matrix
• EFE matrix consists of five steps process.
1. List key external factors: opportunities and threats.
2. Assign weight to each factor (0 to 1.0) sum of all weights = 1.0 the
weight ranges from 0.0 (not important) to 1.0 (very important)
3. Assign 1-4 rating to each factor to indicate how effectively the firm’s
current strategies response to the factor. Where 4 = the response is
superior, 3 = the response is above average, 2 = the response is average,
Where 4 = the response is superior, 3 = the response is above average, 2 =
the response is average, and 1= the response is poor. Rating is based on
effectiveness of the firm’s strategies.
4. Multiply each factor’s weight by its rating.
5. Sum the weighted scores for each factor
Ratings and Weighted
• Highest possible weighted score for the organization is
4.0
• The lowest is 1.0
• The average is 2.5
• A total weighted score of 4.0 indicates that an organization is
responding in a outstanding way to existing opportunities and
threats in its industry.
• A total score of 1.0 indicated that a firm’s strategies are not
capitalizing on opportunities or avoiding external threats.
Samsung EFE Matrix
EFE Matrix Example
Key External Factors Weight Rating
Weighted
Score
Opportunities
A lot of countries encourage technology innovation and
high-tech industry is really important.
0.03 3 0.09
Countries value the protection of intellectual property 0.04 3 0.12
GDP and national income per capita increasing 0.12 3 0.36
Consumption pattern is changing from subsistence
consumption to well spending Pattern
0.07 3 0.21
Samsung’s mobile phones have high attention 0.09 4 0.36
Growing India’s smartphone market 0.05 2 0.10
People more care about brand and quality than price 0.14 3 0.42
Cont..
Key External Factors Weight Rating Weighted Score
Threats
Legal issues with Apple 0.05 3 0.15
Price wars with Chinese phones 0.10 3 0.30
More and more new substitute and
potential entrant
0.10 4 0.4
Strong competitors: Apple, Nokia,
HTC…
0.12 4 0.48
The user experience is upgrading 0.09 3 0.27
Total 1.00 37 3.26
Conclusion
• As per the standards given, Samsung reap following;
1. Samsung’s total weighted score 3.26 it means it has
potential to avoid threats, exploit opportunities in better
way.
2. Earn above average
Toufeeque Malak
2k14/com/132
Internal Factor Evaluation (IFE) Matrix
• Internal Factor Evaluation (IFE) matrix is a strategic
management tool for auditing or evaluating major strengths and
weaknesses in functional areas of a business.
Internal Factor Evaluation (IFE) Matrix
INTERNAL FACTORS
Internal factors are the outcome of detailed internal audit of a firm, every
company have some weak and strong points, therefor the internal factors
are divided into two categories namely strengths and weakness.
Internal Strengths
• Strengths are the strong areas or attribute of the company,
which are used to overcome weakness and capitalize to
take advantage of the external opportunities available in
the industry. The strengths could be tangible or intangible;
such as brand image, financial position, income, human
resource.
Weaknesses
• Weaknesses are the risky areas which needs to be
addressed on priority to minimize its impact. The competitors
always searching for the loop holes in your company and put
their best effort to capitalize on the identified weaknesses.
• IFE matrix also provides a basis for identifying and
evaluating relationships among those areas. The Internal
Factor Evaluation matrix is used in strategy formulation.
• The IFE Matrix together with the EFE matrix is a strategy-
formulation tool that can be utilized to evaluate how a
company is performing in regards to identified internal
strengths and weaknesses of a company.
IFE Matrix
Steps
There are Five steps in making Internal Evaluation Factor
Matrix.
• List key internal factors as identified in the internal-audit
process. Use total of from ten to twenty internal factors,
including both strengths and weaknesses. List strengths
first and then weaknesses. Be as specific as possible,
using percentages, ratios, and comparative numbers.
• Assign a weight that ranges from 0.0 (not important) to 1.0
(all-important) to each factor. The weight assigned to a
given factor indicates the relative importance of the factor
to being successful in the firm's industry. Regardless of
whether a key factor is an internal strength or weakness,
factors considered to have the greatest effect on
organizational performance should be assigned the highest
weights. The sum of all weights must equal 1.0
• Assign a 1-to-4 rating to each factor to indicate whether
that factor represents a major weakness (rating = 1), a
minor weakness (rating = 2), a minor strength (rating = 3),
or a major strength (rating = 4). Note that strengths must
receive a 4 or 3 rating and weaknesses must receive a 1 or
2 rating. Ratings are, thus, company based, whereas the
weights in Step 2 are industry based.
4. Multiply each factor's weight by its rating to determine a
weighted score for each variable.
5. Sum the weighted scores for each variable to determine
the total weighted score for the organization
• Regardless of how many factors are included in an IFE
Matrix, the total weighted score can range from a low of
1.0 to a high of 4.0, with the average score being 2.5.
Total weighted scores well below 2.5 characterize
organizations that are weak internally, whereas scores
significantly above 2.5 indicate a strong internal position.
• The number of factors has no effect upon the range of
total weighted scores because the weights always sum to
1.0
Samsung IFE Matrix
IFE Matrix Example
Key Internal Factors Weight Rating
Weighted
Score
Strengths
Brand Recognition and Loyalty 0.07 3 0.21
A large number of products and broad product line 0.05 4 0.20
Strong research and development ability 0.10 3 0.30
Hardware integration with many open source OS and software 0.04 2 0.08
Innovation and fashion design, especially popular among younger
peoples
0.15 4 0.60
With extensive sales channels and propaganda 0.06 3 0.18
Low production costs 0.03 3 0.09
Largest share in Smartphone industry ( 30% market share
worldwide, extending its lead over Apple and Nokia)
0.15 4 0.60
Cont..
Key Internal Factors Weight Rating
Weighted
Score
Weaknesses
Not high lighting Price/Performance Ratio. 0.10 4 0.40
Lack its own OS and Software 0.07 4 0.28
Patent infringement 0.04 3 0.12
Too low profit margin 0.04 2 0.08
Limited high-end products 0.03 2 0.06
Focus on too many products, with inaccurate positioning 0.07 3 0.21
Total 1.00 44 3.41
Mahesh Kumar
2k14/com/59
Competitive profile matrix(CPM)
• Identifies a firm’s major competitors and
their particular strengths and weaknesses
in relation to a sample firm’s strategic
position.
Strengths
• Resources and capabilities that it possesses that enable it to engage in
activities that generate economic value and some times competitive
advantage.
• It is important to have strength so no one can ever take anything from you
ever again as this is vital for success in life.
• Example:- Microsoft has ability to write application software.
Disney has strength in creating entertainment markets
Weaknesses
• Are firms resources and capabilities that either make it difficult to
realize the economic value of a firm’s strengths or actually reduce
a firm’s economic value.
• Example:- US Air’s high cost of labor id weakness
McDonalds faces huge loss in India
Opportunities
• Chance for a firm to improve its competitive position and
performance.
• Opportunities come in all different sizes, from hardly
noticeable ones, to life-changing ones.
• Example:-A big sporting event for an energy drink’s
producers: a large sporting event would be a great place
for an energy drink producer to advertise, and sponsor
athletes.
Threats
• Are any individual groups, or organization outside a firms that seeks to
reduce the level of the firm’s performance .
• Every firms faces threats in its comitatives .
Ratings Scale
• If rating scales are 4, than
• 1-4 is major weakness
• 2-4 is minor weakness
• 3-4 is minor strength
• 4-4 is major strength
Competitive Profile Matrix (CPM)
Factors for analysis
• Effectiveness of distribution channels
• Patent advantages
• Location of facilities
• Production capacity and efficiency
• Experience
• Union relations
• Technological advantages
• E-commerce expertise
Effectiveness of distribution channels
 Direct marketing: where the goods are sold directly from the product direct
to the customer.
 Wholesaler: A wholesaler is normally an intermediary between the
producer and the retailer.
 Agents/Brokers: Agents and brokers are
intermediaries between the producer and the wholesaler
and/or retailer.
 Retailers: A retailer is an intermediary, which buys
products either from manufacturers or
from wholesalers and resells them to consumers
Patent Advantage
• A patent gives you the right to stop others from
copying, manufacturing, selling or importing your
invention without your permission.
Location of Facilities
Production Capacity
• is the volume of products or services that can be
produced by an enterprise using current resources.
Experience
• the process or fact of personally observing,
encountering, undergoing something.
• practical contact with and observation of facts or
events.
Union Relations
• Industrial Unions
• Public Sector Unions
• Labor unions
Technological Advantage
• Are ways of develop our lives, because the technology
help us with different king of work.
Ecommerce Expertise
• help save you money and satisfy your valued customers,
we also have established meaningful partnerships that
can benefit your business, from shopping carts, to call
centers, to dependable shipping carriers.
Kanwal Soomro
2k14/com/55
Strategy-Formulation Framework
IE Matrix
SPACE Matrix
SWOT Matrix
BCG Matrix
Grand Strategy Matrix
Stage 2:
The Matching Stage
• The internal and external (IE) matrices have been introduced by Fred R . David .
• Internal Factor Evaluation (IFE): The internal factor evaluation (IFE)
Matrix is a strategy tool used to evaluate firm’s internal environment used to
reveal it’s strength as well as weaknesses.
• External Factor Evaluation (EFE): The external factor evaluation
(EFE) is used to examine company’s external environment and to identify
the available opportunities and threats.
Internal-External (IE) Matrix
 Position of various division of an organization is categorized
into nine cell display( I, II, III, IV V,VI,VII,VIII,IX).
 The IE Matrix is much similar to the Boston Consulting Group (BCG) but there are
certain differences like
- IE Matrix need more information about the division.
-There are separate implications for ever kind of Matrix.
 Based on two key dimension:
-The IFE total weighted scores on X-axis
-The EFE total weight scores on the Y-axis
 Divide into three major regions
- Grow and build-Cell I,II,IV
- Hold and maintain-Cell III,V, or VII
- Harvest or divest- Cell VI,VIII,IX
Characteristics of (IE) Matrix
Steps for the Develpoment of IE Matrix
1. Based on two key dimensions IFE and EFE.
2. Place IFE total weighted scores on the x-axis and the EFE total
weighted scores on the y-axis.
3. On the x-axis of the IE Matrix ,an IFE total weighted score of 1.0
to 1.99 represents a weak internal position ; a score of 2.0 to 2.99
is considered average; and a score of 3.0 to 4.0 is strong.
4. On the y-axis , an EFE total weighted score of 1.0 to 1.99 is
considered low; a score of 2.0 to 2.99 is medium; and a score of
3.0 to 4.0 is high.
IE Matrix Three Major Regions That Have
Different Implications
Region first
( Cells , I, II, IV)
Grow and build
strategy
Region Third
(Cell, VI,VIII,IX)
Harvest or divest
strategy
Region second
(Cell, III,V,VII)
Hold and maintain
strategy
Grow and build
It involve the strategies that focuses on market
penetration , market development product development
and Horizontal and Vertical integration.
Hold and maintain
Strategies should focus on market development and
product development.
Harvest or Divest
Strategies should focus on retrenchment and
divesture.
IE Matrix
Benefits of IE Matrix:
• Easy to understand .The input have a clear meaning to every one inside or
outside of the company.
• Easy to use . The matrix do not require extensive expertise.
• Focusing on key external and internal factors(the IFE and EFE only highlight
the key factors that are affecting a company or its strategy).
• It is used for multiple purpose such as used to build SWOT Analysis and
benchmarking.
Limitations of IE Matrix
• Easily replaced.IFE and EFE Matrix can be replaced by competitive profile
matrix , BCG matrix SPACE matrix and also SWOT matrix.
• Doesn’t directly help in formation. Both analysis only identify and evaluate
the factors but do not help the company directly in determining the next
strategic move or the best strategy.
• Too broad factors .SWOT matrix has the same limitation and it has same
means the some factors that are not specific enough can be confused with
each other.
Samsung IE Matrix
IE Matrix
Atta Hussain Syed
2k14/com/26
Review
Input
• EFE Matrix
• IFE Matrix
• CPM
Matching • IE Matrix
Decision
• It is the comprehensive framework of strategy formulation. From input to
the out put.
• External Factor Evaluation (EFE) matrix is a strategy tool used to
examine company’s external environment (PESTEL Analysis, Porter’s
Five Forces) and to identify available opportunities and threats
• Competitive profile matrix(CPM) Identifies a firm’s major competitors
and their particular strengths and weaknesses in relation to a sample
firm’s strategic position.
• The IE Matrix is based on the matching of internal and external factors.
 Based on two key dimension:
-The IFE total weighted scores on X-axis
-The EFE total weight scores on the Y-axis
 Divide into three major regions
- Grow and build-Cell I,II,IV
- Hold and maintain-Cell III,V, or VII
- Harvest or divest- Cell VI,VIII,IX
Glossary
• Aggressive: Willing to accept calculated risk of greater
than average loss in quest of greater than average returns,
without gambling on random chance.
• Conservative: is an investing strategy that seeks to
preserve an investment portfolio's value by investing in
lower risk securities such as fixed-income and money
market securities, and often blue-chip or large-cap equities.
Glossary
• Defensive: A management approach designed to reduce
the risk of loss. defensive strategy when it comes to
investing its extra liquid funds in certificates of deposit or
relatively stable bonds and stocks.
• Competitive: Good, service, or offer that can hold its own
against competing products because it offers an attractive
value for money proposition to its buyers.
Strategy-Formulation Framework
IE Matrix
SPACE Matrix
SWOT Matrix
BCG Matrix
Grand Strategy Matrix
Stage 2:
The Matching Stage
Strategy Position and Action Evaluation
(SPACE) Matrix
• SPACE analysis matrix is a tremendous technique for
evaluating the sense and wisdom in a particular strategic
plan.
• It was developed by strategy academics “Alan Rowe,
Richard Mason, Karl Dickel, Richard Mann and Robert
Mockler”. .
Introduction:
Significance
• The most important concern of most of the organizations is for guaranteed in complex
environmental changes. Strategic planning provides some tools for the organizations to
follow the formulation of the strategy in various aspects of the organization and manage their
strategic performance
• SPACE matrix is a strategic management tool that focuses on strategy formulation especially
as related to the
• Strategy models provide a common focus point for discussion. The best strategies come of
from the insight of applying the strategy tools and the discussions that happen within the
management team and not of using the planning model.
• You can see a set of conditions or even a particular symptom and you can relate it back to
the rest of the strategy model to understand more about what is happening at the moment,
what is happening and perhaps what will happen
• Financial Strength
(FS)
SPACE Dimensions
• The SPACE Matrix is a relatively easy to understand and use
method as a decision aid. It uses two internal dimensions , two
external dimensions.
• By combining ratings on each dimension on one SPACE matrix
diagram, the framework guides the strategic agenda
• Competitive
Advantage (CA)
• Industrial Strength
(IS)
• Environmental
Stability (ES)
Financial Position/Strength Competitive Position/Strength
Return on Investment (ROI) Market Share
Leverage Product Quality
Liquidity Product Life Cycle
Working Capital Customer Loyalty
Cash Flow Resources Utilization
Earning per Share Technology Know-how
Price Earning Ratio Control over suppliers and distributors
Internal Dimension
External Dimension
Industrial Position/Strength Environmental Position/Strength
Profit Potential Technological Changes
Financial Stability Inflation Rates
Extent Leveraged Demand Variability
Growth Potential Barriers to entry into market
Resources Utilization Competitive Pressure
Productivity
• The SPACE matrix focuses on strategy formulation especially as
related to the competitive position of an organization.
• The SPACE matrix is broken down to four quadrants where each
quadrant suggests a different type of a strategy depending on
which quadrant the outcome of the analysis places the
organization. The strategy types are:
1. Aggressive
2. Conservative
3. Defensive
4. Competitive
Strategic Position & Action Evaluation
Matrix
Dimensions & Strategies in SPACE Matrix
Defensive Conservative Competitive Aggressive
Strategy Postures
Dimensions
Unstable Stable Unstable Stable
Environmental Strength
(ES)
Unattractive Attractive Unattractive Attractive Industrial Strength (IS)
Weak Weak Strong Strong
Competitive Advantage
(CA)
Weak High Weak High Financial Strength (FS)
SPACE Matrix Quadrants
Internal Dimension
External Dimension
SPACE Quadrants
Strategies in Quadrants
• Defensive; Retrenchment, Divestiture and Liquidation are
turnaround strategies
- Retrenchment: limited withdrawal from one or more product or market
segments.
- Divestiture: is one of defensive strategies in which part or division of
an organization which are closed that need heavy capital, or
unprofitable & that are not suitable for the business organization.
- Liquidation: sale of assets or a portion of the firm that does not, by it
self, constitute a viable operation, by this some capital is raised.
Appropriate Strategies
• Conservative (risk averse);
- Market Penetration: include the activities that are used to
increase the market share of a particular product or service.
- Market Development: is a growth strategy that identifies
and develops new market segments for current
products, targets non-buying customers in currently
targeted segments. It also targets new customers in new
segments.
Cont.…
Cont.…
- Product Development: This growth strategy requires
changes in business operations, including a research and
development (R&D) function that is needed to introduce
new products to your existing customer base.
- Related Diversification: It is when a business adds or
expands its existing product lines or markets.
- For example, a phone company that adds or expands its
wireless products and services by purchasing another
wireless company is engaging in related diversification.
Cont.…
• Competitive;
- Vertical Integration: is a strategy where a company expands its
business operations into different steps on the same production
path, such as when a manufacturer owns its supplier and/or
distributor
Horizontal Integration: Horizontal integration is the acquisition of
additional business activities that are at the same level of
the value chain in similar or different industries.
- Market Penetration
- Market Development
- Product Development
Cont…
• Aggressive:
- Vertical Integration
- Horizontal Integration
- Market Penetration
- Market Development
- Product Development: (related or unrelated): Diversification is the
art of entering product markets different from those in which the firm
is currently engaged in. It is helpful to divide diversification into
‘related’ diversification and ‘unrelated’ diversification.
How to Construct SPACE Matrix
• The SPACE matrix is constructed by plotting calculated
values for competitive advantage (CA) and industry
strength (IS) dimensions on the X axis.
• The Y axis is based on the environmental stability (ES)
and financial strength (FS) dimensions.
1. Choose variables of CA, IS, ES, and FS.
2. Rate individual factors to each dimension, rate CA and ES using rating scale from
-6 (worst) to -1 (best). Rate IS and FS from +1 (worst) to +6 (best).
3. Find the average scores for CA, IS, ES, and FS.
4. Plot values from step 3 for each dimension on the SPACE matrix on appropriate
axis.
5. Add the average score for CA, and IS dimensions. This will be final point on X axis
on the SPACE Matrix.
6. Add the average score for the SPACE matrix ES and FS dimensions to find your
final point on the axis Y.
7. Find intersection of your X and Y points. Draw a line from the center of the
SPACE matrix to your point. This line reveals the type of strategy the company
should pursue.
Steps
Samsung SPACE Matrix
Internal Dimension External Dimension
Y Financial Strength (FS) +1 to +6 Environmental Stability (ES) -6 ton-1
+3 Earning per share -2 Price of competitive product
+5 Revenue increase -4 Competitive pressure
+4 Return on Assets -4 Global economic
+4 Leverage -2 Technology changes
+3 Liquidity -2 Demand elasticity
+3 Cash flows -2 Inflation rate
Average 3.7 (22/6= 3.6666 or 3.7) Average - 2.7 (-16/6 = 2.6666 or 2.7)
Total Y axis score: 1.00 (3.7 – 2.7 )
Cont.
Internal Dimension External Dimension
X Competitive Advantage (CA) -6 to -1 Industrial Strength (IS) +1 to +6
-1 Product Quality +6 Barriers to entry
-1 Market Share +5 Growth potential
-1 Brand & Image +5 Access to financing
-3 Product Life Cycle +6 Consolidation
-5 Customer Service +6 Profits
-2 Customer Loyalty
Average -2.2 (-13/6 = -2.1666 or 2.2) Average 5.6 (28/5)
Total X axis Score: 3.4
SPACE Matrix Graph
Backward, Forward, Horizontal
Integration
Market Penetration
Market Development
Product Development
Diversification (Related or Unrelated)
Finished!
That is all for Today
Ask Question ?
for Increase my Knowledge
Unsa Soomro
2k14-com-116
Strategy-Formulation Framework
IE Matrix
SPACE Matrix
SWOT Matrix
BCG Matrix
Grand Strategy Matrix
Stage 2:
The Matching Stage
History of SWOT/TOWS MATRIX
S stood for what things are Satisfactory at present,
O denoted what Opportunities can be explored in the future,
F meant the Faults in the present and
T signified the Threats that could surface in the future.
.
 1960-1970s
Albert Humphrey developed an analytical tool to evaluate the strategic plans and find out why corporate
planning failed. He coined this technique as SOFT analysis where –
Continue..
 1964:
In the seminar held in Zurich by Urick and Orr proposed the concept of SWOT
analysis which was derived from SOFT by replacing the F for faults with W for
Weaknesses. With its initial promotion in the Britain, the concept soon gained
recognition among strategic planners and management consultants the world
over
Continue..
TOWS is developed by the American international business professor Heinz
Weirich
The TOWS Matrix is derived from the SWOT Analysis model, which stands for
the internal Strengths and Weaknesses of an organisation and the external
Opportunities and Threats that the business is confronted with
SWOT and TOWS use the same factors for analysis. SWOT and TOWS are
used interchangeably without regard to the order that strengths, weaknesses,
threats and opportunities are examined. The only difference between them is
order nothing else.
SWOT/TOWS MATRIX
 Swot analysis is a strategic planning method used
to evaluate the internal (strengths and
weaknesses)and external factors(Opportunities
and threats)that are favourable and unfavourable
to achieve the objects in a business or a project.
 It is conceptual framework for a systematic
analysis that facilitates matching the external
threats and opportunities with the internal
weaknesses and strengths of the organisation.
 It is a matching stage as it compares internal
environment with external environment.
Strength and weaknesses
• Strength: Characteristics of the business or team that give it an advantage over
others in the industry
Example: Established brand name
• Lower production costs
• Superior management
• Excellent marketing skills
• Weaknesses:
Detract the organization from its ability to attain the core goal and influence its growth.
Example: Higher production costs
• Obsolete or Out-of-date products/technology
• Poor market image
• Poor marketing skills
Opportunities And threats
 Strength: Condition of the environment that benefits the organization in planning
and executing strategies that enable it to become more profitable
Example:
• Decline in demand for a substitute product
• Changing customer needs/tastes
• New uses discovered for existing product
• Threats: External elements in the environment that could cause trouble for the
business. Introduction of new substitute products
Example:
• Decline in product life cycle
• Changing customer needs/tastes
Alternative strategies of tows matrix
. The TOWS MATRIX helps to identify the strategic alternatives for a company that works as a matching tool by
constructing four types of strategies such as
1.WT strategy
2. WO strategy
3. ST strategy
4.SO strategy
WT strategy AND WO Strategy
1. WT Strategy: It aims to minimize both weakness and threats
and maybe called as mini-mini strategy. Min-min strategy
Example: weak distribution network creating many problems for
the firm if it strong many external threats can be removed.
2. WO Strategy: Attempts to minimize the weaknesses and
maximize opportunities. Min-Max strategy.
Example: the firm is in the critical financial problems that is
weakness and firm is availing merger with Multinational
Corporation is an opportunity
ST Strategy and SO Strategy
3.ST strategy: it is based on using organisation’s strengths to deal with threats in
the environment. The aim is to maximize the former while mini maximizing latter.
Defensive strategy.
For Example: In a case with an organization that possess good quality of products but is
facing threats against competitors who offers low priced products can adopt ST strategy
by mass production of the products, therefore it will reduce the unit cost of production.
4. SO Strategy:
This is also known as Maxi –Maxi Strategy where a firm utilizes most of its internal
strengths in order to grab the right external opportunities. Attacking strategies.
For Example: A firm whose financial position is quite strong and posses low market
share is able to introduce many innovative products in the market by making investment
in the Research & development Department of the firm.
Steps necessary for constructing tows
matrix
 Steps for developing strategies:
• There are eight steps involved in constructing a TOWS Matrix:
1. Rank external opportunities
2. Rank external threats
3. Rank internal strength
4. Rank internal weaknesses.
5. Match internal strengths with external opportunities and mention the result in the SO Strategies cell.
6. Match internal weaknesses with external opportunities and mention the result in the WO Strategies
cell.
7. Match internal strengths with external threats and mention the result in the ST Strategies cell.
8. Match internal weaknesses with external threats and mention the result in the WT strategies cell.
Who need Swot Analysis?
• SWOT Analysis is useful for various aspects from the perspective of the following
Continue…
1.job holder:
When his supervisor has issues with work output, When he is assigned to a
new job
2. Business Unit:
When the customer service needs to be improved, When launching a new
business unit to pursue a new business
3. Company:
When revenue, cost and expense and targets are not being achieved ,When
the market share is declining, When the industry conditions are unfavorable
Limitations
• Does not show how to achieve a competitive advantage,
so it must not be an end in itself.
• Provides a static/inactive (i.e. Snapshot) assessment in
time. In other words, it is like a single frame of a motion
picture.
• May lead the firm to overemphasize a single internal or
external factor in formulating strategies
Abdul Karim Malak
2k14-com-06
Strategy-Formulation Framework
IE Matrix
SPACE Matrix
SWOT Matrix
BCG Matrix
Grand Strategy Matrix
Stage 2:
The Matching Stage
Boston Consulting Group Matrix:
• The Boston Consulting Group (BCG) is a management consulting
firm founded by Harvard Business School Alum Bruce Henderson
in 1963.
• The BCG Matrix is used for the evaluation of the organization's
product portfolio in marketing and sales planning. It aims to evaluate
each product.
• The growth-share matrix is a chart created to help corporation
analyze their business units or product lines, and decide where to
allocate cash.
• Market Growth: An increase in the demand of a product or
service in the market is termed as Market Growth. When company
tries to expand, it expects markets to grow. For this, companies
try to increase the perceived value, product features, competitive
prices etc.
• Market Share: Market share represents the percentage of an
industry or market's total sales that is earned by a particular
company over a specified time period. Market share is calculated
by taking the company's sales over the period and dividing it by
the total sales of the industry over the same period.
Boston Consulting Group Matrix:
It is categorized into four types for the purpose of taking decisions:
A- Question Marks
B- Stars
C- Cash Cows
d- Dogs
Question Marks:
• Question Marks (sometimes called “problem children” or “wildcats”)
are new products with the potential for success, but they need a lot
of cash for development.
• Units with low market share in a fast-growing industry are known as
question marks. Such business units require large amounts of cash
to grow their market share.
• In PLC Question mark is termed as Introduction stage
• For Examples:
MacBook (Laptops) of Apple company.
Stars
• Stars represent business units having large market share in a fast
growing industry.
• Stars are market leaders that are typically at the peak of their
product life cycle and are able to generate enough cash to maintain
their high share of the market and usually contribute to the
company’s profits.
• In Star category product having high growth rate and high market
share.
• Star category is depicted in PLC as Growth stage.
• For Example:
I-Phone of Apple Company.
Cash Cows
• Cash cows typically bring in far more money than is needed to
maintain their market share.
• Cash Cows is the part of business that always makes a profit and
that provides money for the rest of business.
• Cash cows require little investment and generate cash that can be
utilized for investment in other business units.
• In Cash Cow product having high market share and low market
growth
• For Example:
I-Pad of Apple.
Dogs
• Dogs represent businesses having weak market shares in low-growth
markets. They neither generate cash nor require huge amount of cash.
Due to low market share, these business units face cost
disadvantages.
• In PLC Dogs category is known as decline stage.
• It shows that the product having low market share and low market
growth.
• For example: I-Pods of Apple
Advantages of BCG Matrix:
• Clear guidance is provided for each quadrant in terms of the approach
to investment and support of business units .
• The growth-share matrix is a chart created to help corporation
analyze their business units or product lines, and decide where to
allocate cash.
• Although the matrix is developed based upon historical/current position,
the four quadrants of the BCG matrix provide some strategic guidance
for the future.
Sanjay Kumar
2k14-com-93
Strategy-Formulation Framework
IE Matrix
SPACE Matrix
SWOT Matrix
BCG Matrix
Grand Strategy Matrix
Stage 2:
The Matching Stage
Basic terminology
• Grand strategy: The Grand Strategies are the
corporate level strategies designed to identify the
firm’s choice with respect to the direction it follows
to accomplish its set objectives Matrix is a set of
numbers laid out in tabular form (in rows and
columns).
• Market Growth: The expansion of market
share by a company, brand or product, as
measured by units sold or revenue, achieved
through
increased consumer demand or competitive
advantages
Basic Terminology
• Competitive position; The concept of competitive
position was given by Jack Trout in 1981. It is the position
that a firm has already acquired or is trying to acquire,
relative to its competitor. A competitive position gives a firm
an advantage over its competitors, thus allowing it to
retain/attract more customers, gain mindshare of customers
and market share etc
Grand Strategy Matrix
• History 1: The basic concept of Grand Strategy
was given Sir Basil Henry Liddell Hart. He is a
English soldier, military historian and military
theorist.
• History 2: The concept of Grand Strategy Matrix
was given by Roland Christensen , Norman Berg,
and Malcolm in the article of Policy formulation and
Administration . It is Published By Richard D Irwin
in 1976
Grand Strategy Matrix
• Definition: It is a very useful instrument for
creating different and alternative strategies for an
organization . It has four quadrant , each quadrant
contains different set of strategies and the entire
firms along with their respective division must
fall in one of the quadrant
1st Quadrant
• The first quadrant of Grand Strategy Matrix indicates that the organization has
strong competitive position & there is rapid growth rate in the market. The
organization that lies in the first quadrant has the excellent strategic position .
The organization of the first quadrant should concentrate on the current market
and need to adopt the strategies.
• Those company which lay on first quadrant they focus on following strategy.
• Market development
• Market Penetration
• Product development
• Forward Integration
• Backward Integration
• Horizontal Integration
• Concentric Diversification
1st Quadrant Strategy
• Market development The concept of market development was
given by Igor Ansoff in Ansoff Matrix in 1957. The Market
development defined as the selling of existing product in new
market or geographical location. Market development increase by
New areas or regions about of the country and foreign market.
• Market Penetration The concept was given by Igor Ansoff in 1957.
Increase market share for present product or service in present markets
through greater market efforts is called market penetration. Market
penetration increase by decreasing product price and increasing in
promotion and distribution support.
1st Quadrant strategy
• Product development The concept was given by Igor Ansoff in
Harvard Business review To increase sell of new products, with
new or altered features, to existing markets is called Product
development. It happen by new ideas and invest in research and
development of additional product.
• Forward Integration A strategy that involves gaining ownership
or increased control over distribution or retailers, such as a
manufacturer opening its own chain. When an organization is
earning high profit because of stable production. It also affect
product prize and competitive advantage
1st Quadrant Strategy
• Backward Integration A strategy seeking ownership or increased control of a
firm’s supplier such as a manufacturer acquiring its raw material source firms
• Horizontal Integration It is the process of a company increasing production of
goods or services by combining similar firm to increase market share and profit.
• Concentric diversification Concentric diversification involves adding new
products or services that are related to your current offerings. they appeal to the
same market or because they can be offered without much investment in new
resources (or both) . This means that there is a technological similarity between the
industries. Example : If a company produce table linens and also might start
making curtain.
2nd Quadrant strategy
• The second quadrant highlights that the organization has weak competitive situation and there
is fast market growth. The organization that lies in the second quadrant should evaluate its
current strategy for the marketplace seriously. Although there is growing industry but the
organization is not able to compete effectively. The organization of second quadrant should find
out the reason that why its current strategies are not effective enough to make it competitive in
the market. Moreover the organization should also try to find out the best way of change that
can improve its effectiveness.
Those company which lay on second quadrant they focus on following strategy.
• Market development
• Market Penetration
• Product development
• Horizontal Integration
• Divestiture
• Liquidation
2nd Quadrant strategy
• Divestiture; is one of the strategies in which part or division of an
organization is sold Business organization are closed that need heavy capital,
are unprofitable & that are not suitable with the other activities of the business
organization.
• Liquidation is the selling of all the assets of the organization in order to cash
their tangible worth.
3rd Quadrant Strategy
• The third quadrant of the Grand Strategy Matrix specifies that the organization has the weak competitive
situation and the market growth rate is quite slow. The organization that lies in the third quadrant competes in
the industry of slow growth and holds weak competitive position. The organization should seriously adopt
certain drastic changes that can minimize further demise and the resulting liquidation. It is better option for the
organization that it should adopt extensive asset & cost reduction. There is another suitable option that the
organization should keep resources away from the current declining business & put those resources into other
diversified areas. Even if all other diversified projects failed then there is last option for the organization to be
liquidate itself.
Those company which lay on third quadrant they focus on following strategy.
• Retrenchment
• Concentric diversification
• Horizontal diversification
• Conglomerate diversification
• Divestiture
• Liquidation
3rd Quadrant strategy
• Retrenchment The word retrenchment is derived from French word
‘retrancher’ which means to cut down. When a firm decide to eliminate its activities
through reduction in business operation, cost ,customer group, customer function and
technology alternative is retrenchment strategy. When a company’s sales and profit
become reduced then defense our self by reducing number of employee and
controlled business expenses in effectively manner.
Example ; In September 2011 Nokia company cuts 4,000 job due decrease 21%in sales
in amounts it is $1.4billion in a quarter
3rd Quadrant Strategy
• Horizontal Diversification; When a company adding new, unrelated product or service for
existing customer is Horizontal diversification . In this technology dissimilarity in the industry .
Example: A company that was making notebooks earlier may also enter the pen market with its new product.
• Conglomerate Diversification; Conglomerate diversification is one type of diversification in which
new products, new markets, new technologies or new market functions introduce which is not related to the existing
business.
Example: A company which deal with automotive repair parts may enter the toy production industry
4th quadrant strategy
• The fourth quadrant of highlights that the organization has strong competitive
situation and the market growth rate is slow. The organization that lies in the fourth
quadrant has strong competitive position but the industry in which the organization
relates has slow growth. The organization can have suitable option o initiate
diversified programs into other growth areas.
Those company which lay on fourth quadrant they focus on following strategy.
• Concentric Diversification
• Horizontal Diversification
• Conglomerate
• Diversification
• Joint Venture
4th Quadrant Strategy
• Diversification; Diversification strategy takes place, for extending product line by
new product and operating in different new market. According Warren Buffet
“Diversification is protection against ignorance, it makes little sense for those who
know what they’re doing.”
• Joint venture ; A joint venture (JV) is a business entity created by two or more parties,
generally characterized by shared ownership, shared returns and risks, and shared
governance. The Purpose of Joint venture to share risk for major investments or
projects and to access a new market. In Pakistan on 2011 Pak Suzuki motor company
limited was formed as a joint venture between Pakistan automobile corporation and
Suzuki motor corporation.
Example No 1
Example No 2
Example No 3
Sajjad Burghri
2k14-com-88
Strategy-Formulation Analytical
Framework
Stage 3:
The Decision Stage
Quantitative Strategic
Planning Matrix
(QSPM)
Quantitative Strategic Planning Matrix
• QSPM is a high-level strategic management
approach for evaluating possible strategies
• QSPM provides an analytical method for
comparing feasible alternative action
Why go for QSPM
• . QSPM attempts to objectively select the best strategy using input
from other management techniques and some easy techniques.
• The QSPM uses input from stage 1 analyses match them with
result from stage 2 analyses, and then decides objectively among
alternative strategy
Steps to Develop a QSPM
1. the overall strategic management analyses is used to identify key strategic management
factors. This can be done through EFE & IFE matrix
2. Assign weights to each key external and internal factor
3. Examine the Stage 2 (matching) matrices, and identify alternative strategies that the
organization should consider implementing Determine the Attractiveness Scores.
The range for AS is
i. 1 = not attractive,
ii. 2 = somewhat attractive,
iii. 3 = reasonably attractive, and
iv. 4 = highly attractive.
Cont.
5. Compute the Total Attractiveness Scores
Total attractiveness Scores (TAS) are defined as the product of multiplying the
weights (Step 2) by the AS (Step 4) in each row.
6. Compute the Sum Total Attractiveness Score
Add TAS in each strategy column of the QSPM. the Sum Total Attractiveness
Scores (STAS) reveal which strategy is most attractive in each set of alternatives.
Higher scores indicate more attractive strategies
strategy 2
Strategic Alternatives
QSPM
Key Internal Factors
Management
Marketing
Finance/Accounting
Production/Operations
Research and Development
Management Information
Systems
TASASAS TASWeightKey External Factors
Economy
Political/Legal/Governmental
Social/Cultural/Demographic/Enviro
nmental
Technological
Competitive
strategy 1
Pros and Cons of QSPM
Advantages
 Sets of strategies considered
simultaneously or
sequentially
 Integration of pertinent
external & internal factors in
the decision-making process
• Requires intuitive judgments &
educated assumptions
• Only as good as the
prerequisite inputs
• Only strategies within a given
set are evaluated relative to
each other
Disadvantages
Thank You 😊
for
Your Valuable Time 🕐
Ask Question to Increase Our Knowledge 📚
?

Strategy analysis and change- Matrix

  • 3.
    ‫السالم‬ ‫عليه‬ ‫ؤمنين‬ُ‫م‬‫ال‬‫أمير‬ َ‫ل‬‫ا‬َ‫ق‬ َ‫و‬:ُ‫م‬ْ‫ل‬ِ‫ع‬ْ‫ال‬ٌ‫ة‬َ‫ث‬‫ا‬َ‫ر‬ِ‫و‬ َ‫و‬ ٌ‫ة‬َ‫د‬َّ‫د‬َ‫ج‬ُ‫م‬ ٌ‫ل‬َ‫ل‬ُ‫ح‬ ُ‫اب‬َ‫د‬ ْ‫اْل‬ َ‫و‬ ٌ‫ة‬َ‫م‬‫ي‬ ِ‫ر‬َ‫ك‬ِِ‫ا‬ََ ٌ‫ة‬‫ة‬ ْ‫ر‬ِ‫م‬ ُ‫ر‬ْ‫ك‬ِِْ‫ال‬ٌ‫ة‬َ‫ي‬. Ameer al-Mu’mineen, peace be upon him, said: Knowledge is a venerable estate; good manners are new dresses; and thinking is clear mirror.
  • 4.
    G-9 Atta Hussain Syed2k14/com/26 Sanjay Kumar 2k14/com/93 Ameer Hyder Memon 2k14/com/15 Unsa Soomro 2k14/com/116 Kanwal Soomro 2k14/com/55 Sajjad Burghri 2k14/com/88 Ab Karim Malik 2k14/com/06 Tofique Malak 2k14/com/132 Mahesh Kumar 2k14/com/59
  • 5.
  • 6.
    Outline • Introduction • FormulationProcess • Stage 1 • Stage 2 • Stage 3
  • 7.
  • 8.
    Introduction to Matrix •It is a type of organizational management wherein employees of similar skills are shared for work assignments. • It is a structure in which the workforce reports to multiple managers of different roles. • It is recognizing that companies have both vertical and horizontal chains of command, for which matrix model is created.
  • 9.
    Historical background • •• • 1970s1960s 1990s
  • 10.
    Comprehensive Strategy-Formulation Framework • Thetools presented in this framework of Three stages are applicable to all sizes and types of organizations and can help strategists identify, evaluate, and select strategies.  Stage 1 - Input Stage • EFE Matrix • IFE matrix • CPM  Stage 2 - Matching Stage • IE Matrix • SPACE matrix • SWOT Matrix • BCG matrix • Grand strategy matrix  Stage 3 - Decision Stage • QSPM
  • 11.
  • 12.
    External Factors Evaluation(EFE) Matrix • External Factor Evaluation (EFE) matrix is a strategy tool used to examine company’s external environment (PESTEL-G, Porter’s Five Forces) and to identify available opportunities and threats.
  • 13.
  • 14.
  • 15.
    Process of EFEmatrix • EFE matrix consists of five steps process. 1. List key external factors: opportunities and threats. 2. Assign weight to each factor (0 to 1.0) sum of all weights = 1.0 the weight ranges from 0.0 (not important) to 1.0 (very important) 3. Assign 1-4 rating to each factor to indicate how effectively the firm’s current strategies response to the factor. Where 4 = the response is superior, 3 = the response is above average, 2 = the response is average, Where 4 = the response is superior, 3 = the response is above average, 2 = the response is average, and 1= the response is poor. Rating is based on effectiveness of the firm’s strategies. 4. Multiply each factor’s weight by its rating. 5. Sum the weighted scores for each factor
  • 16.
    Ratings and Weighted •Highest possible weighted score for the organization is 4.0 • The lowest is 1.0 • The average is 2.5 • A total weighted score of 4.0 indicates that an organization is responding in a outstanding way to existing opportunities and threats in its industry. • A total score of 1.0 indicated that a firm’s strategies are not capitalizing on opportunities or avoiding external threats.
  • 17.
  • 18.
    EFE Matrix Example KeyExternal Factors Weight Rating Weighted Score Opportunities A lot of countries encourage technology innovation and high-tech industry is really important. 0.03 3 0.09 Countries value the protection of intellectual property 0.04 3 0.12 GDP and national income per capita increasing 0.12 3 0.36 Consumption pattern is changing from subsistence consumption to well spending Pattern 0.07 3 0.21 Samsung’s mobile phones have high attention 0.09 4 0.36 Growing India’s smartphone market 0.05 2 0.10 People more care about brand and quality than price 0.14 3 0.42
  • 19.
    Cont.. Key External FactorsWeight Rating Weighted Score Threats Legal issues with Apple 0.05 3 0.15 Price wars with Chinese phones 0.10 3 0.30 More and more new substitute and potential entrant 0.10 4 0.4 Strong competitors: Apple, Nokia, HTC… 0.12 4 0.48 The user experience is upgrading 0.09 3 0.27 Total 1.00 37 3.26
  • 20.
    Conclusion • As perthe standards given, Samsung reap following; 1. Samsung’s total weighted score 3.26 it means it has potential to avoid threats, exploit opportunities in better way. 2. Earn above average
  • 21.
  • 22.
    Internal Factor Evaluation(IFE) Matrix • Internal Factor Evaluation (IFE) matrix is a strategic management tool for auditing or evaluating major strengths and weaknesses in functional areas of a business.
  • 23.
    Internal Factor Evaluation(IFE) Matrix INTERNAL FACTORS Internal factors are the outcome of detailed internal audit of a firm, every company have some weak and strong points, therefor the internal factors are divided into two categories namely strengths and weakness.
  • 24.
    Internal Strengths • Strengthsare the strong areas or attribute of the company, which are used to overcome weakness and capitalize to take advantage of the external opportunities available in the industry. The strengths could be tangible or intangible; such as brand image, financial position, income, human resource.
  • 25.
    Weaknesses • Weaknesses arethe risky areas which needs to be addressed on priority to minimize its impact. The competitors always searching for the loop holes in your company and put their best effort to capitalize on the identified weaknesses.
  • 26.
    • IFE matrixalso provides a basis for identifying and evaluating relationships among those areas. The Internal Factor Evaluation matrix is used in strategy formulation. • The IFE Matrix together with the EFE matrix is a strategy- formulation tool that can be utilized to evaluate how a company is performing in regards to identified internal strengths and weaknesses of a company. IFE Matrix
  • 27.
    Steps There are Fivesteps in making Internal Evaluation Factor Matrix. • List key internal factors as identified in the internal-audit process. Use total of from ten to twenty internal factors, including both strengths and weaknesses. List strengths first and then weaknesses. Be as specific as possible, using percentages, ratios, and comparative numbers.
  • 28.
    • Assign aweight that ranges from 0.0 (not important) to 1.0 (all-important) to each factor. The weight assigned to a given factor indicates the relative importance of the factor to being successful in the firm's industry. Regardless of whether a key factor is an internal strength or weakness, factors considered to have the greatest effect on organizational performance should be assigned the highest weights. The sum of all weights must equal 1.0
  • 29.
    • Assign a1-to-4 rating to each factor to indicate whether that factor represents a major weakness (rating = 1), a minor weakness (rating = 2), a minor strength (rating = 3), or a major strength (rating = 4). Note that strengths must receive a 4 or 3 rating and weaknesses must receive a 1 or 2 rating. Ratings are, thus, company based, whereas the weights in Step 2 are industry based.
  • 30.
    4. Multiply eachfactor's weight by its rating to determine a weighted score for each variable. 5. Sum the weighted scores for each variable to determine the total weighted score for the organization
  • 31.
    • Regardless ofhow many factors are included in an IFE Matrix, the total weighted score can range from a low of 1.0 to a high of 4.0, with the average score being 2.5. Total weighted scores well below 2.5 characterize organizations that are weak internally, whereas scores significantly above 2.5 indicate a strong internal position. • The number of factors has no effect upon the range of total weighted scores because the weights always sum to 1.0
  • 32.
  • 33.
    IFE Matrix Example KeyInternal Factors Weight Rating Weighted Score Strengths Brand Recognition and Loyalty 0.07 3 0.21 A large number of products and broad product line 0.05 4 0.20 Strong research and development ability 0.10 3 0.30 Hardware integration with many open source OS and software 0.04 2 0.08 Innovation and fashion design, especially popular among younger peoples 0.15 4 0.60 With extensive sales channels and propaganda 0.06 3 0.18 Low production costs 0.03 3 0.09 Largest share in Smartphone industry ( 30% market share worldwide, extending its lead over Apple and Nokia) 0.15 4 0.60
  • 34.
    Cont.. Key Internal FactorsWeight Rating Weighted Score Weaknesses Not high lighting Price/Performance Ratio. 0.10 4 0.40 Lack its own OS and Software 0.07 4 0.28 Patent infringement 0.04 3 0.12 Too low profit margin 0.04 2 0.08 Limited high-end products 0.03 2 0.06 Focus on too many products, with inaccurate positioning 0.07 3 0.21 Total 1.00 44 3.41
  • 35.
  • 36.
    Competitive profile matrix(CPM) •Identifies a firm’s major competitors and their particular strengths and weaknesses in relation to a sample firm’s strategic position.
  • 37.
    Strengths • Resources andcapabilities that it possesses that enable it to engage in activities that generate economic value and some times competitive advantage. • It is important to have strength so no one can ever take anything from you ever again as this is vital for success in life. • Example:- Microsoft has ability to write application software. Disney has strength in creating entertainment markets
  • 38.
    Weaknesses • Are firmsresources and capabilities that either make it difficult to realize the economic value of a firm’s strengths or actually reduce a firm’s economic value. • Example:- US Air’s high cost of labor id weakness McDonalds faces huge loss in India
  • 39.
    Opportunities • Chance fora firm to improve its competitive position and performance. • Opportunities come in all different sizes, from hardly noticeable ones, to life-changing ones. • Example:-A big sporting event for an energy drink’s producers: a large sporting event would be a great place for an energy drink producer to advertise, and sponsor athletes.
  • 41.
    Threats • Are anyindividual groups, or organization outside a firms that seeks to reduce the level of the firm’s performance . • Every firms faces threats in its comitatives .
  • 42.
    Ratings Scale • Ifrating scales are 4, than • 1-4 is major weakness • 2-4 is minor weakness • 3-4 is minor strength • 4-4 is major strength
  • 43.
  • 44.
    Factors for analysis •Effectiveness of distribution channels • Patent advantages • Location of facilities • Production capacity and efficiency • Experience • Union relations • Technological advantages • E-commerce expertise
  • 45.
    Effectiveness of distributionchannels  Direct marketing: where the goods are sold directly from the product direct to the customer.  Wholesaler: A wholesaler is normally an intermediary between the producer and the retailer.
  • 46.
     Agents/Brokers: Agentsand brokers are intermediaries between the producer and the wholesaler and/or retailer.  Retailers: A retailer is an intermediary, which buys products either from manufacturers or from wholesalers and resells them to consumers
  • 47.
    Patent Advantage • Apatent gives you the right to stop others from copying, manufacturing, selling or importing your invention without your permission.
  • 48.
  • 49.
    Production Capacity • isthe volume of products or services that can be produced by an enterprise using current resources.
  • 50.
    Experience • the processor fact of personally observing, encountering, undergoing something. • practical contact with and observation of facts or events.
  • 51.
    Union Relations • IndustrialUnions • Public Sector Unions • Labor unions
  • 52.
    Technological Advantage • Areways of develop our lives, because the technology help us with different king of work.
  • 53.
    Ecommerce Expertise • helpsave you money and satisfy your valued customers, we also have established meaningful partnerships that can benefit your business, from shopping carts, to call centers, to dependable shipping carriers.
  • 54.
  • 55.
    Strategy-Formulation Framework IE Matrix SPACEMatrix SWOT Matrix BCG Matrix Grand Strategy Matrix Stage 2: The Matching Stage
  • 56.
    • The internaland external (IE) matrices have been introduced by Fred R . David . • Internal Factor Evaluation (IFE): The internal factor evaluation (IFE) Matrix is a strategy tool used to evaluate firm’s internal environment used to reveal it’s strength as well as weaknesses. • External Factor Evaluation (EFE): The external factor evaluation (EFE) is used to examine company’s external environment and to identify the available opportunities and threats. Internal-External (IE) Matrix
  • 57.
     Position ofvarious division of an organization is categorized into nine cell display( I, II, III, IV V,VI,VII,VIII,IX).  The IE Matrix is much similar to the Boston Consulting Group (BCG) but there are certain differences like - IE Matrix need more information about the division. -There are separate implications for ever kind of Matrix.  Based on two key dimension: -The IFE total weighted scores on X-axis -The EFE total weight scores on the Y-axis  Divide into three major regions - Grow and build-Cell I,II,IV - Hold and maintain-Cell III,V, or VII - Harvest or divest- Cell VI,VIII,IX Characteristics of (IE) Matrix
  • 58.
    Steps for theDevelpoment of IE Matrix 1. Based on two key dimensions IFE and EFE. 2. Place IFE total weighted scores on the x-axis and the EFE total weighted scores on the y-axis. 3. On the x-axis of the IE Matrix ,an IFE total weighted score of 1.0 to 1.99 represents a weak internal position ; a score of 2.0 to 2.99 is considered average; and a score of 3.0 to 4.0 is strong. 4. On the y-axis , an EFE total weighted score of 1.0 to 1.99 is considered low; a score of 2.0 to 2.99 is medium; and a score of 3.0 to 4.0 is high.
  • 59.
    IE Matrix ThreeMajor Regions That Have Different Implications Region first ( Cells , I, II, IV) Grow and build strategy Region Third (Cell, VI,VIII,IX) Harvest or divest strategy Region second (Cell, III,V,VII) Hold and maintain strategy
  • 60.
    Grow and build Itinvolve the strategies that focuses on market penetration , market development product development and Horizontal and Vertical integration. Hold and maintain Strategies should focus on market development and product development. Harvest or Divest Strategies should focus on retrenchment and divesture.
  • 61.
  • 62.
    Benefits of IEMatrix: • Easy to understand .The input have a clear meaning to every one inside or outside of the company. • Easy to use . The matrix do not require extensive expertise. • Focusing on key external and internal factors(the IFE and EFE only highlight the key factors that are affecting a company or its strategy). • It is used for multiple purpose such as used to build SWOT Analysis and benchmarking.
  • 63.
    Limitations of IEMatrix • Easily replaced.IFE and EFE Matrix can be replaced by competitive profile matrix , BCG matrix SPACE matrix and also SWOT matrix. • Doesn’t directly help in formation. Both analysis only identify and evaluate the factors but do not help the company directly in determining the next strategic move or the best strategy. • Too broad factors .SWOT matrix has the same limitation and it has same means the some factors that are not specific enough can be confused with each other.
  • 64.
  • 65.
  • 67.
  • 69.
    Review Input • EFE Matrix •IFE Matrix • CPM Matching • IE Matrix Decision • It is the comprehensive framework of strategy formulation. From input to the out put. • External Factor Evaluation (EFE) matrix is a strategy tool used to examine company’s external environment (PESTEL Analysis, Porter’s Five Forces) and to identify available opportunities and threats • Competitive profile matrix(CPM) Identifies a firm’s major competitors and their particular strengths and weaknesses in relation to a sample firm’s strategic position. • The IE Matrix is based on the matching of internal and external factors.  Based on two key dimension: -The IFE total weighted scores on X-axis -The EFE total weight scores on the Y-axis  Divide into three major regions - Grow and build-Cell I,II,IV - Hold and maintain-Cell III,V, or VII - Harvest or divest- Cell VI,VIII,IX
  • 70.
    Glossary • Aggressive: Willingto accept calculated risk of greater than average loss in quest of greater than average returns, without gambling on random chance. • Conservative: is an investing strategy that seeks to preserve an investment portfolio's value by investing in lower risk securities such as fixed-income and money market securities, and often blue-chip or large-cap equities.
  • 71.
    Glossary • Defensive: Amanagement approach designed to reduce the risk of loss. defensive strategy when it comes to investing its extra liquid funds in certificates of deposit or relatively stable bonds and stocks. • Competitive: Good, service, or offer that can hold its own against competing products because it offers an attractive value for money proposition to its buyers.
  • 72.
    Strategy-Formulation Framework IE Matrix SPACEMatrix SWOT Matrix BCG Matrix Grand Strategy Matrix Stage 2: The Matching Stage
  • 73.
    Strategy Position andAction Evaluation (SPACE) Matrix • SPACE analysis matrix is a tremendous technique for evaluating the sense and wisdom in a particular strategic plan. • It was developed by strategy academics “Alan Rowe, Richard Mason, Karl Dickel, Richard Mann and Robert Mockler”. . Introduction:
  • 74.
    Significance • The mostimportant concern of most of the organizations is for guaranteed in complex environmental changes. Strategic planning provides some tools for the organizations to follow the formulation of the strategy in various aspects of the organization and manage their strategic performance • SPACE matrix is a strategic management tool that focuses on strategy formulation especially as related to the • Strategy models provide a common focus point for discussion. The best strategies come of from the insight of applying the strategy tools and the discussions that happen within the management team and not of using the planning model. • You can see a set of conditions or even a particular symptom and you can relate it back to the rest of the strategy model to understand more about what is happening at the moment, what is happening and perhaps what will happen
  • 75.
    • Financial Strength (FS) SPACEDimensions • The SPACE Matrix is a relatively easy to understand and use method as a decision aid. It uses two internal dimensions , two external dimensions. • By combining ratings on each dimension on one SPACE matrix diagram, the framework guides the strategic agenda • Competitive Advantage (CA) • Industrial Strength (IS) • Environmental Stability (ES)
  • 76.
    Financial Position/Strength CompetitivePosition/Strength Return on Investment (ROI) Market Share Leverage Product Quality Liquidity Product Life Cycle Working Capital Customer Loyalty Cash Flow Resources Utilization Earning per Share Technology Know-how Price Earning Ratio Control over suppliers and distributors Internal Dimension
  • 77.
    External Dimension Industrial Position/StrengthEnvironmental Position/Strength Profit Potential Technological Changes Financial Stability Inflation Rates Extent Leveraged Demand Variability Growth Potential Barriers to entry into market Resources Utilization Competitive Pressure Productivity
  • 78.
    • The SPACEmatrix focuses on strategy formulation especially as related to the competitive position of an organization. • The SPACE matrix is broken down to four quadrants where each quadrant suggests a different type of a strategy depending on which quadrant the outcome of the analysis places the organization. The strategy types are: 1. Aggressive 2. Conservative 3. Defensive 4. Competitive Strategic Position & Action Evaluation Matrix
  • 79.
    Dimensions & Strategiesin SPACE Matrix Defensive Conservative Competitive Aggressive Strategy Postures Dimensions Unstable Stable Unstable Stable Environmental Strength (ES) Unattractive Attractive Unattractive Attractive Industrial Strength (IS) Weak Weak Strong Strong Competitive Advantage (CA) Weak High Weak High Financial Strength (FS)
  • 80.
    SPACE Matrix Quadrants InternalDimension External Dimension
  • 81.
  • 82.
  • 83.
    • Defensive; Retrenchment,Divestiture and Liquidation are turnaround strategies - Retrenchment: limited withdrawal from one or more product or market segments. - Divestiture: is one of defensive strategies in which part or division of an organization which are closed that need heavy capital, or unprofitable & that are not suitable for the business organization. - Liquidation: sale of assets or a portion of the firm that does not, by it self, constitute a viable operation, by this some capital is raised. Appropriate Strategies
  • 84.
    • Conservative (riskaverse); - Market Penetration: include the activities that are used to increase the market share of a particular product or service. - Market Development: is a growth strategy that identifies and develops new market segments for current products, targets non-buying customers in currently targeted segments. It also targets new customers in new segments. Cont.…
  • 85.
    Cont.… - Product Development:This growth strategy requires changes in business operations, including a research and development (R&D) function that is needed to introduce new products to your existing customer base. - Related Diversification: It is when a business adds or expands its existing product lines or markets. - For example, a phone company that adds or expands its wireless products and services by purchasing another wireless company is engaging in related diversification.
  • 86.
    Cont.… • Competitive; - VerticalIntegration: is a strategy where a company expands its business operations into different steps on the same production path, such as when a manufacturer owns its supplier and/or distributor Horizontal Integration: Horizontal integration is the acquisition of additional business activities that are at the same level of the value chain in similar or different industries. - Market Penetration - Market Development - Product Development
  • 87.
    Cont… • Aggressive: - VerticalIntegration - Horizontal Integration - Market Penetration - Market Development - Product Development: (related or unrelated): Diversification is the art of entering product markets different from those in which the firm is currently engaged in. It is helpful to divide diversification into ‘related’ diversification and ‘unrelated’ diversification.
  • 88.
    How to ConstructSPACE Matrix • The SPACE matrix is constructed by plotting calculated values for competitive advantage (CA) and industry strength (IS) dimensions on the X axis. • The Y axis is based on the environmental stability (ES) and financial strength (FS) dimensions.
  • 89.
    1. Choose variablesof CA, IS, ES, and FS. 2. Rate individual factors to each dimension, rate CA and ES using rating scale from -6 (worst) to -1 (best). Rate IS and FS from +1 (worst) to +6 (best). 3. Find the average scores for CA, IS, ES, and FS. 4. Plot values from step 3 for each dimension on the SPACE matrix on appropriate axis. 5. Add the average score for CA, and IS dimensions. This will be final point on X axis on the SPACE Matrix. 6. Add the average score for the SPACE matrix ES and FS dimensions to find your final point on the axis Y. 7. Find intersection of your X and Y points. Draw a line from the center of the SPACE matrix to your point. This line reveals the type of strategy the company should pursue. Steps
  • 90.
  • 91.
    Samsung SPACE Matrix InternalDimension External Dimension Y Financial Strength (FS) +1 to +6 Environmental Stability (ES) -6 ton-1 +3 Earning per share -2 Price of competitive product +5 Revenue increase -4 Competitive pressure +4 Return on Assets -4 Global economic +4 Leverage -2 Technology changes +3 Liquidity -2 Demand elasticity +3 Cash flows -2 Inflation rate Average 3.7 (22/6= 3.6666 or 3.7) Average - 2.7 (-16/6 = 2.6666 or 2.7) Total Y axis score: 1.00 (3.7 – 2.7 ) Internal Dimension External Dimension Y Financial Strength (FS) +1 to +6 Environmental Stability (ES) -6 ton-1 +3 Earning per share -2 Price of competitive product +5 Revenue increase -4 Competitive pressure +4 Return on Assets -4 Global economic +4 Leverage -2 Technology changes +3 Liquidity -2 Demand elasticity +3 Cash flows -2 Inflation rate Average 3.7 (22/6= 3.6666 or 3.7) Average - 2.7 (-16/6 = 2.6666 or 2.7) Total Y axis score: 1.00 (3.7 – 2.7 )
  • 92.
    Cont. Internal Dimension ExternalDimension X Competitive Advantage (CA) -6 to -1 Industrial Strength (IS) +1 to +6 -1 Product Quality +6 Barriers to entry -1 Market Share +5 Growth potential -1 Brand & Image +5 Access to financing -3 Product Life Cycle +6 Consolidation -5 Customer Service +6 Profits -2 Customer Loyalty Average -2.2 (-13/6 = -2.1666 or 2.2) Average 5.6 (28/5) Total X axis Score: 3.4
  • 93.
    SPACE Matrix Graph Backward,Forward, Horizontal Integration Market Penetration Market Development Product Development Diversification (Related or Unrelated)
  • 94.
    Finished! That is allfor Today Ask Question ? for Increase my Knowledge
  • 95.
  • 96.
    Strategy-Formulation Framework IE Matrix SPACEMatrix SWOT Matrix BCG Matrix Grand Strategy Matrix Stage 2: The Matching Stage
  • 97.
    History of SWOT/TOWSMATRIX S stood for what things are Satisfactory at present, O denoted what Opportunities can be explored in the future, F meant the Faults in the present and T signified the Threats that could surface in the future. .  1960-1970s Albert Humphrey developed an analytical tool to evaluate the strategic plans and find out why corporate planning failed. He coined this technique as SOFT analysis where –
  • 98.
    Continue..  1964: In theseminar held in Zurich by Urick and Orr proposed the concept of SWOT analysis which was derived from SOFT by replacing the F for faults with W for Weaknesses. With its initial promotion in the Britain, the concept soon gained recognition among strategic planners and management consultants the world over
  • 99.
    Continue.. TOWS is developedby the American international business professor Heinz Weirich The TOWS Matrix is derived from the SWOT Analysis model, which stands for the internal Strengths and Weaknesses of an organisation and the external Opportunities and Threats that the business is confronted with SWOT and TOWS use the same factors for analysis. SWOT and TOWS are used interchangeably without regard to the order that strengths, weaknesses, threats and opportunities are examined. The only difference between them is order nothing else.
  • 100.
    SWOT/TOWS MATRIX  Swotanalysis is a strategic planning method used to evaluate the internal (strengths and weaknesses)and external factors(Opportunities and threats)that are favourable and unfavourable to achieve the objects in a business or a project.  It is conceptual framework for a systematic analysis that facilitates matching the external threats and opportunities with the internal weaknesses and strengths of the organisation.  It is a matching stage as it compares internal environment with external environment.
  • 101.
    Strength and weaknesses •Strength: Characteristics of the business or team that give it an advantage over others in the industry Example: Established brand name • Lower production costs • Superior management • Excellent marketing skills • Weaknesses: Detract the organization from its ability to attain the core goal and influence its growth. Example: Higher production costs • Obsolete or Out-of-date products/technology • Poor market image • Poor marketing skills
  • 102.
    Opportunities And threats Strength: Condition of the environment that benefits the organization in planning and executing strategies that enable it to become more profitable Example: • Decline in demand for a substitute product • Changing customer needs/tastes • New uses discovered for existing product • Threats: External elements in the environment that could cause trouble for the business. Introduction of new substitute products Example: • Decline in product life cycle • Changing customer needs/tastes
  • 103.
    Alternative strategies oftows matrix . The TOWS MATRIX helps to identify the strategic alternatives for a company that works as a matching tool by constructing four types of strategies such as 1.WT strategy 2. WO strategy 3. ST strategy 4.SO strategy
  • 104.
    WT strategy ANDWO Strategy 1. WT Strategy: It aims to minimize both weakness and threats and maybe called as mini-mini strategy. Min-min strategy Example: weak distribution network creating many problems for the firm if it strong many external threats can be removed. 2. WO Strategy: Attempts to minimize the weaknesses and maximize opportunities. Min-Max strategy. Example: the firm is in the critical financial problems that is weakness and firm is availing merger with Multinational Corporation is an opportunity
  • 105.
    ST Strategy andSO Strategy 3.ST strategy: it is based on using organisation’s strengths to deal with threats in the environment. The aim is to maximize the former while mini maximizing latter. Defensive strategy. For Example: In a case with an organization that possess good quality of products but is facing threats against competitors who offers low priced products can adopt ST strategy by mass production of the products, therefore it will reduce the unit cost of production. 4. SO Strategy: This is also known as Maxi –Maxi Strategy where a firm utilizes most of its internal strengths in order to grab the right external opportunities. Attacking strategies. For Example: A firm whose financial position is quite strong and posses low market share is able to introduce many innovative products in the market by making investment in the Research & development Department of the firm.
  • 106.
    Steps necessary forconstructing tows matrix  Steps for developing strategies: • There are eight steps involved in constructing a TOWS Matrix: 1. Rank external opportunities 2. Rank external threats 3. Rank internal strength 4. Rank internal weaknesses. 5. Match internal strengths with external opportunities and mention the result in the SO Strategies cell. 6. Match internal weaknesses with external opportunities and mention the result in the WO Strategies cell. 7. Match internal strengths with external threats and mention the result in the ST Strategies cell. 8. Match internal weaknesses with external threats and mention the result in the WT strategies cell.
  • 108.
    Who need SwotAnalysis? • SWOT Analysis is useful for various aspects from the perspective of the following
  • 109.
    Continue… 1.job holder: When hissupervisor has issues with work output, When he is assigned to a new job 2. Business Unit: When the customer service needs to be improved, When launching a new business unit to pursue a new business 3. Company: When revenue, cost and expense and targets are not being achieved ,When the market share is declining, When the industry conditions are unfavorable
  • 110.
    Limitations • Does notshow how to achieve a competitive advantage, so it must not be an end in itself. • Provides a static/inactive (i.e. Snapshot) assessment in time. In other words, it is like a single frame of a motion picture. • May lead the firm to overemphasize a single internal or external factor in formulating strategies
  • 111.
  • 112.
    Strategy-Formulation Framework IE Matrix SPACEMatrix SWOT Matrix BCG Matrix Grand Strategy Matrix Stage 2: The Matching Stage
  • 113.
    Boston Consulting GroupMatrix: • The Boston Consulting Group (BCG) is a management consulting firm founded by Harvard Business School Alum Bruce Henderson in 1963. • The BCG Matrix is used for the evaluation of the organization's product portfolio in marketing and sales planning. It aims to evaluate each product. • The growth-share matrix is a chart created to help corporation analyze their business units or product lines, and decide where to allocate cash.
  • 114.
    • Market Growth:An increase in the demand of a product or service in the market is termed as Market Growth. When company tries to expand, it expects markets to grow. For this, companies try to increase the perceived value, product features, competitive prices etc. • Market Share: Market share represents the percentage of an industry or market's total sales that is earned by a particular company over a specified time period. Market share is calculated by taking the company's sales over the period and dividing it by the total sales of the industry over the same period.
  • 115.
    Boston Consulting GroupMatrix: It is categorized into four types for the purpose of taking decisions: A- Question Marks B- Stars C- Cash Cows d- Dogs
  • 116.
    Question Marks: • QuestionMarks (sometimes called “problem children” or “wildcats”) are new products with the potential for success, but they need a lot of cash for development. • Units with low market share in a fast-growing industry are known as question marks. Such business units require large amounts of cash to grow their market share. • In PLC Question mark is termed as Introduction stage • For Examples: MacBook (Laptops) of Apple company.
  • 117.
    Stars • Stars representbusiness units having large market share in a fast growing industry. • Stars are market leaders that are typically at the peak of their product life cycle and are able to generate enough cash to maintain their high share of the market and usually contribute to the company’s profits. • In Star category product having high growth rate and high market share. • Star category is depicted in PLC as Growth stage. • For Example: I-Phone of Apple Company.
  • 118.
    Cash Cows • Cashcows typically bring in far more money than is needed to maintain their market share. • Cash Cows is the part of business that always makes a profit and that provides money for the rest of business. • Cash cows require little investment and generate cash that can be utilized for investment in other business units. • In Cash Cow product having high market share and low market growth • For Example: I-Pad of Apple.
  • 119.
    Dogs • Dogs representbusinesses having weak market shares in low-growth markets. They neither generate cash nor require huge amount of cash. Due to low market share, these business units face cost disadvantages. • In PLC Dogs category is known as decline stage. • It shows that the product having low market share and low market growth. • For example: I-Pods of Apple
  • 120.
    Advantages of BCGMatrix: • Clear guidance is provided for each quadrant in terms of the approach to investment and support of business units . • The growth-share matrix is a chart created to help corporation analyze their business units or product lines, and decide where to allocate cash. • Although the matrix is developed based upon historical/current position, the four quadrants of the BCG matrix provide some strategic guidance for the future.
  • 121.
  • 122.
    Strategy-Formulation Framework IE Matrix SPACEMatrix SWOT Matrix BCG Matrix Grand Strategy Matrix Stage 2: The Matching Stage
  • 123.
    Basic terminology • Grandstrategy: The Grand Strategies are the corporate level strategies designed to identify the firm’s choice with respect to the direction it follows to accomplish its set objectives Matrix is a set of numbers laid out in tabular form (in rows and columns). • Market Growth: The expansion of market share by a company, brand or product, as measured by units sold or revenue, achieved through increased consumer demand or competitive advantages
  • 124.
    Basic Terminology • Competitiveposition; The concept of competitive position was given by Jack Trout in 1981. It is the position that a firm has already acquired or is trying to acquire, relative to its competitor. A competitive position gives a firm an advantage over its competitors, thus allowing it to retain/attract more customers, gain mindshare of customers and market share etc
  • 125.
    Grand Strategy Matrix •History 1: The basic concept of Grand Strategy was given Sir Basil Henry Liddell Hart. He is a English soldier, military historian and military theorist. • History 2: The concept of Grand Strategy Matrix was given by Roland Christensen , Norman Berg, and Malcolm in the article of Policy formulation and Administration . It is Published By Richard D Irwin in 1976
  • 126.
    Grand Strategy Matrix •Definition: It is a very useful instrument for creating different and alternative strategies for an organization . It has four quadrant , each quadrant contains different set of strategies and the entire firms along with their respective division must fall in one of the quadrant
  • 128.
    1st Quadrant • Thefirst quadrant of Grand Strategy Matrix indicates that the organization has strong competitive position & there is rapid growth rate in the market. The organization that lies in the first quadrant has the excellent strategic position . The organization of the first quadrant should concentrate on the current market and need to adopt the strategies. • Those company which lay on first quadrant they focus on following strategy. • Market development • Market Penetration • Product development • Forward Integration • Backward Integration • Horizontal Integration • Concentric Diversification
  • 129.
    1st Quadrant Strategy •Market development The concept of market development was given by Igor Ansoff in Ansoff Matrix in 1957. The Market development defined as the selling of existing product in new market or geographical location. Market development increase by New areas or regions about of the country and foreign market. • Market Penetration The concept was given by Igor Ansoff in 1957. Increase market share for present product or service in present markets through greater market efforts is called market penetration. Market penetration increase by decreasing product price and increasing in promotion and distribution support.
  • 130.
    1st Quadrant strategy •Product development The concept was given by Igor Ansoff in Harvard Business review To increase sell of new products, with new or altered features, to existing markets is called Product development. It happen by new ideas and invest in research and development of additional product. • Forward Integration A strategy that involves gaining ownership or increased control over distribution or retailers, such as a manufacturer opening its own chain. When an organization is earning high profit because of stable production. It also affect product prize and competitive advantage
  • 131.
    1st Quadrant Strategy •Backward Integration A strategy seeking ownership or increased control of a firm’s supplier such as a manufacturer acquiring its raw material source firms • Horizontal Integration It is the process of a company increasing production of goods or services by combining similar firm to increase market share and profit. • Concentric diversification Concentric diversification involves adding new products or services that are related to your current offerings. they appeal to the same market or because they can be offered without much investment in new resources (or both) . This means that there is a technological similarity between the industries. Example : If a company produce table linens and also might start making curtain.
  • 132.
    2nd Quadrant strategy •The second quadrant highlights that the organization has weak competitive situation and there is fast market growth. The organization that lies in the second quadrant should evaluate its current strategy for the marketplace seriously. Although there is growing industry but the organization is not able to compete effectively. The organization of second quadrant should find out the reason that why its current strategies are not effective enough to make it competitive in the market. Moreover the organization should also try to find out the best way of change that can improve its effectiveness. Those company which lay on second quadrant they focus on following strategy. • Market development • Market Penetration • Product development • Horizontal Integration • Divestiture • Liquidation
  • 133.
    2nd Quadrant strategy •Divestiture; is one of the strategies in which part or division of an organization is sold Business organization are closed that need heavy capital, are unprofitable & that are not suitable with the other activities of the business organization. • Liquidation is the selling of all the assets of the organization in order to cash their tangible worth.
  • 134.
    3rd Quadrant Strategy •The third quadrant of the Grand Strategy Matrix specifies that the organization has the weak competitive situation and the market growth rate is quite slow. The organization that lies in the third quadrant competes in the industry of slow growth and holds weak competitive position. The organization should seriously adopt certain drastic changes that can minimize further demise and the resulting liquidation. It is better option for the organization that it should adopt extensive asset & cost reduction. There is another suitable option that the organization should keep resources away from the current declining business & put those resources into other diversified areas. Even if all other diversified projects failed then there is last option for the organization to be liquidate itself. Those company which lay on third quadrant they focus on following strategy. • Retrenchment • Concentric diversification • Horizontal diversification • Conglomerate diversification • Divestiture • Liquidation
  • 135.
    3rd Quadrant strategy •Retrenchment The word retrenchment is derived from French word ‘retrancher’ which means to cut down. When a firm decide to eliminate its activities through reduction in business operation, cost ,customer group, customer function and technology alternative is retrenchment strategy. When a company’s sales and profit become reduced then defense our self by reducing number of employee and controlled business expenses in effectively manner. Example ; In September 2011 Nokia company cuts 4,000 job due decrease 21%in sales in amounts it is $1.4billion in a quarter
  • 136.
    3rd Quadrant Strategy •Horizontal Diversification; When a company adding new, unrelated product or service for existing customer is Horizontal diversification . In this technology dissimilarity in the industry . Example: A company that was making notebooks earlier may also enter the pen market with its new product. • Conglomerate Diversification; Conglomerate diversification is one type of diversification in which new products, new markets, new technologies or new market functions introduce which is not related to the existing business. Example: A company which deal with automotive repair parts may enter the toy production industry
  • 137.
    4th quadrant strategy •The fourth quadrant of highlights that the organization has strong competitive situation and the market growth rate is slow. The organization that lies in the fourth quadrant has strong competitive position but the industry in which the organization relates has slow growth. The organization can have suitable option o initiate diversified programs into other growth areas. Those company which lay on fourth quadrant they focus on following strategy. • Concentric Diversification • Horizontal Diversification • Conglomerate • Diversification • Joint Venture
  • 138.
    4th Quadrant Strategy •Diversification; Diversification strategy takes place, for extending product line by new product and operating in different new market. According Warren Buffet “Diversification is protection against ignorance, it makes little sense for those who know what they’re doing.” • Joint venture ; A joint venture (JV) is a business entity created by two or more parties, generally characterized by shared ownership, shared returns and risks, and shared governance. The Purpose of Joint venture to share risk for major investments or projects and to access a new market. In Pakistan on 2011 Pak Suzuki motor company limited was formed as a joint venture between Pakistan automobile corporation and Suzuki motor corporation.
  • 139.
  • 140.
  • 141.
  • 142.
  • 143.
    Strategy-Formulation Analytical Framework Stage 3: TheDecision Stage Quantitative Strategic Planning Matrix (QSPM)
  • 144.
    Quantitative Strategic PlanningMatrix • QSPM is a high-level strategic management approach for evaluating possible strategies • QSPM provides an analytical method for comparing feasible alternative action
  • 145.
    Why go forQSPM • . QSPM attempts to objectively select the best strategy using input from other management techniques and some easy techniques. • The QSPM uses input from stage 1 analyses match them with result from stage 2 analyses, and then decides objectively among alternative strategy
  • 146.
    Steps to Developa QSPM 1. the overall strategic management analyses is used to identify key strategic management factors. This can be done through EFE & IFE matrix 2. Assign weights to each key external and internal factor 3. Examine the Stage 2 (matching) matrices, and identify alternative strategies that the organization should consider implementing Determine the Attractiveness Scores. The range for AS is i. 1 = not attractive, ii. 2 = somewhat attractive, iii. 3 = reasonably attractive, and iv. 4 = highly attractive.
  • 147.
    Cont. 5. Compute theTotal Attractiveness Scores Total attractiveness Scores (TAS) are defined as the product of multiplying the weights (Step 2) by the AS (Step 4) in each row. 6. Compute the Sum Total Attractiveness Score Add TAS in each strategy column of the QSPM. the Sum Total Attractiveness Scores (STAS) reveal which strategy is most attractive in each set of alternatives. Higher scores indicate more attractive strategies
  • 148.
    strategy 2 Strategic Alternatives QSPM KeyInternal Factors Management Marketing Finance/Accounting Production/Operations Research and Development Management Information Systems TASASAS TASWeightKey External Factors Economy Political/Legal/Governmental Social/Cultural/Demographic/Enviro nmental Technological Competitive strategy 1
  • 149.
    Pros and Consof QSPM Advantages  Sets of strategies considered simultaneously or sequentially  Integration of pertinent external & internal factors in the decision-making process • Requires intuitive judgments & educated assumptions • Only as good as the prerequisite inputs • Only strategies within a given set are evaluated relative to each other Disadvantages
  • 150.
    Thank You 😊 for YourValuable Time 🕐 Ask Question to Increase Our Knowledge 📚 ?

Editor's Notes

  • #9 Matrix is used in management off organisation or we can say it a matrix management within an organization. It is defined as: It is a type of organizational management wherein employees of similar skills are shared for work assignments. Simply stated, it is a structure in which the workforce reports to multiple managers of different roles. It is recognizing that companies have both vertical and horizontal chains of command, for which matrix model is created. The concept of this principle lies in the ability to manage the collaboration of people across various functions and achieve strategic objectives through key projects.
  • #10 Although some critics say that matrix management was first adopted in the Second World War, its origins can be traced more reliably to the US space programme of the 1960s when President Kennedy has drawn his vision of putting a man on the moon. In order to accomplish the objective, NASA revolutionized its approach on the project leading to the consequent birth of “matrix organisation”. This strategic method facilitated the energy, creativity and decision-making to triumph the grand vision. In the 1970s, matrix organisation received huge attention as the only new form of organisation in the twentieth century. In fact it was applied by Digital Equipment, Xerox, and Citibank. Despite its initial success, the enthusiasm of corporations with regards to matrix organisation declined in the 1980s, largely because it was complex. Furthermore, the drive for motivating people to work creatively and flexibly has only strengthened. And by the 1990s, the evolution of matrix management geared towards creation and empowerment of virtual teams that focused on customer service and speedy delivery.
  • #13 External Factor Evaluation (EFE) matrix is a strategy tool used to examine company’s external environment (PESTEL-G, Porter’s Five Forces) and to identify available opportunities and threats.
  • #14 PESTEL-G contains all external factors of the environment from which strategists evaluate the best opportunities for their organization factors like political, economical, social, technological, environmental, legal and globalization.
  • #15 Porter’s Five Forces: Porter's Five Forces Framework is a tool for analyzing competition of a business. It draws from industrial organization (IO) economics to derive five forces that determine the competitive intensity and, therefore, the attractiveness (or lack of it) of an industry in terms of its profitability.
  • #37 Competitive profile matrix(CPM) Identifies a firm’s major competitors and their particular strengths and weaknesses in relation to a sample firm’s strategic position.
  • #70 It is the comprehensive framework of strategy formulation. From input to the out put. External Factor Evaluation (EFE) matrix is a strategy tool used to examine company’s external environment (PESTEL-G, Porter’s Five Forces) and to identify available opportunities and threats Competitive profile matrix(CPM) Identifies a firm’s major competitors and their particular strengths and weaknesses in relation to a sample firm’s strategic position. The IE Matrix is based on the matching of internal and external factors. Based on two key dimension: -The IFE total weighted scores on X-axis -The EFE total weight scores on the Y-axis Divide into three major regions - Grow and build-Cell I,II,IV - Hold and maintain-Cell III,V, or VII - Harvest or divest- Cell VI,VIII,IX
  • #71 Aggressive Strategy: An investment strategy characterized by a willingness to accept above-average risk in pursuit of above-average returns. Usually favors stocks over bonds, especially stocks of rapidly growing companies, and sometimes employs buying on margin, options trading, and arbitrage.
  • #74  SPACE is an acronym of Strategic Position and Action Evaluation The analysis allows to create an idea of the appropriate business strategy for the enterprise. The analysis assesses the internal and external environment and allows to design an appropriate strategy. SPACE matrix is a strategic management tool that focuses on strategy formulation especially as related to the competitive position of an organization
  • #76 To determine the organization’s strategic posture in the market and determine its course of action. Each of these four dimensions includes several factors assessed individually during the analysis These four factors are perhaps the most important determinants of an organization’s overall strategic position. The inside environment is also described by two criteria:
  • #77  Financial strength (FS) - it is influenced by the following indicators: return on investment, liquidity, debt ratio, available versus required capital, cash flow, inventory turnover Financial strength (FS) It includes everything that refers to the financials of the company. We can consider the Return on Investment (ROI), which is how much money is recovered from each unit of money invested, the liquidity of the company –it means how easy a company can make cash all his assets and the cash flow. Each one of these variables is given a numeric value from 1 (worst) to 6 (best) according to our perception of how good the company is doing regarding that variable. If the company has a high ROI compared to the industry, the variable can have a 6; conversely, in the case of a Web based company that has not much concrete materials to sell, the liquidity will be low, let’s say 2. Experience is required to evaluate each factor as there is no procedure defined on how to do it. The result will mostly depend on knowledgeable people that can have an idea of how these variables weigh among each other within the company. It includes everything that refers to the financials of the company. We can consider the Return on Investment (ROI), which is how much money is recovered from each unit of money invested, the liquidity of the company –it means how easy a company can make cash all his assets and the cash flow. Each one of these variables is given a numeric value from 1 (worst) to 6 (best) according to our perception of how good the company is doing regarding that variable. If the company has a high ROI compared to the industry, the variable can have a 6; conversely, in the case of a Web based company that has not much concrete materials to sell, the liquidity will be low, let’s say 2. Experience is required to evaluate each factor as there is no procedure defined on how to do it. The result will mostly depend on knowledgeable people that can have an idea of how these variables weigh among each other within the company. Competitive advantage (CA) - it is influenced by the following factors: market share, product quality, product lifecycle, innovation cycle, customer loyalty, vertical integration Competitive Advantage (CA) This is the next variable considered in the internal strategic dimension. Market share, quality of the product, product life cycle, customer loyalty, the know-how and the power of company over its suppliers and intermediaries are some of the variables to be considered. As in the other internal strategic dimension, each variable considered is given a numerical value, but in this case from - 1 (being the best) to -6 (being the worst).
  • #78 The analysis describes the external environment using two criteria: Industry strength (IS) It considers external forces that belong to the industry where the company develops its activities. Variables as growth potential, profit potential, financial stability, resource utilization and productivity are considered. As well, in this dimension each of these variables is given a score that goes from 1 (worse) to 6 (best). IS it is influenced by the following sub-factors: growth potential, profit potential, financial stability, resource utilization, complexity of entering the industry, labor productivity, capacity utilization, bargaining power of manufacturers Environmental stability (ES) Last, ES is considered. It refers to how stable is the market where the company operates. Things like rate of technological change, inflation, demand variability, price range of competing products, risks of the industry and the barriers to enter or exit the market are considered. The more stable is the market; more favorable is for the company to operate in it. A score from -1 (best) to -6 (worst) is given to each of the variables considered. ES - it is influenced by the following sub-factors: technological change, inflation rate, demand volatility, price range of competitive products, price elasticity of demand, pressure from the substitutes
  • #83 Aggressive: Growth possibly by acquisition, Investment on opportunities, Innovate to sustain competitive advantage Backward Integration: Backward integration is a form of vertical integration that involves the purchase of, or merger with, suppliers up the supply chain. Companies pursue backward integration when it is expected to result in improved efficiency and cost savings. For example, this type of integration might cut transportation costs, improve profit margins and make the firm more competitive. Forward Integration: Forward integration is a business strategy that involves a form of vertical integration whereby business activities are expanded to include control of the direct distribution or supply of a company's products. This type of vertical integration is conducted by a company moving down the supply chain. A good example of forward integration is when a farmer sells his crops at a local grocery store rather than to a distribution center that controls grocery store placement. Horizontal Integration: Horizontal integration is the acquisition of additional business activities that are at the same level of the value chain in similar or different industries. This can be achieved by internal expansion through a reinvestment of operating profits or by external expansion through a merger or acquisition (M&A). Since the different firms integrating are involved in the same stage of production, horizontal integration allows them to share resources at that level. Market Penetration: Market penetration is a measure of the amount of sales or adoption of a product or service compared to the total theoretical market for that product or service. In addition, market penetration can also include the activities that are used to increase the market share of a particular product or service. Market Development: The expansion of the total market for a product or company by (1) entering new segments of the market, (2) converting nonusers into users, and/or (3) increasing usage per user. Product Development: Product development may involve modification of an existing product or its presentation, or formulation of an entirely new product that satisfies a newly defined customer want or market niche. Diversification (related or unrelated): Diversification is the art of entering product markets different from those in which the firm is currently engaged in. It is helpful to divide diversification into ‘related’ diversification and ‘unrelated’ diversification. Competitive: Backward, Forward, Horizontal Integration Market Penetration Market Development Product Development Defensive Retrenchment: A strategy used by corporations to reduce the diversity or the overall size of the operations of the company. This strategy is often used in order to cut expenses with the goal of becoming a more financial stable business. Typically the strategy involves withdrawing from certain markets or the discontinuation of selling certain products or service in order to make a beneficial turnaround. the strategy followed, when a firm decides to eliminate its activities through a considerable reduction in its business operations, in the perspective of customer groups, customer functions and technology alternatives, either individually or collectively 2. Divestiture 3. Liquidation: A liquidation strategy involves selling a company, in its entirety or in parts, for the value of its assets. It is the most crucial and the last resort to retrenchment since it involves serious consequences such as a sense of failure, loss of future opportunities, spoiled market image, loss of employment for employees, etc. Conservative Market Penetration Market Development Product Development Related Diversification: A process that takes place when a business expands its activities into product lines that are similar to those it currently offers. For example, a manufacturer of computers might begin making calculators as a form of related diversification of its existing business.
  • #84  Defensive; are the turnaround strategies. Retrenchment:; (spend less to reduce cost) is Strategy, which adopted when an organization aims at reducing its one or more business operations with the view to cut expenses and reach to a more stable financial position Divestiture: It is considered to be component of retrenchment strategy in which those projects of the Business Organization are closed that need heavy capital, are unprofitable & that are not suitable with the other activities of the business organization. Conservative (In group decision making, the tendency to select choices less risky than the average risk of alternatives suggested by individual participants. Or Conservative investing is an investing strategy that seeks to preserve an investment portfolio's value by investing in lower risk securities such as fixed-income and money market securities, and often blue-chip or large-cap equities ) Cost Reduction product service rationalization Invest in search for product/opportunities. Competitive; Cost reduction, productivity improvement, raising more capital to follow opportunities and strengthen competitiveness Possibly merge Less competitive cash rich organization. Aggressive; Growth possibly by acquisition, Investment on opportunities, Innovate to sustain competitive advantage
  • #85 Rationalization is a reorganization of a company in order to increase its efficiency. This reorganization may lead to an expansion or reduction in company size, a change of policy, or an alteration of strategy pertaining to particular products.
  • #87 Horizontal Integration: Since the different firms integrating are involved in the same stage of production, horizontal integration allows them to share resources at that level.
  • #88 Diversification (related or unrelated): Diversification is the art of entering product markets different from those in which the firm is currently engaged in. It is helpful to divide diversification into ‘related’ diversification and ‘unrelated’ diversification.
  • #94 Aggressive: Backward Integration: Backward integration is a form of vertical integration that involves the purchase of, or merger with, suppliers up the supply chain. Companies pursue backward integration when it is expected to result in improved efficiency and cost savings. For example, this type of integration might cut transportation costs, improve profit margins and make the firm more competitive. Forward Integration: Forward integration is a business strategy that involves a form of vertical integration whereby business activities are expanded to include control of the direct distribution or supply of a company's products. This type of vertical integration is conducted by a company moving down the supply chain. A good example of forward integration is when a farmer sells his crops at a local grocery store rather than to a distribution center that controls grocery store placement. Horizontal Integration: Horizontal integration is the acquisition of additional business activities that are at the same level of the value chain in similar or different industries. This can be achieved by internal expansion through a reinvestment of operating profits or by external expansion through a merger or acquisition (M&A). Since the different firms integrating are involved in the same stage of production, horizontal integration allows them to share resources at that level. Market Penetration: Market penetration is a measure of the amount of sales or adoption of a product or service compared to the total theoretical market for that product or service. In addition, market penetration can also include the activities that are used to increase the market share of a particular product or service. Market Development: The expansion of the total market for a product or company by (1) entering new segments of the market, (2) converting nonusers into users, and/or (3) increasing usage per user. Product Development: Product development may involve modification of an existing product or its presentation, or formulation of an entirely new product that satisfies a newly defined customer want or market niche. Diversification (related or unrelated): Diversification is the art of entering product markets different from those in which the firm is currently engaged in. It is helpful to divide diversification into ‘related’ diversification and ‘unrelated’ diversification.