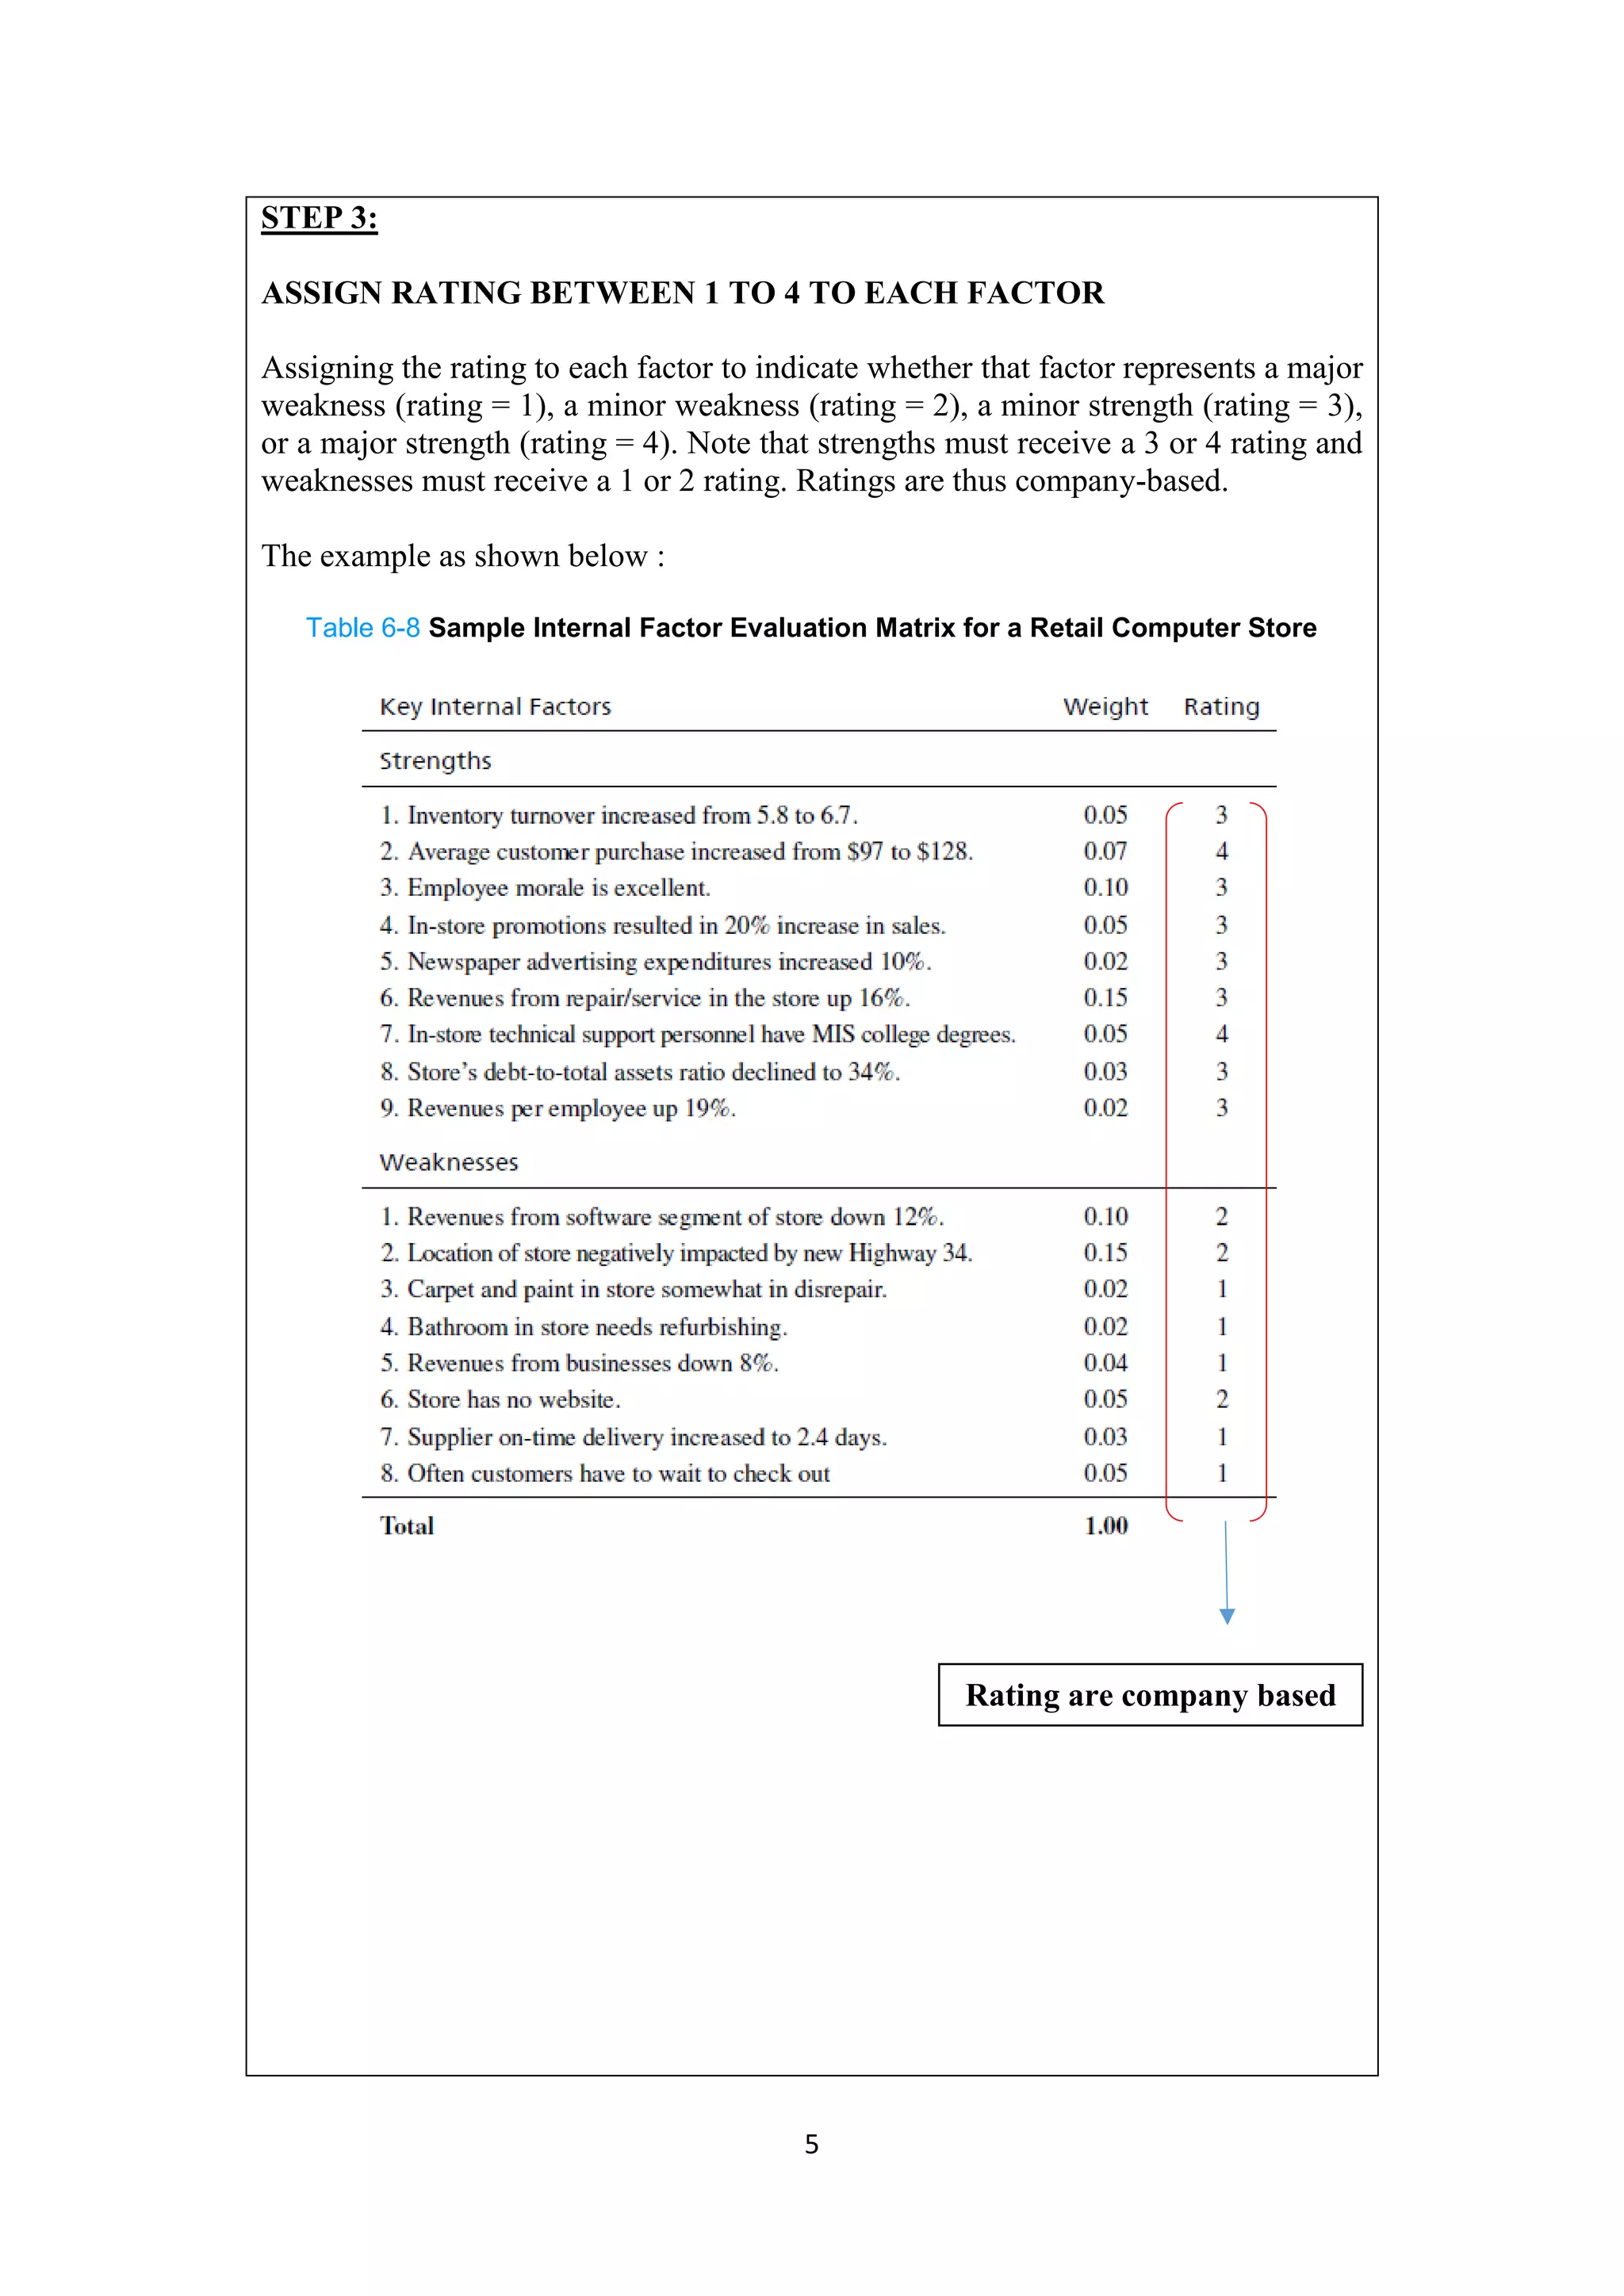
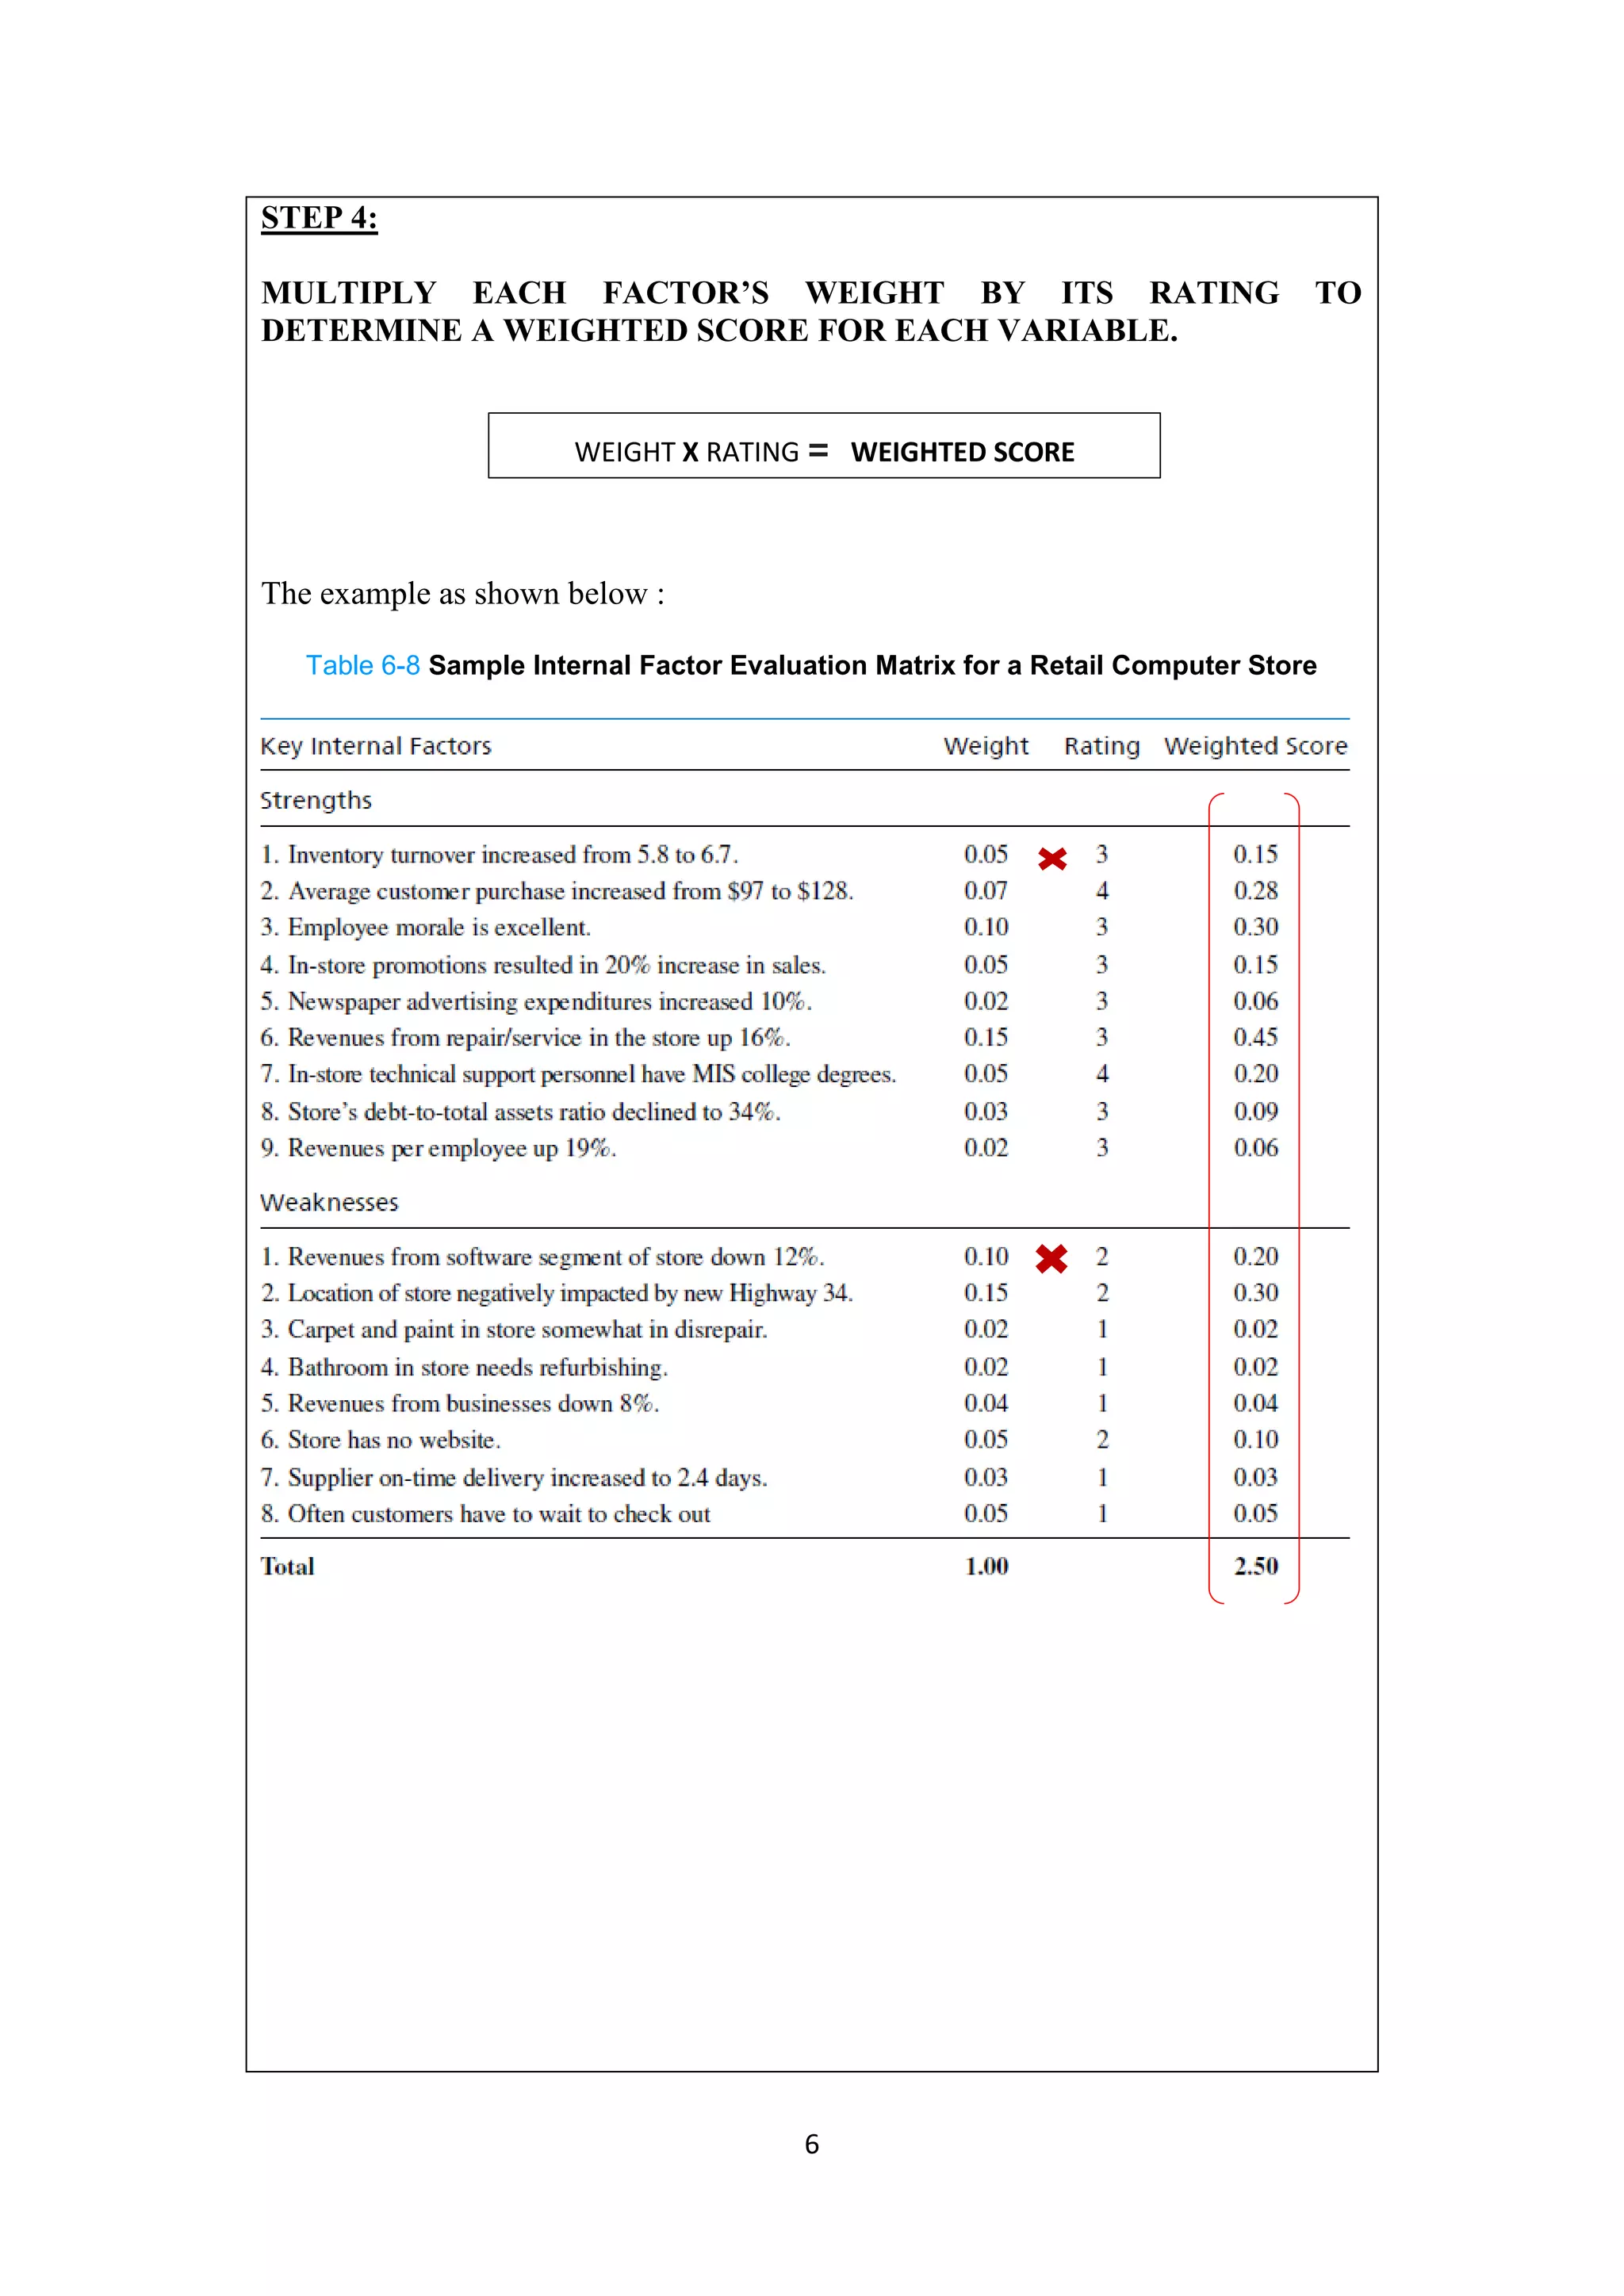
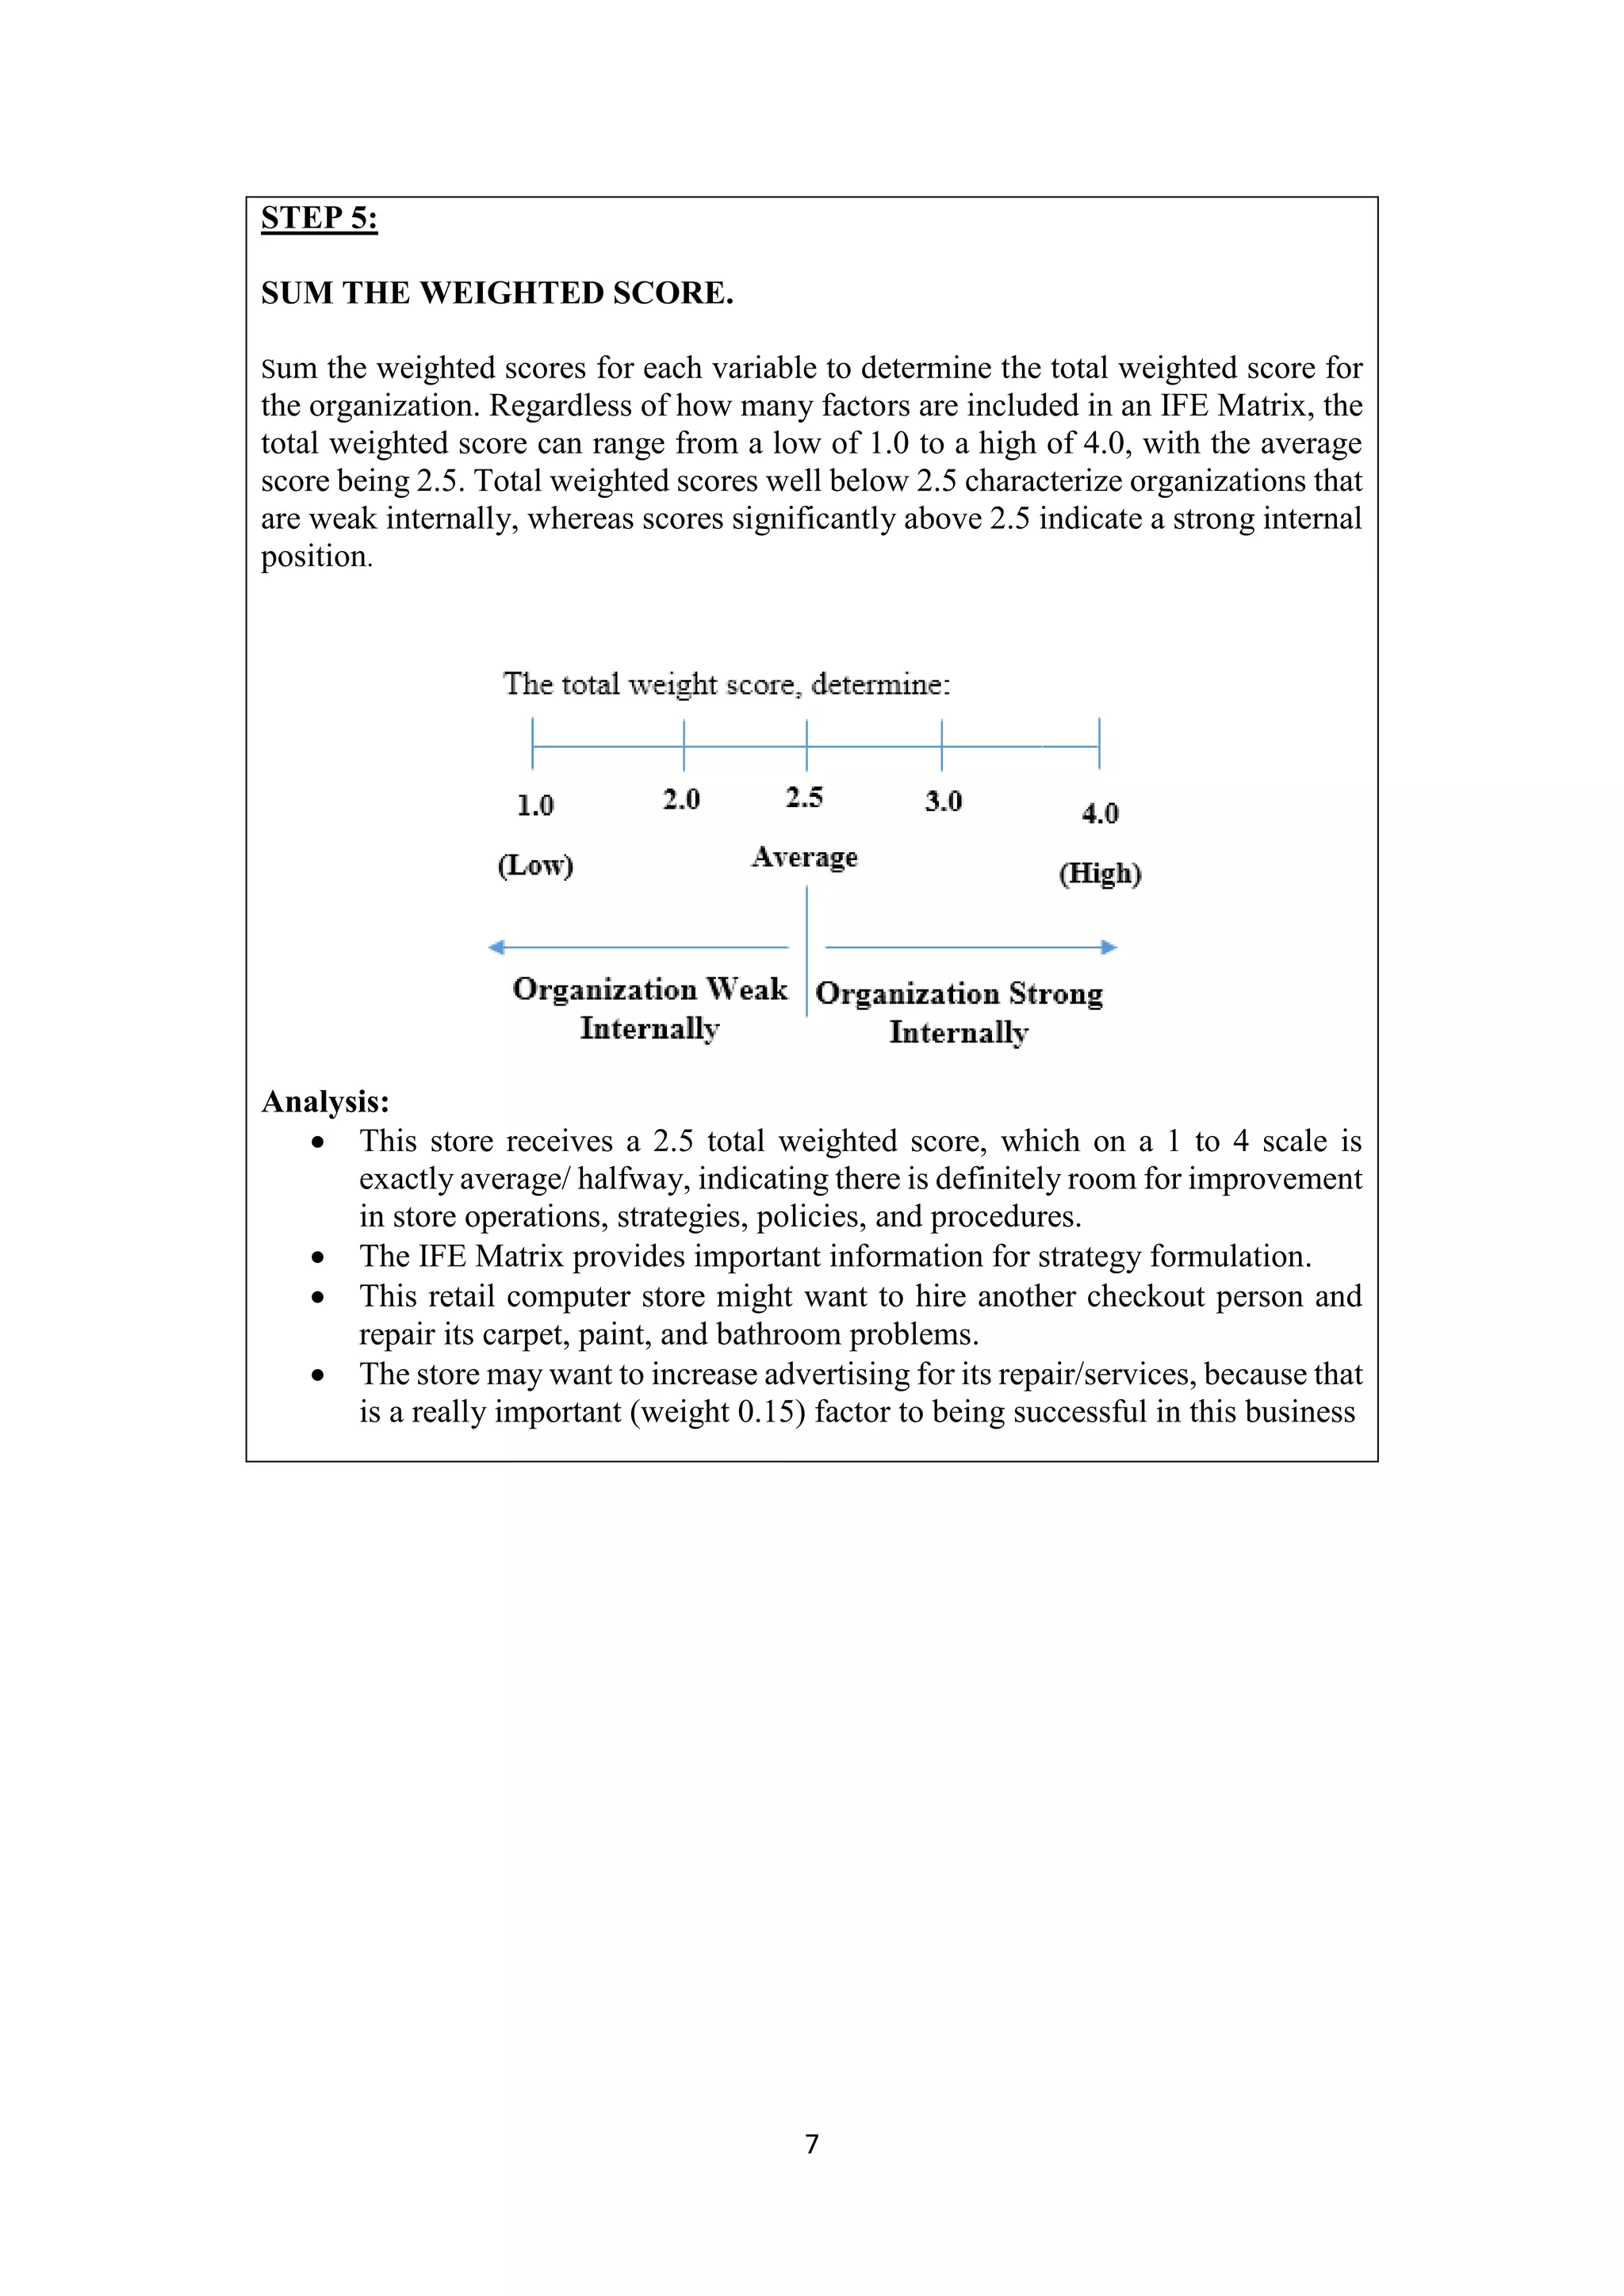
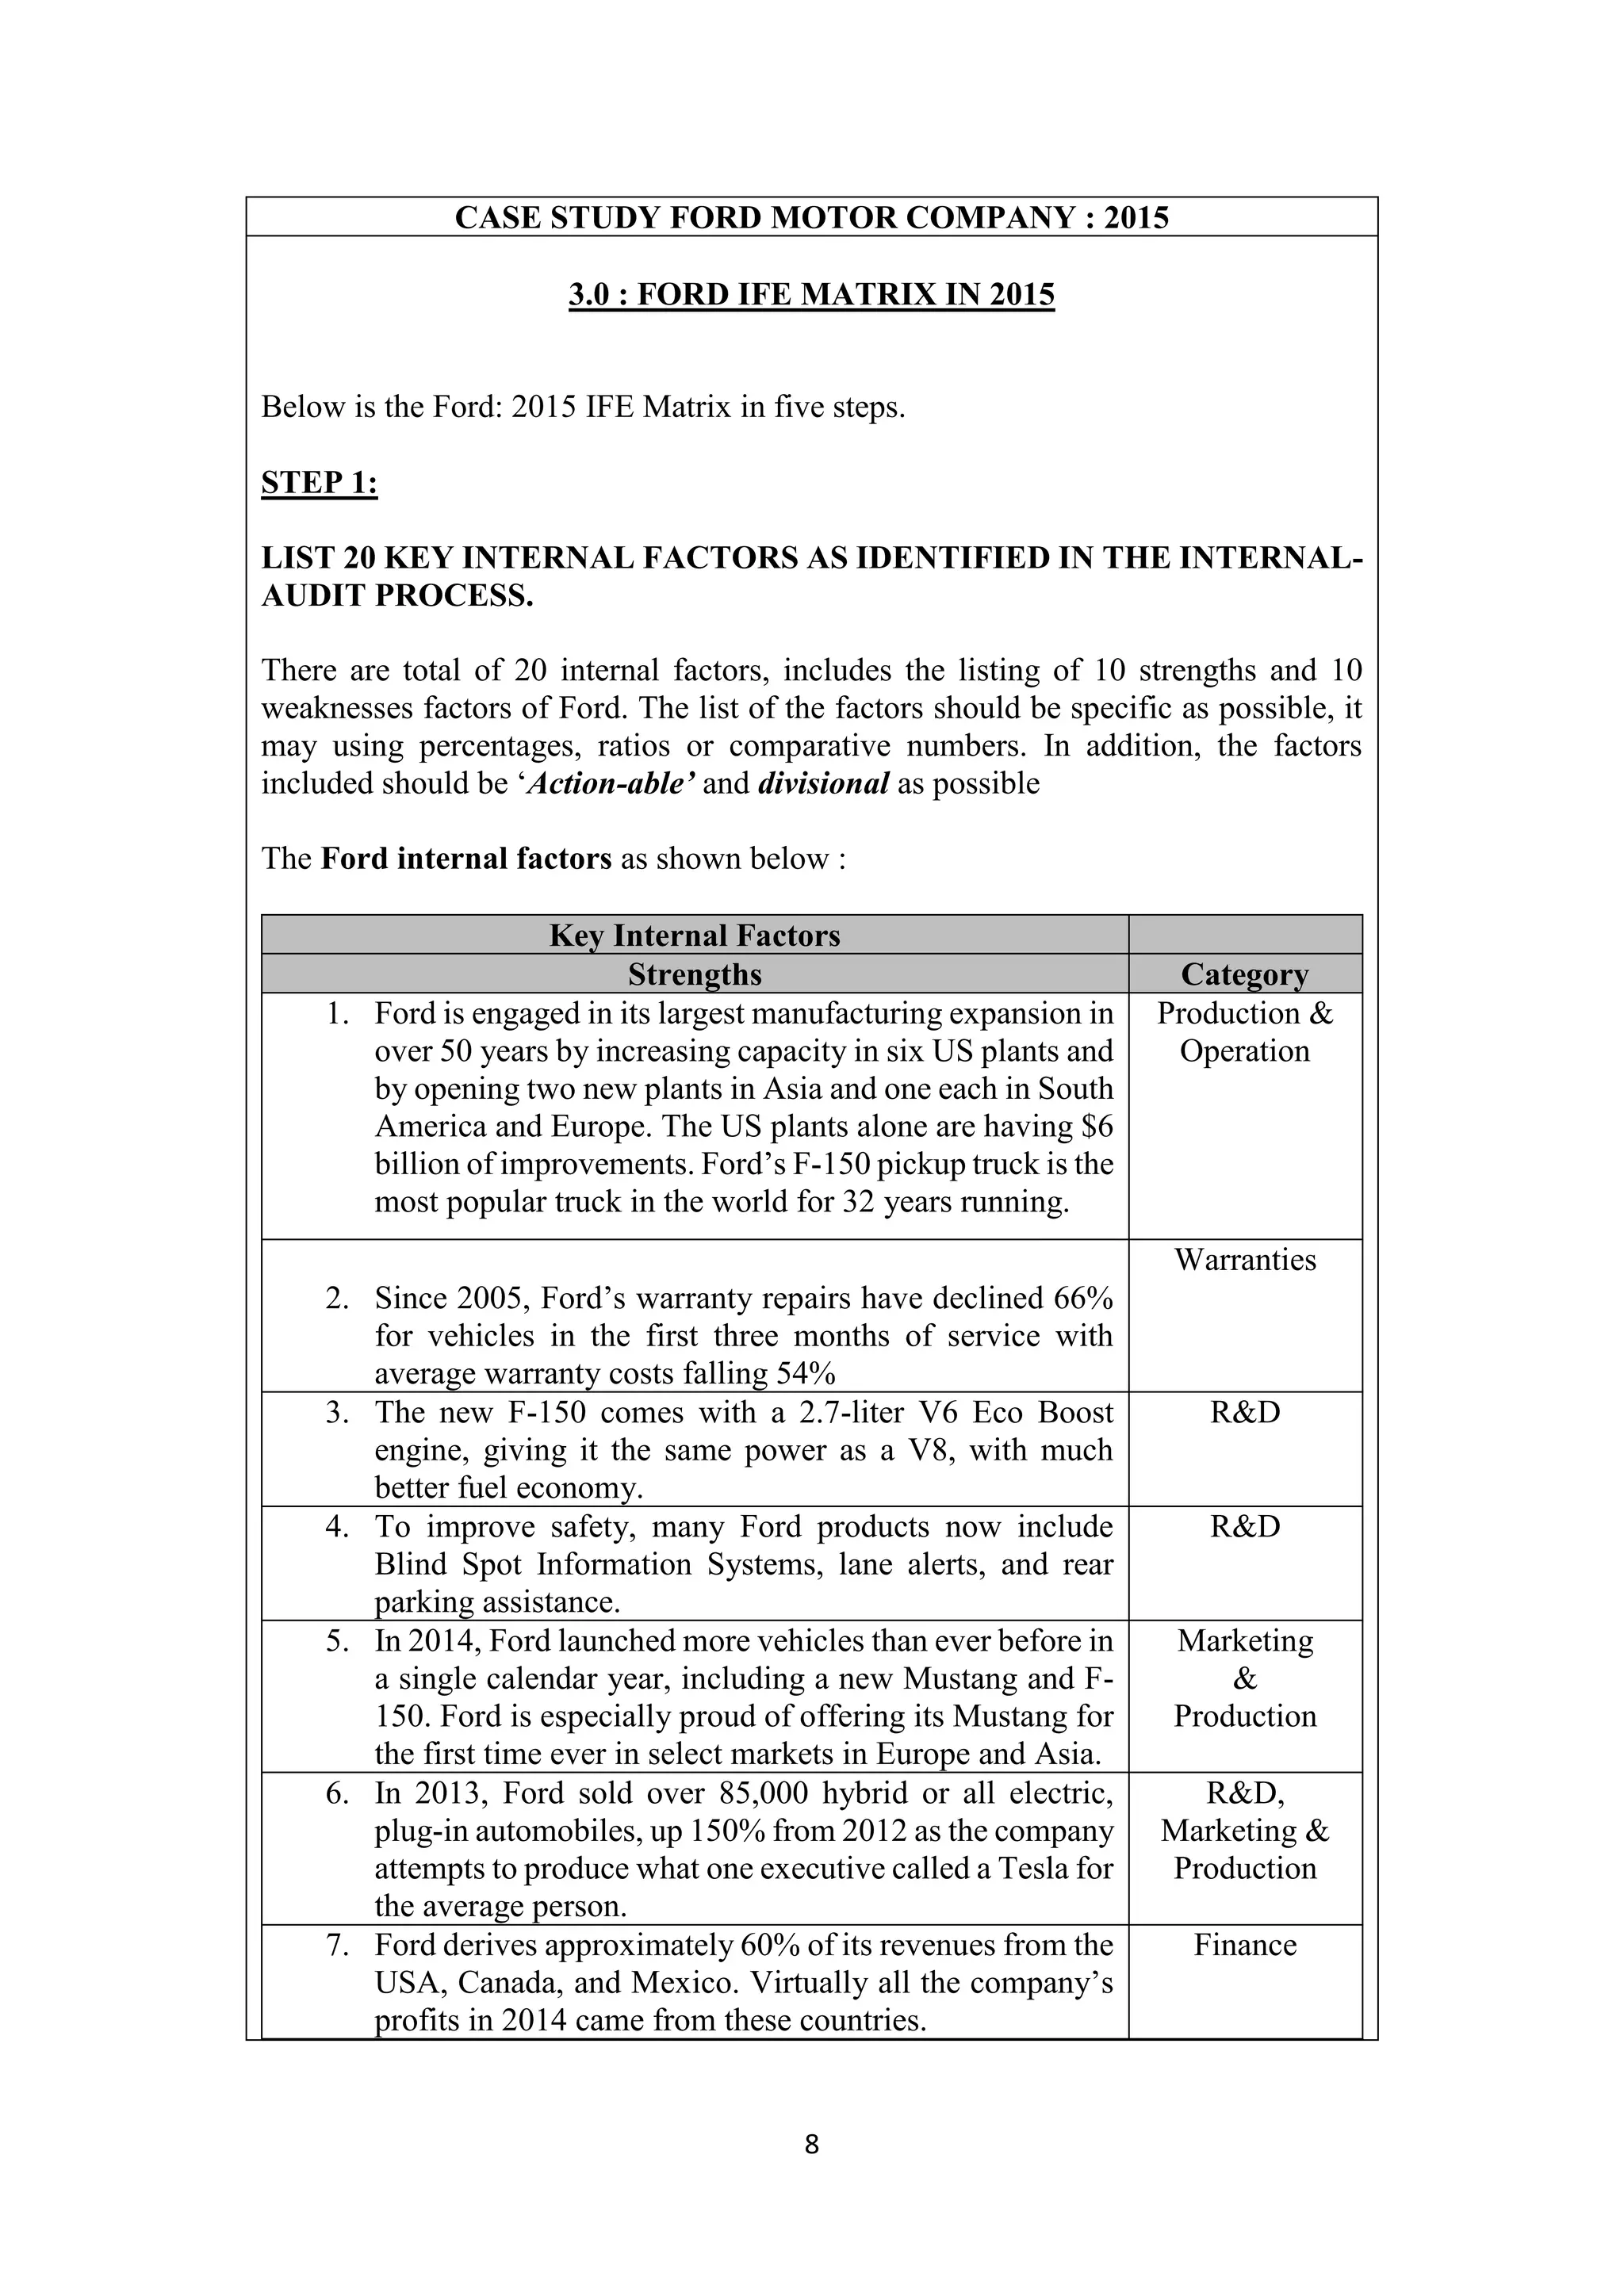
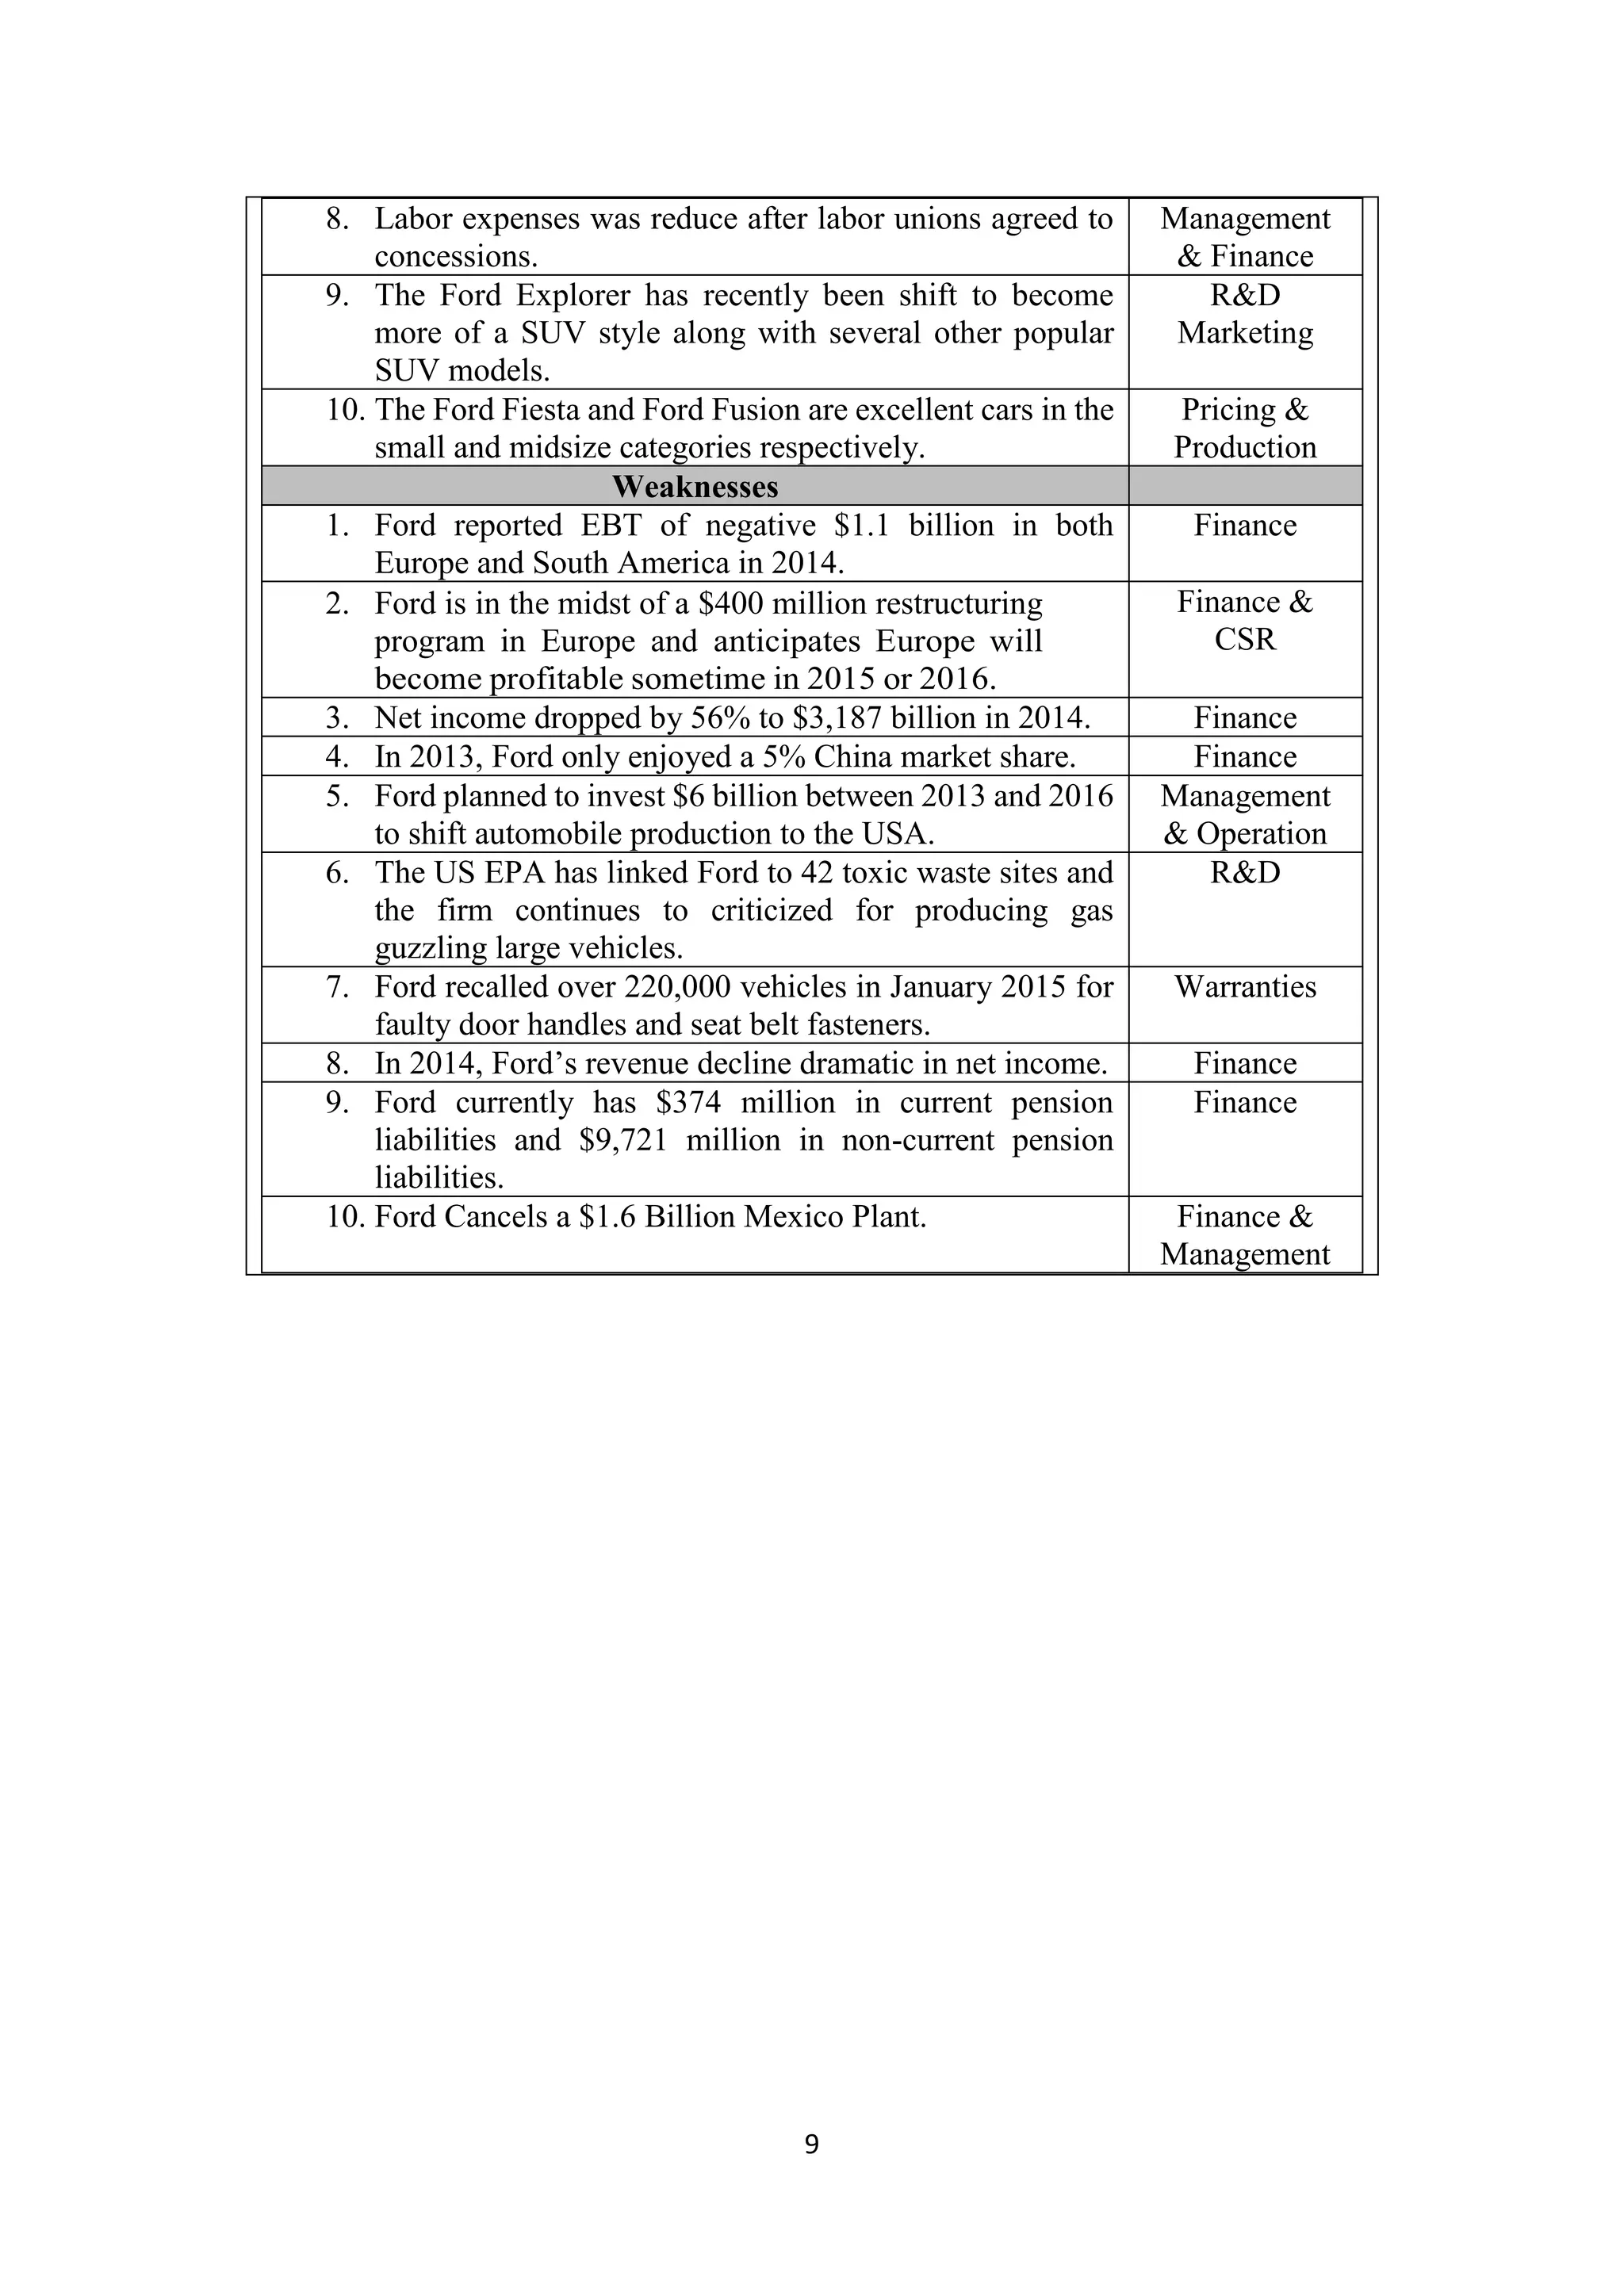
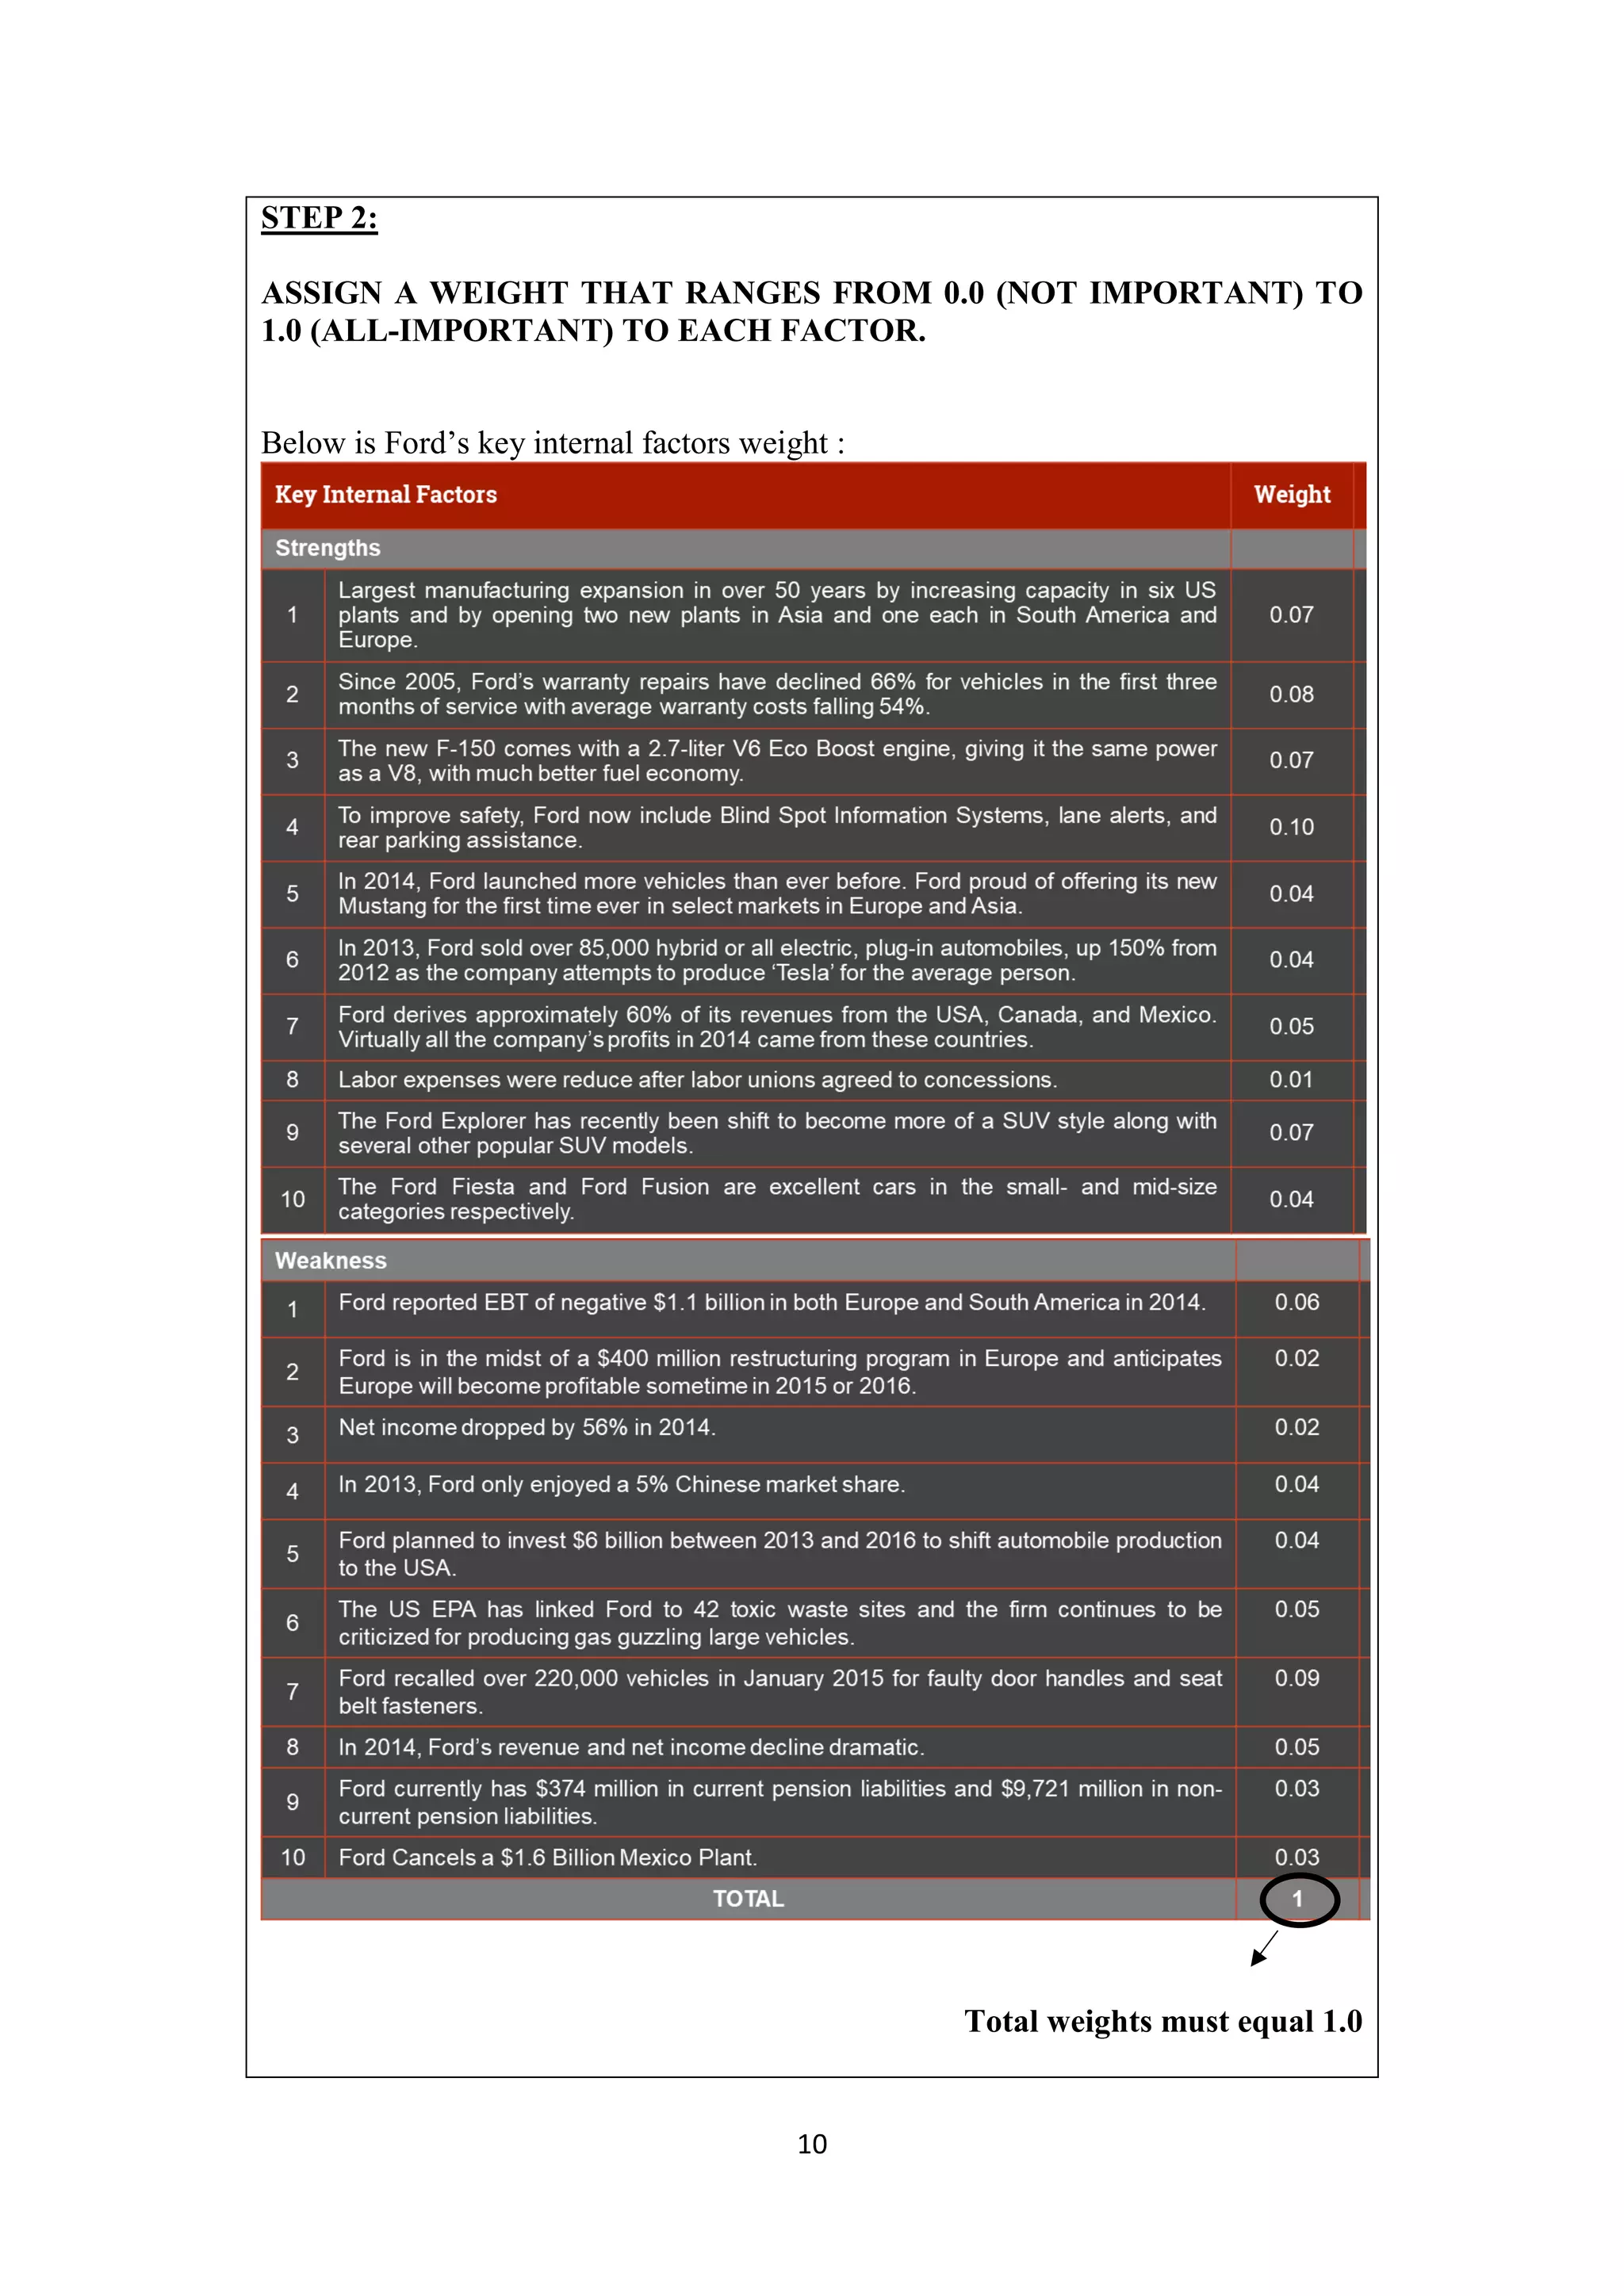
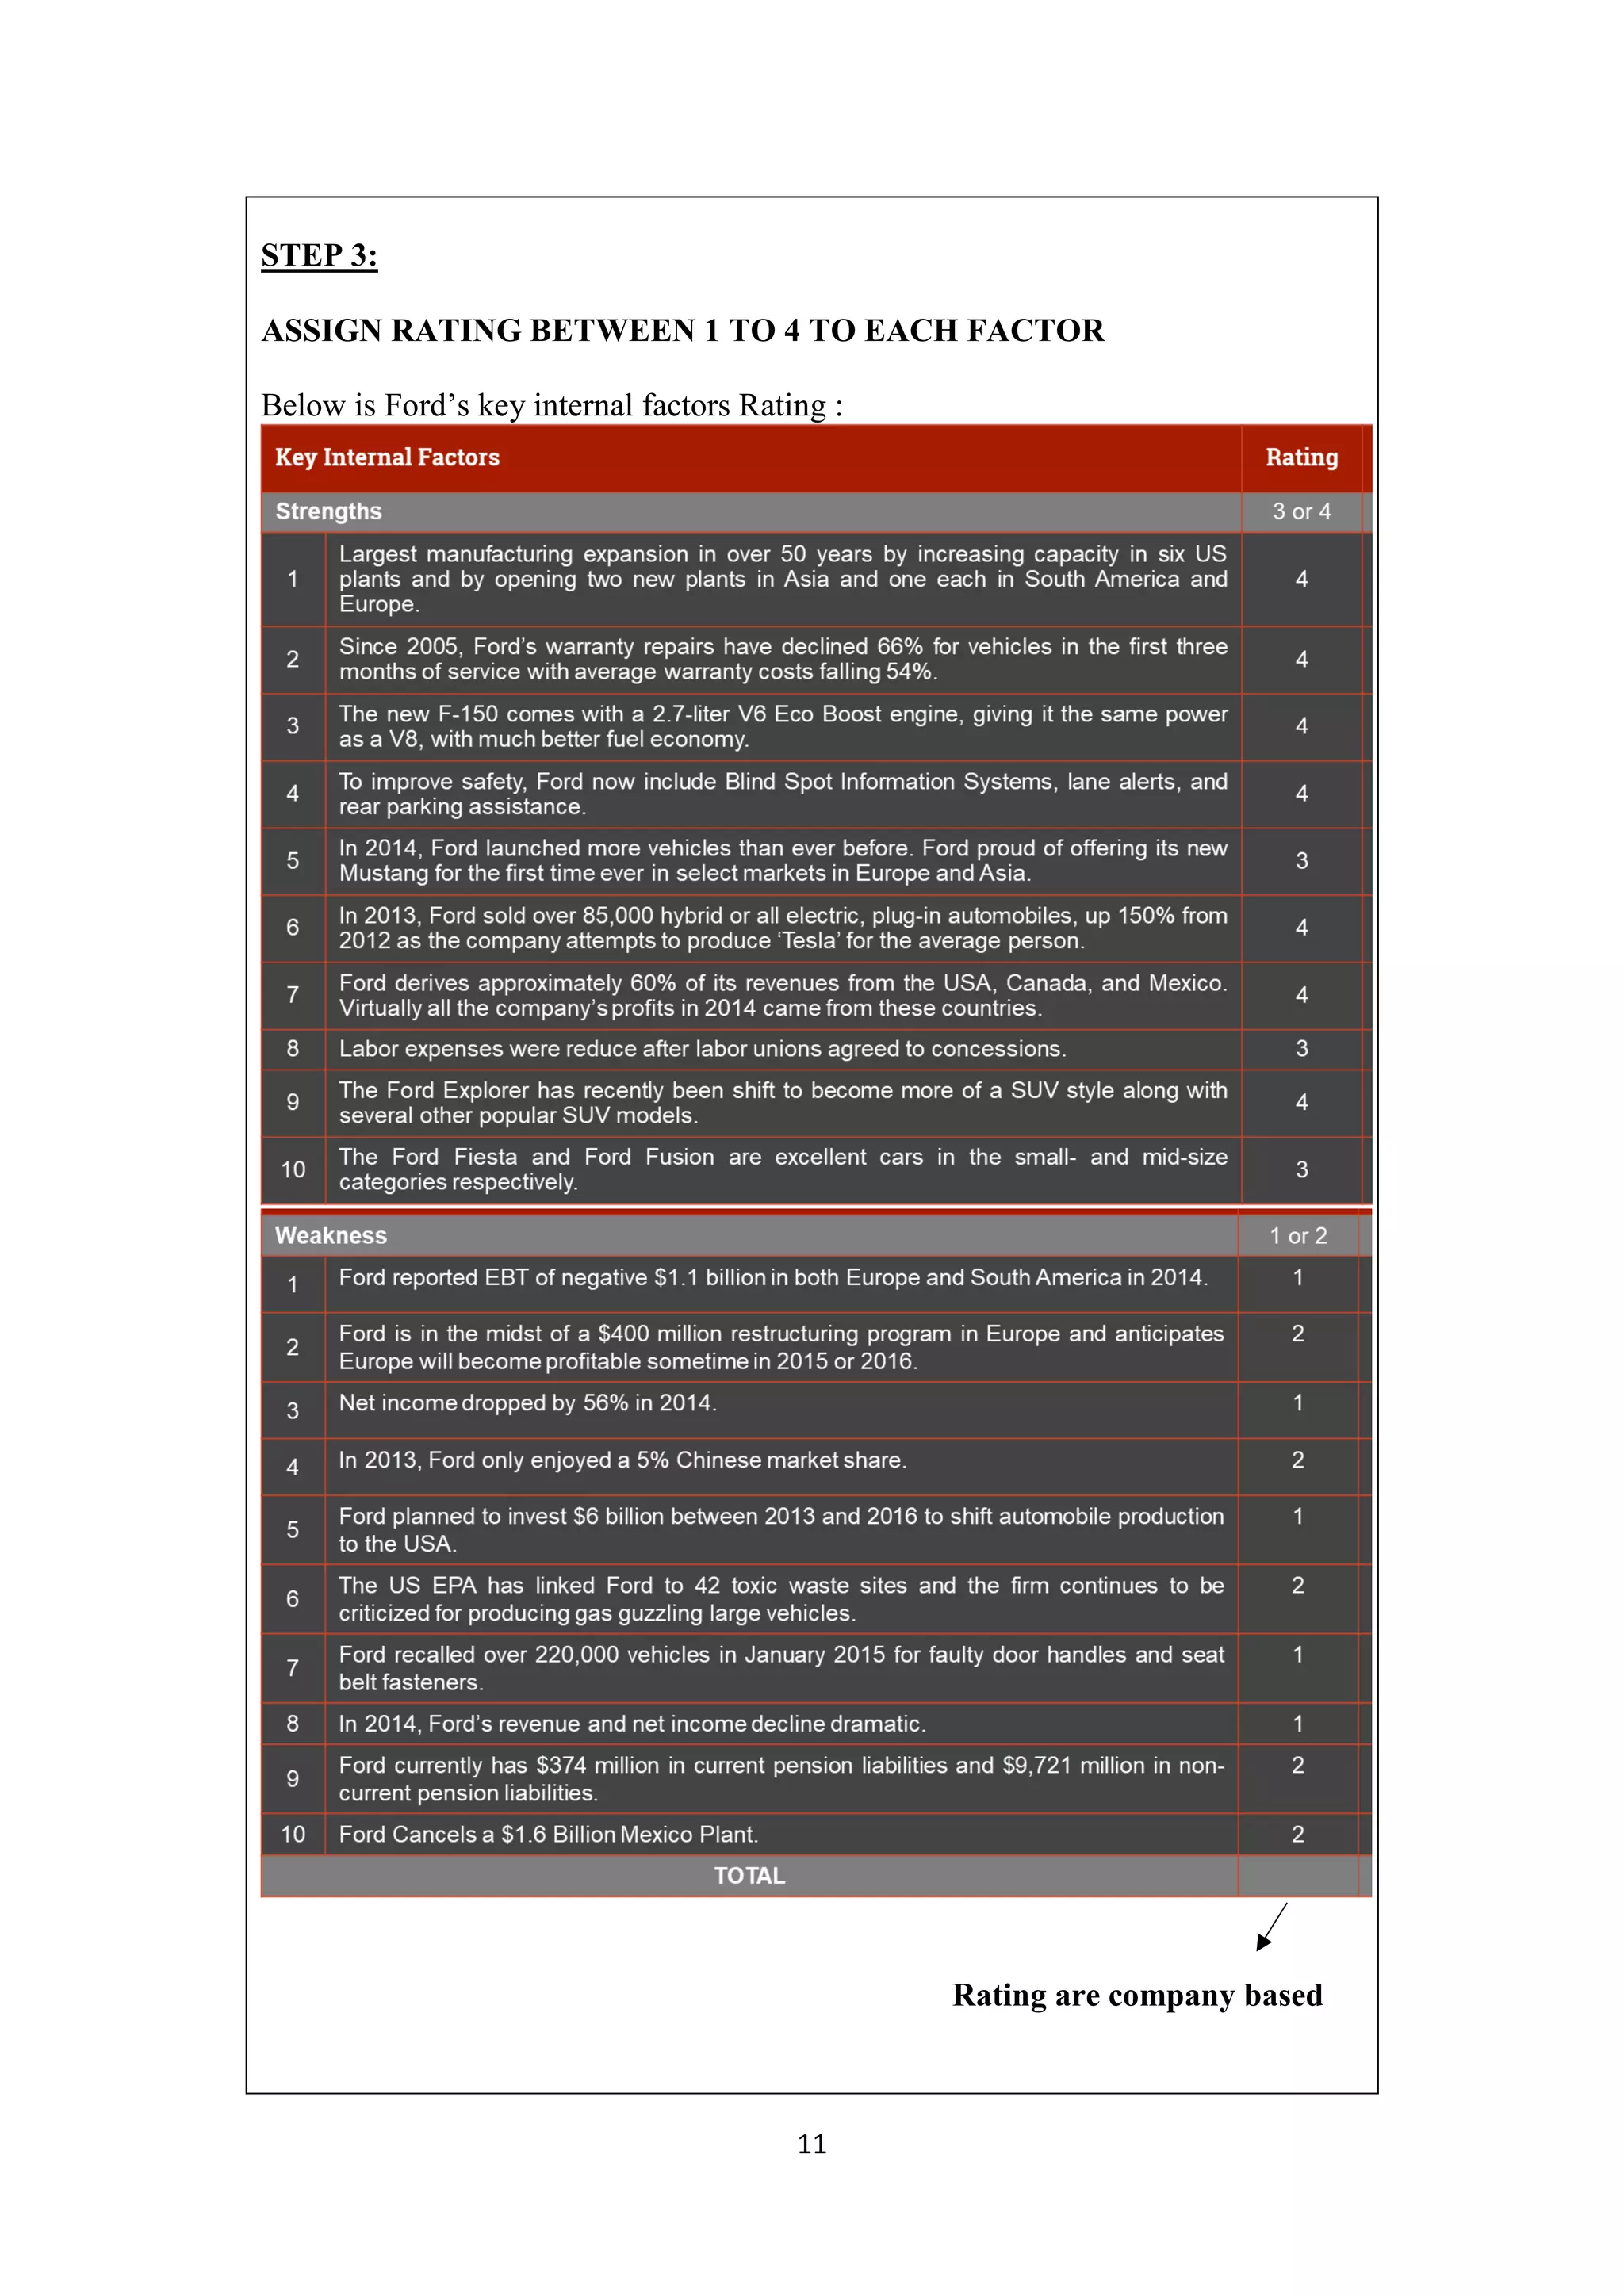
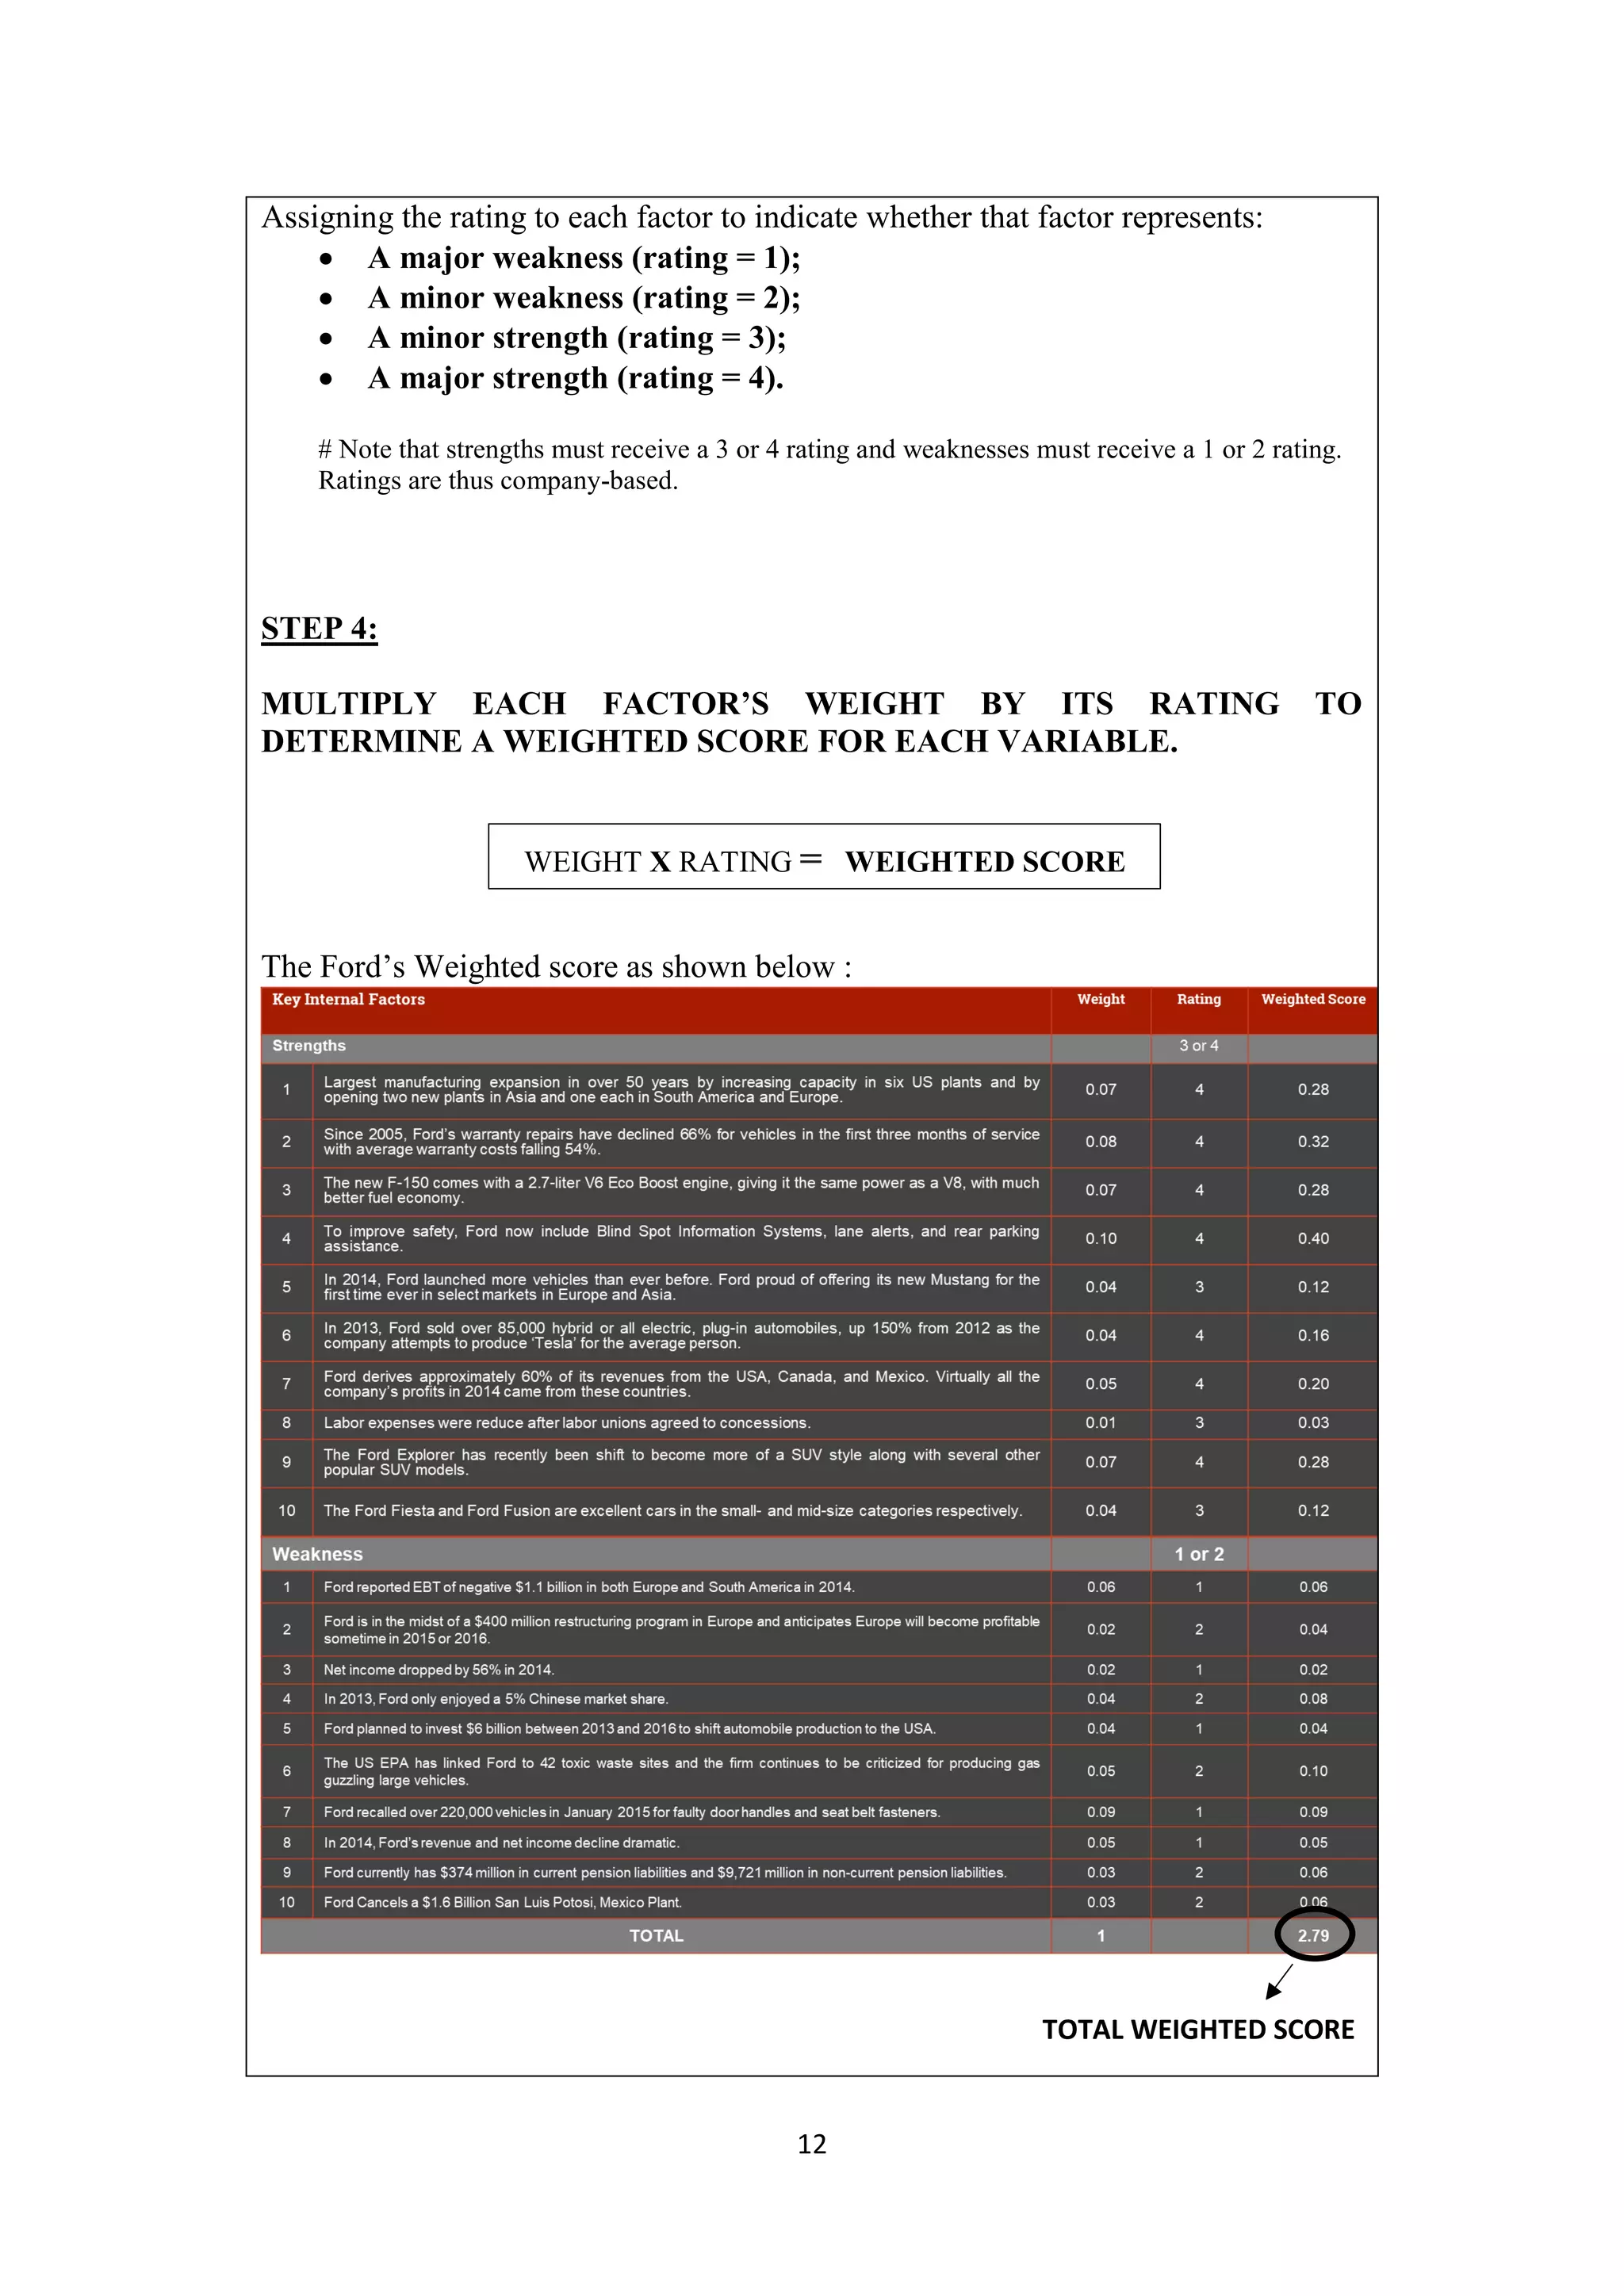
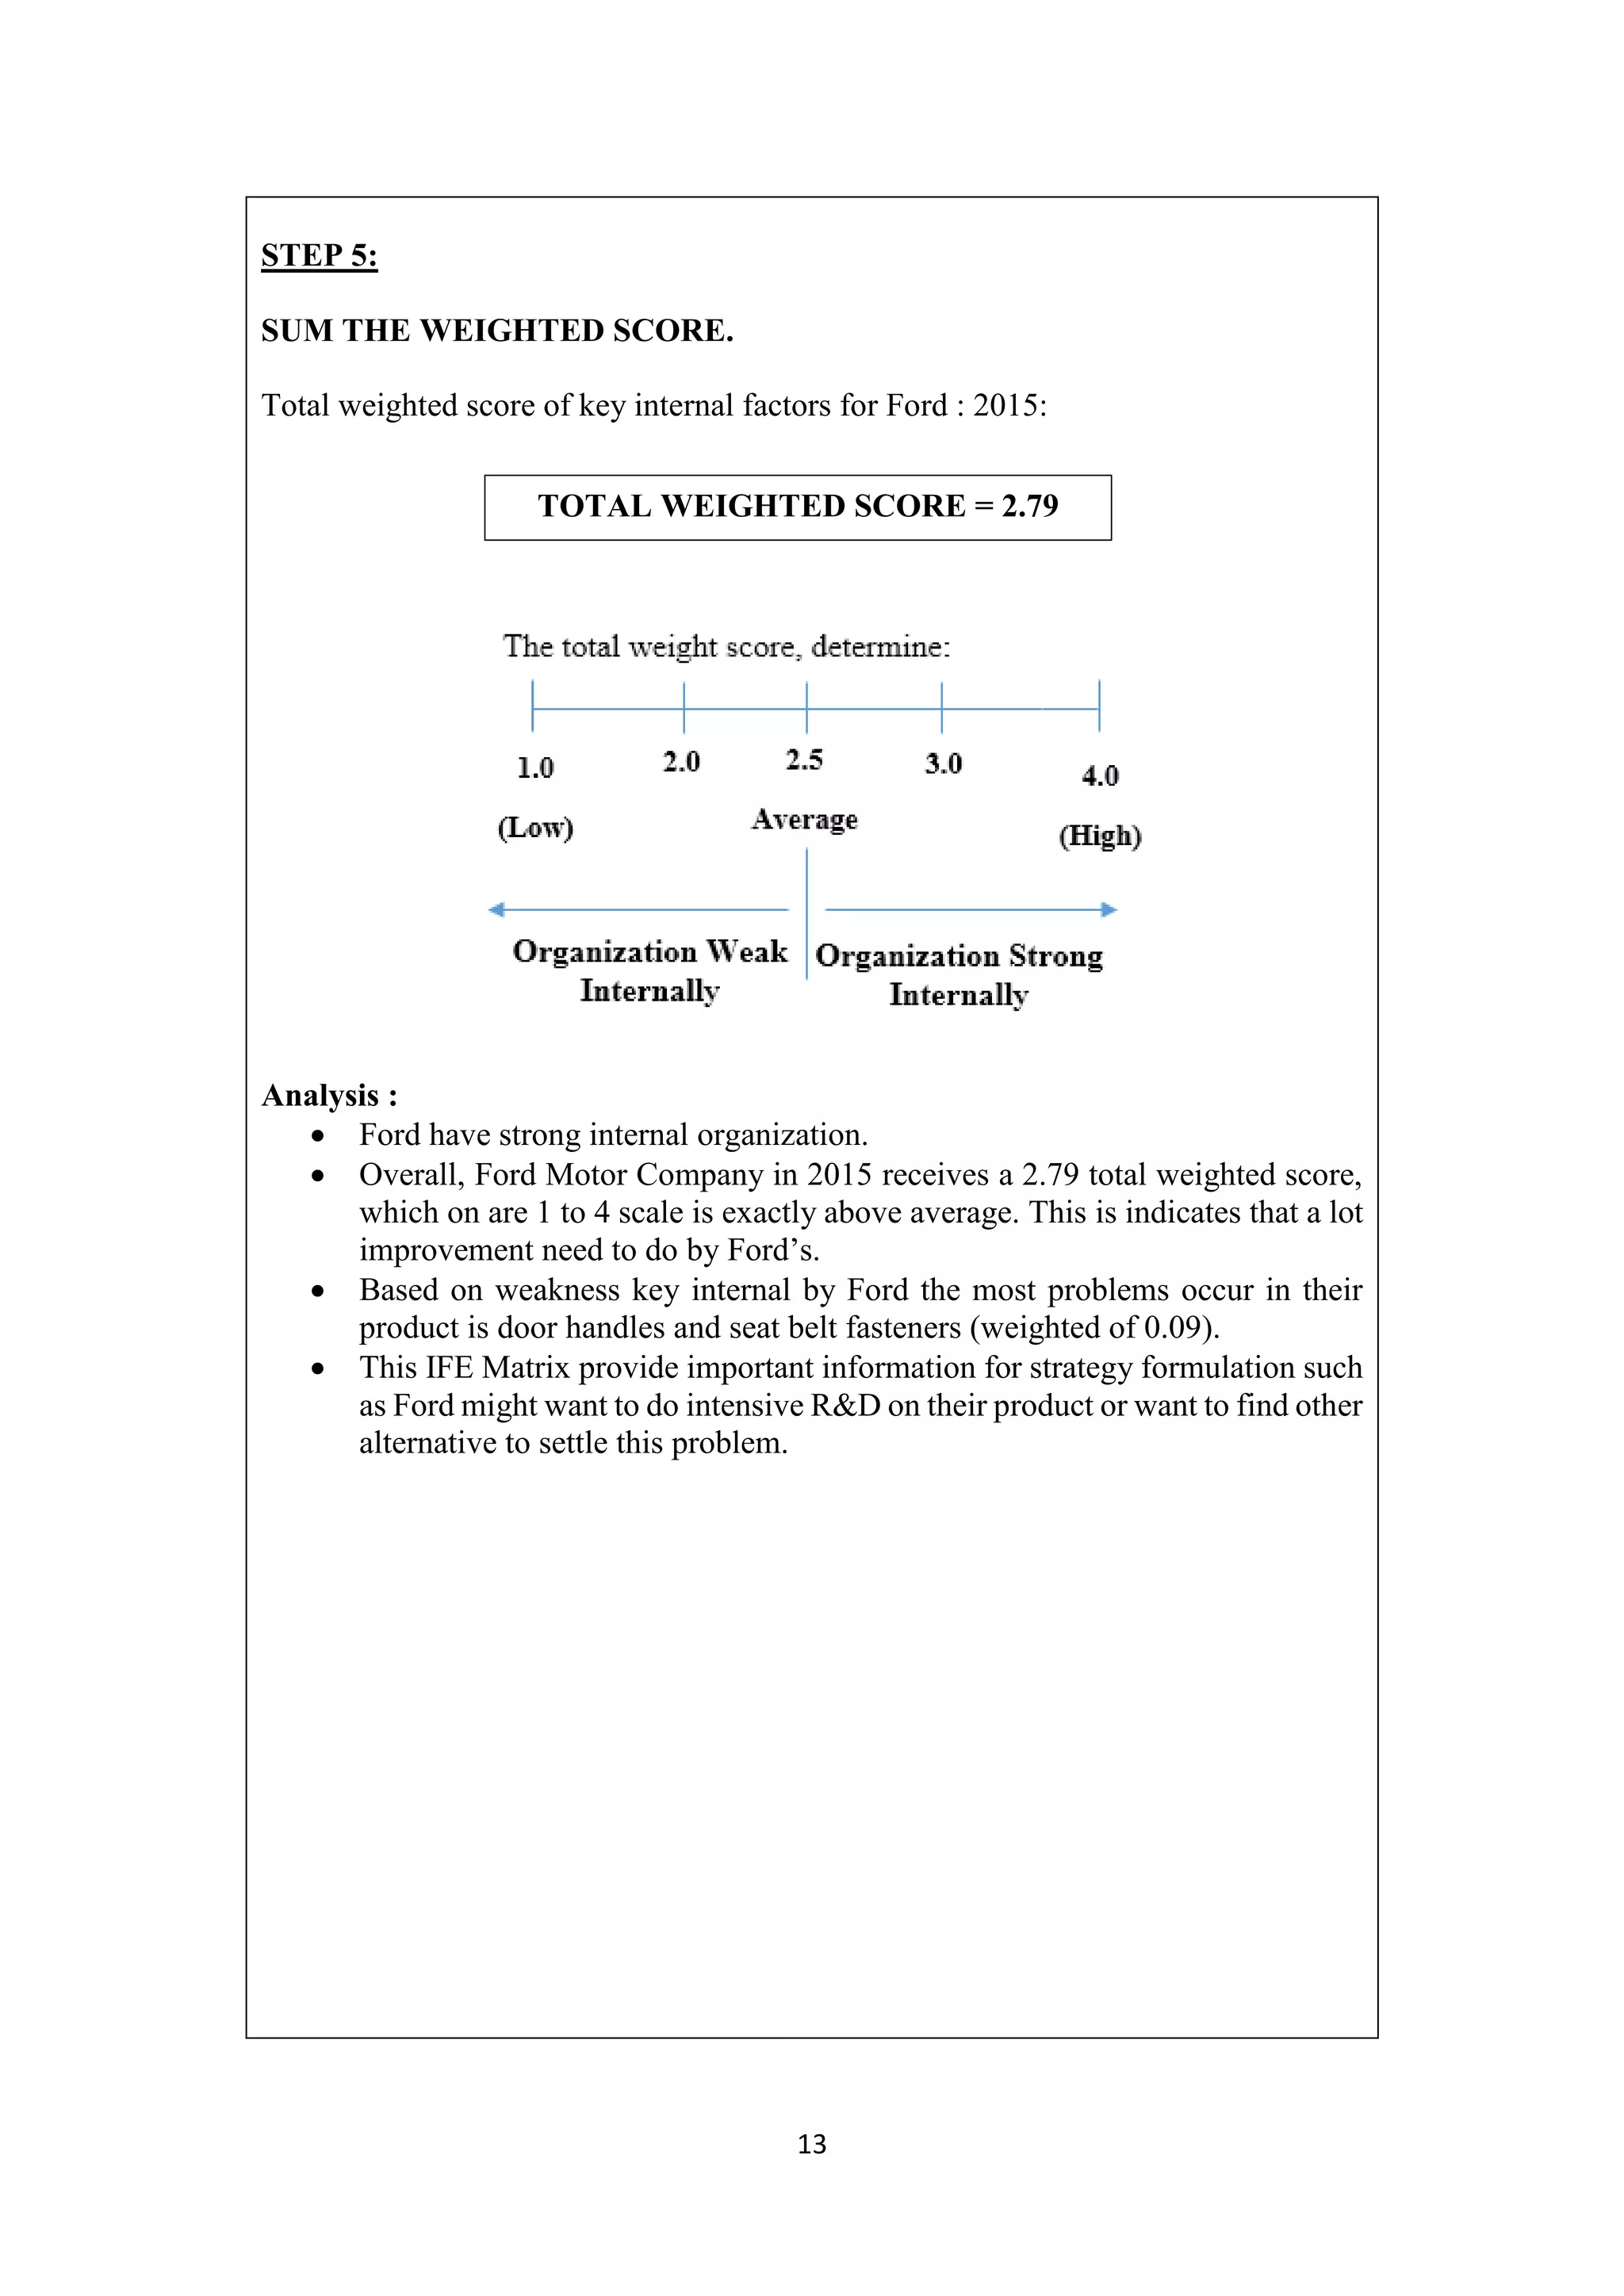
1
________________________________________________
AZMAN HASHIM INTERNATIONAL BUSINESS SCHOOL
TOPIC:
CHAPTER 6:
CONSTRUCTING AN INTERNAL FACTOR EVALUTION (IFE) MATRIX
FOR FORD MOTOR: 2015
LECTURER NAME:
MR LOKMAN BIN ALI
PREPARE BY GROUP 10
NAMES: MATRIC NO:
NURHIMA BINTI HASSAN A17HA0196
ASYSYUARAH BINTI TUAH A17HA0016
ZULPADHLI BIN SALUDIN A17HA0296
DATE SUBMISSION:
14 NOVEMBER 2018
SM/SHAD/S01/G10
2
IFE MATRIX
According to book of Strategic Management, Sixteenth Edition, by David
1.0 : INTRODUCTION
According to Fred R. David, in his book of Strategic Management Sixteenth
Edition, the strategic management process consists of three stages, which is Strategy
Formulation, Strategy Implementation and Strategy Evaluation. However, the
process of identifying or determining internal strengths and weaknesses factors of an
organization is included in the Strategy Formulation.
A summary step in conducting and internal strategic-management audit is to
construct an Internal Factor Evaluation (IFE) Matrix. It allow strategies be
conducted. The purposes of IFE Matrix is shown below:
 To summarizes and evaluates the major strengths and weaknesses in the
functional of business.
 Provides a basis for identifying and evaluating relationships among those
areas.
When developing an IFE Matrix, intuitive judgments are being required. Intuitive
judgment means a decision reached based on subjective feeling. Therefore, the
appearance of scientific approach should not interpreted. The authors also claims that
a thorough understanding of the factors included is more important than the actual
number.
3
2.0 : DEVELOPS AN IFE MATRIX
An IFE Matrix can be developed in five steps.
STEP 1:
LIST 20 KEY INTERNAL FACTORS AS IDENTIFIED IN THE INTERNAL-
AUDIT PROCESS.
The 20 internal factors, includes the listing of 10 strengths and 10 weaknesses factors
of an organization. The list of the factors should be specific as possible, it may using
percentages, ratios or comparative numbers. In addition, the factors included should
be ‘Action-able’ and divisional as possible.
The example as shown below :
Table 6-8 Sample Internal Factor Evaluation Matrix for a Retail Computer Store
Key Internal Factors Category
Strengths
1. Inventory turnover increased from 5.8 to 6.7. Production
2. Average customer purchase increased from $97 to $128. Sales
3. Employee morale is excellent. Management
4. In-store promotions resulted in 20% increase in sales. Marketing
5. Newspaper advertising expenditures increased 10%. Advertising
6. Revenues from repair/service in the store up 16%. Service
7. In-store technical support personnel have MIS college
degrees.
CSR
8. Store’s debt-to-total assets ratio declined to 34%. Finance
9. Revenues per employee up 19%. Finance
Weaknesses
1. Revenues from software segment of store down 12%. Finance
2. Location of store negatively impacted by new Highway 34. Operation
3. Carpet and paint in store somewhat in disrepair. Service
4. Bathroom in store needs refurbishing. Customer Service
5. Revenues from businesses down 8%. Finance
6. Store has no website. Marketing
7. Supplier on-time delivery increased to 2.4 days. Service
8. Often customers have to wait to check out Customer Service
4
STEP 2:
ASSIGN A WEIGHT THAT RANGES FROM 0.0 (NOT IMPORTANT) TO
1.0 (ALL-IMPORTANT) TO EACH FACTOR.
The weight assigned to a given factor indicates the relative importance of the factor
to being the successful in the firm’s industry. The Factors considered to have greatest
effect on the organization performance should assigned the highest weight. Both
strengths and weaknesses can received high weights. Moreover, the summation of
all weight must be equal to 1.0. The weight given is actually an industry-based.
The example as shown below :
Table 6-8 Sample Internal Factor Evaluation Matrix for a Retail Computer Store
Total weights must equal 1.0
5
STEP 3:
ASSIGN RATING BETWEEN 1 TO 4 TO EACH FACTOR
Assigning the rating to each factor to indicate whether that factor represents a major
weakness (rating = 1), a minor weakness (rating = 2), a minor strength (rating = 3),
or a major strength (rating = 4). Note that strengths must receive a 3 or 4 rating and
weaknesses must receive a 1 or 2 rating. Ratings are thus company-based.
The example as shown below :
Table 6-8 Sample Internal Factor Evaluation Matrix for a Retail Computer Store
Rating are company based
6
STEP 4:
MULTIPLY EACH FACTOR’S WEIGHT BY ITS RATING TO
DETERMINE A WEIGHTED SCORE FOR EACH VARIABLE.
The example as shown below :
Table 6-8 Sample Internal Factor Evaluation Matrix for a Retail Computer Store
WEIGHT X RATING = WEIGHTED SCORE
7
STEP 5:
SUM THE WEIGHTED SCORE.
Sum the weighted scores for each variable to determine the total weighted score for
the organization. Regardless of how many factors are included in an IFE Matrix, the
total weighted score can range from a low of 1.0 to a high of 4.0, with the average
score being 2.5. Total weighted scores well below 2.5 characterize organizations that
are weak internally, whereas scores significantly above 2.5 indicate a strong internal
position.
Analysis:
 This store receives a 2.5 total weighted score, which on a 1 to 4 scale is
exactly average/ halfway, indicating there is definitely room for improvement
in store operations, strategies, policies, and procedures.
 The IFE Matrix provides important information for strategy formulation.
 This retail computer store might want to hire another checkout person and
repair its carpet, paint, and bathroom problems.
 The store may want to increase advertising for its repair/services, because that
is a really important (weight 0.15) factor to being successful in this business
8
CASE STUDY FORD MOTOR COMPANY : 2015
3.0 : FORD IFE MATRIX IN 2015
Below is the Ford: 2015 IFE Matrix in five steps.
STEP 1:
LIST 20 KEY INTERNAL FACTORS AS IDENTIFIED IN THE INTERNAL-
AUDIT PROCESS.
There are total of 20 internal factors, includes the listing of 10 strengths and 10
weaknesses factors of Ford. The list of the factors should be specific as possible, it
may using percentages, ratios or comparative numbers. In addition, the factors
included should be ‘Action-able’ and divisional as possible
The Ford internal factors as shown below :
Key Internal Factors
Strengths Category
1. Ford is engaged in its largest manufacturing expansion in
over 50 years by increasing capacity in six US plants and
by opening two new plants in Asia and one each in South
America and Europe. The US plants alone are having $6
billion of improvements. Ford’s F-150 pickup truck is the
most popular truck in the world for 32 years running.
Production &
Operation
2. Since 2005, Ford’s warranty repairs have declined 66%
for vehicles in the first three months of service with
average warranty costs falling 54%
Warranties
3. The new F-150 comes with a 2.7-liter V6 Eco Boost
engine, giving it the same power as a V8, with much
better fuel economy.
R&D
4. To improve safety, many Ford products now include
Blind Spot Information Systems, lane alerts, and rear
parking assistance.
R&D
5. In 2014, Ford launched more vehicles than ever before in
a single calendar year, including a new Mustang and F-
150. Ford is especially proud of offering its Mustang for
the first time ever in select markets in Europe and Asia.
Marketing
&
Production
6. In 2013, Ford sold over 85,000 hybrid or all electric,
plug-in automobiles, up 150% from 2012 as the company
attempts to produce what one executive called a Tesla for
the average person.
R&D,
Marketing &
Production
7. Ford derives approximately 60% of its revenues from the
USA, Canada, and Mexico. Virtually all the company’s
profits in 2014 came from these countries.
Finance
9
8. Labor expenses was reduce after labor unions agreed to
concessions.
Management
& Finance
9. The Ford Explorer has recently been shift to become
more of a SUV style along with several other popular
SUV models.
R&D
Marketing
10. The Ford Fiesta and Ford Fusion are excellent cars in the
small and midsize categories respectively.
Pricing &
Production
Weaknesses
1. Ford reported EBT of negative $1.1 billion in both
Europe and South America in 2014.
Finance
2. Ford is in the midst of a $400 million restructuring
program in Europe and anticipates Europe will
become profitable sometime in 2015 or 2016.
Finance &
CSR
3. Net income dropped by 56% to $3,187 billion in 2014. Finance
4. In 2013, Ford only enjoyed a 5% China market share. Finance
5. Ford planned to invest $6 billion between 2013 and 2016
to shift automobile production to the USA.
Management
& Operation
6. The US EPA has linked Ford to 42 toxic waste sites and
the firm continues to criticized for producing gas
guzzling large vehicles.
R&D
7. Ford recalled over 220,000 vehicles in January 2015 for
faulty door handles and seat belt fasteners.
Warranties
8. In 2014, Ford’s revenue decline dramatic in net income. Finance
9. Ford currently has $374 million in current pension
liabilities and $9,721 million in non-current pension
liabilities.
Finance
10. Ford Cancels a $1.6 Billion Mexico Plant. Finance &
Management
10
STEP 2:
ASSIGN A WEIGHT THAT RANGES FROM 0.0 (NOT IMPORTANT) TO
1.0 (ALL-IMPORTANT) TO EACH FACTOR.
Below is Ford’s key internal factors weight :
Total weights must equal 1.0
11
STEP 3:
ASSIGN RATING BETWEEN 1 TO 4 TO EACH FACTOR
Below is Ford’s key internal factors Rating :
Rating are company based
12
Assigning the rating to each factor to indicate whether that factor represents:
 A major weakness (rating = 1);
 A minor weakness (rating = 2);
 A minor strength (rating = 3);
 A major strength (rating = 4).
# Note that strengths must receive a 3 or 4 rating and weaknesses must receive a 1 or 2 rating.
Ratings are thus company-based.
STEP 4:
MULTIPLY EACH FACTOR’S WEIGHT BY ITS RATING TO
DETERMINE A WEIGHTED SCORE FOR EACH VARIABLE.
The Ford’s Weighted score as shown below :
WEIGHT X RATING = WEIGHTED SCORE
TOTAL WEIGHTED SCORE
13
STEP 5:
SUM THE WEIGHTED SCORE.
Total weighted score of key internal factors for Ford : 2015:
Analysis :
 Ford have strong internal organization.
 Overall, Ford Motor Company in 2015 receives a 2.79 total weighted score,
which on are 1 to 4 scale is exactly above average. This is indicates that a lot
improvement need to do by Ford’s.
 Based on weakness key internal by Ford the most problems occur in their
product is door handles and seat belt fasteners (weighted of 0.09).
 This IFE Matrix provide important information for strategy formulation such
as Ford might want to do intensive R&D on their product or want to find other
alternative to settle this problem.
TOTAL WEIGHTED SCORE = 2.79
14
OTHER RESOURCES
KEY INTERNAL STRENGTH
FORD : 2015
Key Internal Factors Weight Rating
Weighted
Score
Strengths 3 or 4
1.
Largest manufacturing expansion in over
50 years by increasing capacity in six US
plants and by opening two new plants in
Asia and one each in South America and
Europe.
0.07 4 0.28
Internet:
“To meet surging customer demand for our top-selling cars, utilities and trucks,
we are continuing to run our North American facilities at full manned capacity,
and we will add 200,000 units of annual straight-time capacity this year,”
- Jim Tetreault,
 Ford plans to add close to 3,500 hourly jobs to meet customer demand
for the company’s best-selling vehicles.
To meet customer demand for Ford vehicles, the company will add nearly
3,500 hourly jobs in 2013. With its latest announcement of more than 2,000
new jobs at Kansas City Assembly Plant, as well as more than 1,400 new jobs
at Flat Rock Assembly Plant, Ford is three-quarters of the way to its plan to
create 12,000 hourly jobs in the United States by 2015. The company hired
more than 8,000 salaried and hourly employees in the U.S. last year.
 Ford will add an additional 200,000 units of annual straight-time
capacity this year after increasing annual straight-time capacity by
400,000 units in the region last year.
The 200,000 unit annual straight-time capacity additions this year will come
from Chicago Assembly Plant, Flat Rock Assembly Plant and Kansas City
Assembly Plant, including increased production of some of Ford’s best-
selling vehicles including Ford Explorer, Ford Fusion and Ford F-Series.
15
 Ford will shorten its summer shutdown from the traditional two weeks
to one week for a majority of North American assembly plants,
increasing production by an extra 40,000 units.
Six assembly plants, will take a reduced summer shutdown this year. The
assembly plants taking one week of shutdown are Chicago Assembly,
Cuautitlán Assembly, Hermosillo Stamping and Assembly, Kentucky
Truck, Michigan Assembly and Oakville Assembly.
Key Internal Factors Weight Rating
Weighted
Score
Strengths 3 or 4
2.
Since 2005, Ford’s warranty repairs have
declined 66% for vehicles in the first
three months of service with average
warranty costs falling 54%.
0.08 4 0.32
Internet:
Ford Motor Company's steady vehicle quality improvement in recent years is
beginning to translate into significant savings for the company and fewer
repairs. These savings can attributed to four straight years of quality
improvements on Ford, Lincoln, and Mercury vehicles.
Ford have made significant strides toward improving quality since 2005.
One-way ford track this is in the incidence of warranty repairs per 1,000
vehicles in the first 3 months of service. Global warranty repairs have fallen
66% from 2005 to 2013. As the incidence of repair has come down, so has
the average warranty cost per unit in the first 3 months in service. Over the
same period, global warranty repair cost per unit has improved by 54%,
including improvements of more than 70% in Asia Pacific Africa, more than
60% in Europe and South America, and about 45% in North America.
Key Internal Factors Weight Rating
Weighted
Score
Strengths 3 or 4
3.
The new F-150 comes with a 2.7-liter V6
Eco Boost engine, giving it the same
power as a V8, with much better fuel
economy.
0.07 4 0.28
16
Textbook:
The 2015 F-150 will be available with a 2.7-Liter Eco-Boost V6 that ramps
up the MPG even more. It reduces mass by using iron and aluminum and it is
capable of more than 300hp in a lightweight and compact design. The 2.7-
Liter Eco-Boost will also be the first Ford truck engine with automatic
stop/start capability. Specifically tuned for truck customers, this technology
shuts off the engine when the vehicle is at a stop (except when towing or in
four-wheel drive). Once the brake released, the engine restarts quickly.
Base on review and experiment that had done by DAVID BOOTH and
DEREK MCNAUGHTON about Ford f-150 fuel consumption. They said that
For a mere 2.7 liters, its ability to cruise even beyond 120 km/h and also
recorded about the same fuel economy at 120 — 11.4 L/100 kilometers, to be
exact , but also noted that consumption went down dramatically to 8.5
L/100km when they reduced speed to 100 km/h. Like many of Ford’s
EcoBoost engines, the 2.7L looks to specifically tuned to show its best on the
EPA’s dyno. It shows that the engine can save oil consumption and good for
customer because they can save on fuel.
Chart above show comparison of fuel consumption mile per-gallon over 100
miles while towing 4,200 pounds load. Ford f-150 3.5L and 2.7L with
Ecoboost consume fuel lower than other truck such as Ram 1500 Trademan,
Chevrolet Silverado 1500, and Chevrolet Colorado Z71
17
Key Internal Factors Weight Rating
Weighted
Score
Strengths 3 or 4
4.
To improve safety, Ford now include
Blind Spot Information Systems, lane
alerts, and rear parking assistance.
0.10 4 0.4
Internet:
The engineers at Ford have put plenty of thought into keeping drivers and
passengers safe when the unthinkable happens. The Ford Motor Company
has always considered the safety of their customers to be one their most
important jobs. This is apparent in the approach they take to ensuring the
safety of their vehicles, and the customer that drive and ride in them.
Base on the illustration above it show that the latest safety feature that ford
installed on their vehicle.
Key Internal Factors Weight Rating
Weighted
Score
Strengths 3 or 4
5.
In 2014, Ford launched more vehicles
than ever before in a single calendar year,
including a new Mustang and F-150. Ford
is especially proud of offering its Mustang
for the first time ever in select markets in
Europe and Asia.
0.04 3 0.12
18
Internet:
The all-new F-150 launched in the fall of 2014 is the first mass-market pickup
truck with an aluminum-alloy body, which improves fuel economy. In
addition, its stronger steel frame contains more high-strength steel, which
enables the F-150 to tow even heavier loads.
2014 Ford F-150 2018 Ford F-150 2019 Ford F-150
Aggressive new car launches these past two years, including the launches of
the F-150, Mustang and Edge, succeeded in setting new business performance
records for Ford in the second quarter of 2015. Ford reported its highest
quarterly profit in 15 years, with a pre-tax profit of USD 2.9 billion and net
income of USD 1.9 billion.
More than 8,000 Mustangs sold in Europe; customers show preference for
fastback body style, 421 PS 5.0-litre V8 engine, and Race Red and Magnetic
Grey colors
2014 Ford Mustang
2018 Ford Mustang 2019 Ford Mustang
19
Analysis :
● Full year 2014 pre-tax profit of $6.3 billion, a decline of $2.3 billion
compared with a year ago; full year after-tax earnings, excluding special
items, were $1.16 per share, 47 cents lower compared with a year ago.
● Full year net income of $3.2 billion, or 80 cents per share.
● Automotive pre-tax profit of $4.5 billion; North America profitable and Asia
Pacific posted a record profit; Europe and Middle East & Africa both
improved; South America reported a loss.
● Wholesale volume about equal to a year ago and company revenue down 2
percent; achieved record market share in Asia Pacific, driven by record share
in China.
● Best results at Ford Credit since 2011.
● Record-setting year of 24 vehicles launched globally, including the all-new
F-150, Mustang, Escort, Kia, Transit and Lincoln MKC.
20
Key Internal Factors Weight Rating
Weighted
Score
Strengths 3 or 4
6.
In 2013, Ford sold over 85,000 hybrid or
all electric, plug-in automobiles, up 150%
from 2012 as the company attempts to
produce what one executive called a Tesla
for the average person.
0.04 4 0.16
Internet:
21
 Calendar year 2013 hybrid market sales saw the Prius “family” decline from
2012 totals. This was presumably due to new competition, particularly from
Ford.
 The huge increase in sales means that Ford is now second only to Toyota
concerning hybrid vehicle sales in the US. In addition, Ford’s share of the US
hybrid market is continuing to grow.
 Ford has attributed the big increase in sales to the strength of its new array of
electrified vehicles :
US Hybrid Sale for December 2013
22
2013 FORD C-MAX HYBRID
$ 8,771
2013 FORD C-MAX ENERGI
$ 10,071
2013 FORD FUSION ENERGI
$ 15,717
2013 FORD FUSION HYBRID
$11,294
2013 LINCOLN MKZ HYBRID
$13,540
23
Key Internal Factors Weight Rating
Weighted
Score
Strengths 3 or 4
7.
Ford derives approximately 60% of its
revenues from the USA, Canada, and
Mexico. Virtually all the company’s
profits in 2014 came from these countries.
0.05 4 0.20
 The North American Free Trade Agreement entered into force on January
1, 1994, eliminating most barriers to free trade between the United States,
Canada, and Mexico.
 Ford Motor Company was one of many companies able to benefit by
optimizing its manufacturing operations without the distortion of tariffs
and other customs barriers. Today the Company has three manufacturing
facilities in Mexico:
 There are several benefits to Ford of manufacturing in Mexico:
i. The country has a relatively skilled and low-cost labor force.
ii. Well located geographically to ship to the U.S. or South America.
24
iii. Has wide-ranging trade agreements, and has government policies
promoting exports.
iv. Increasing number of Mexican graduates from engineering and
technical schools, which have expanded the pool of skilled labor.
v. The country’s “maquiladora” program also allows for duty-free
importation of raw materials, components and equipment needed in
the manufacture of goods for subsequent export.
 Hourly Manufacturing Compensation by Country
Key Internal Factors Weight Rating
Weighted
Score
Strengths 3 or 4
8.
Labor expenses was reduce after labor
unions agreed to concessions.
0.01 3 0.03
Textbook:
In 2007, Ford reached an agreement with the UAW on retirement benefits
and other costs. The company was able to avoid a government takeover,
unlike its counterpart, General Motors.
Wages, the second-largest expense, historically have been about $70,000 per
employee in the United States and account for 5 percent of total revenue
expenses. Higher commodity prices and wage expenses forced GM and
Chrysler to reach similar cost-cutting labor agreements in concessionary deal
with United Auto Workers.1
Finally, Labor expenses were reduce after labor
unions agreed to concessions.
Internet:
United Auto Workers union leaders urged members to approve a
concessionary deal with Ford Motor Co, stepping up the pressure on General
1
Union leaders urge vote for Ford agreement
25
Motors Corp and Chrysler to reach similar cost-cutting labor agreements. The
UAW agreement, which includes concessions, intended to reduce operating
costs and a change in the way Ford funds a union-aligned healthcare trust,
aimed at making Ford competitive with the U.S. operations of foreign
carmakers. The agreement includes no reductions in UAW base hourly pay,
but would suspend cost-of-living adjustments, performance bonuses and the
Christmas bonus.
Ford's new four-year UAW contract may appear rich, but it increases labor
costs by less than 1.5% a year. The costs of the four-year deal are in keeping
with the company's projections both short and long term, and in line with
inflation projections. Noting the deal is no more expensive than if Ford had
adopted the same agreement that the UAW negotiated with General Motors.
Importantly, Ford feels its labor costs —, which increase to $60 an hour with
benefits in 2019 from $57 now — eliminates the labor cost gap to GM and
narrows the gap with lower-cost Fiat Chrysler Automobiles. Ford's labor cost
will remain $8-$10 an hour higher than Japanese rivals Toyota and Honda.2
Key Internal Factors Weight Rating
Weighted
Score
Strengths 3 or 4
9.
The Ford Explorer has recently been shift
to become more of a SUV style along
with several other popular SUV models.
0.07 4 0.28
Textbook:
2
Ford: UAW deal brings costs even with GM, close to FCA
26
 Market share of Cross Over and SUV Vehicles (Ford Explorer)
Exhibit 9 reveals the percent of revenue of various classes of vehicle.
Crossover utility vehicles have taken much of the demand away from SUVs,
which account for only 10 percent of total U.S. market share. These vehicles
look much like an SUV, but are built on car chasses and lack the towing power
of an SUV. They also tend to get much better gas mileage, as automakers
started applying hybrid technology to crossovers before SUVs. Notable SUVs
include the Ford Flex, Toyota Venza, and Dodge Journey. The Ford Explorer
has recently been shifted to become more of a SUV style along with several
other popular SUV models.
Internet:
According to USA Today (2017), Ford has once again made some changes to
its Ford Explorer SUV. The updates on the Ford Explorer include a new grille
and redesigned fog lamps. It also offered in four new colors and with five
new wheel choices. The Explorer helped define the SUV segment and sales
in the U.S. peaked at 445,000 in 2000. Nearly 7 million have sold since the
SUV debuted in 1990. Ford will rethink to make it more fuel-efficient and
nimble to drive. Explorer has been a popular and successful vehicle.3
Chart 1: Comparison Car Sales by three model
Picture 1:
Toyota Highlander
Picture 2:
Chevrolet Traverse
Picture 3:
Ford Explorer
3
Ford updates looks of the 2018 Explorer SUV with new grille
27
USA Today (2017) claimed that Ford Explorer has become one of the nation's
most popular police cruisers. It just crossed the 50% market share threshold for
the first time since it introduced in 2012.4
Picture 4: Ford Explorer Police Interceptor
Key Internal Factors Weight Rating
Weighted
Score
Strengths 3 or 4
10.
The Ford Fiesta and Ford Fusion are
excellent cars in the small- and mid-size
categories respectively.
0.04 3 0.12
Textbook:
 Market Share of Subcompact (Ford Fiesta)
The smaller cars popular include the Ford Fiesta and the Chevrolet Sonic
which can start as low as $15,000.
 Market Share of Midsize Cars (Ford Fusion)
Midsize cars are also extremely popular, taking much of the market share
away from larger vehicles. The Ford Fusion, Chevy Malibu, Dodge Charger,
and Toyota Camry are examples of midsize vehicles.
Internet:
 Subcompact cars are the smallest and least expensive vehicles on the market,
but their low prices are not their only appeal.5
4
Nation's most popular police car is now an SUV
5
Best Subcompact Cars
2018 Ford Fiesta
$14,205 - $21,285 MSRP
2018 Chevrolet Sonic
$15,295 - $21,320 MSRP
2018 Toyota Yaris
$15,950 - 17,050
28
*MSRP=Manufacturer Suggested Retail Price
 Midsize cars are one of the most popular types of vehicles with consumers,
and with good reason. When it comes to commuting, hauling the kids around
town, or road tripping, few types of cars balance space, comfort, fuel
economy, and performance as well as the best midsize cars do.6
Graph 2: Comparison Car Sales on Small/ Subcompact Cars
Graph 2 shown that Chevrolet Sonic sales dramatically decline in 2014, while
Ford Fiesta sales are more than Chevrolet Sonic in the same year. Toyota
Yaris is not so popular on small/subcompact cars market share.
 Midsize cars are one of the most popular types of vehicles with consumers,
and with good reason. When it comes to commuting, hauling the kids around
town, or road tripping, few types of cars balance space, comfort, fuel
economy, and performance as well as the best midsize cars do.
6
Best Midsize Cars
29
Graph 3: Comparison Car Sales on Midsize cars
Graph 3 shown that Toyota Camry are popular car on midsize cars.
The second popular are Ford Fusion and follow by Chevrolet Malibu.
30
OTHER RESOURCES
KEY INTERNAL WEAKNESSES
FORD : 2015
Key Internal Factors Weight Rating
Weighted
Score
Weakness
1.
Ford reported EBT of negative $1.1
billion in both Europe and South America
in 2014.
0.06 1 0.06
Textbook:
Pretax earnings is a company's income after all operating expenses, including
interest and depreciation, have been deducted from total sales or revenues,
but before income taxes have been subtracted. Also known as pretax income
or earnings before tax (EBT).
Internet:
 Ford automotive sector in South America Segment:
Base on charts above, full-year pre-tax loss was $1.2 billion; The
deterioration in all metrics was driven by unfavorable changes in the external
factors, which is effects of slowing GDP growth, lower industry volumes in
larger markets, weaker currencies, high inflation, as well as policy
uncertainty in some countries.
31
The decrease in pre-tax profit for 2014 compared with 2013 is more than
explained by unfavorable exchange, higher costs (primarily driven by higher
inflation), and lower volume, offset partially by favorable net pricing. The
higher net pricing reflects partial recovery of the adverse effects of high local
inflation and weaker local currencies, along with pricing associated with the
new products. The full year loss includes $426 million of adverse balance
sheet exchange effects, related primarily to the devaluation of the Venezuela
bolivar in the first quarter.
 Ford automotive sector in Europe Segment:
Base on charts above, Europe’s full-year wholesale volume and revenue were
up 5% and 8%, respectively, from a year ago. Operating margin was negative
3.6% and the pre-tax loss was $1.1 billion, both improved from a year ago.
The improvement in pre-tax results is more than explained by higher volume
and lower cost, offset partially by Russia and other factors, including lower
component pricing and parts and accessories profits.
Key Internal Factors Weight Rating
Weighted
Score
Weakness
2.
Ford is in the midst of a $400 million
restructuring program in Europe and
anticipates Europe will become profitable
sometime in 2015 or 2016.
0.02 2 0.04
32
Textbook:
In Europe, Ford expects reduced losses in 2014, including restructuring costs
of about $400 million that will be reported in 2014 operating results. The
Europe transformation plan continues to progress well and the business unit
remains on track to achieve profitability in 2015.
Internet:
 Business Restructuring – Europe
In October 2012, ford committed to commence a transformation plan for their
Europe operations. The plan included the closure of two U.K. facilities an
assembly plant in Southampton, and a stamping and tooling plant in
Dagenham in 2013 and a major assembly plant in Genk, Belgium by the end
of 2014.
Before finalizing separation plan in Genk, ford engaged in a consultation
process with the labor unions, which completed in June 2013. Separation-
related costs, recorded in Automotive cost of sales and Selling, administrative
and other expenses, include both the costs associated with the voluntary
separation programs in the U.K. and the involuntary employee actions at
Genk, as well as payments to suppliers. The following table summarizes the
separation-related activity, excluding pension, recorded in Accrued liabilities
and deferred revenue, for the period ended September 30 (in millions):
Ford current estimate of total separation-related costs for the U.K. and Genk
facilities is approximately $1 billion, excluding approximately $200 million
of pension-related costs.
Key Internal Factors Weight Rating
Weighted
Score
Weakness
3. Net income dropped by 56% in 2014. 0.02 1 0.02
33
Ford said that its net income for the 2014 plummeted 56% from the previous
year, primarily because of higher costs, lower volumes and a series of
surprising setbacks.Industry analysts said that Ford’s 2014 results were
mostly because Ford is investing heavily in revamping its product line-up,
launching 23 vehicles in 2014 Ford Motor Co. posted a 56-percent drop in
net income in 2014 to $3.2 billion, bogged down by the cost of introduction
of 22 new vehicles globally as well as by a drop in its share of the United
States auto market. While the carmaker earned $52 million in the fourth
quarter, it was much lower than the $3 billion posted in the same period in
2013, when the company benefited from favorable tax benefits. Heavy
investment to expand Asian operations and restructure its troubled European
division at the same time it was grappling with poor economic conditions in
South America and Europe.
Base on income statement above, it clearly show that net income dropped
from $7,182 billion in 2013 to $3,187 in 2014.
On February 13, 2013 Ford operation in Venezuelan effected by devaluation
of the bolivar, from an exchange rate of 4.3 bolivars to the U.S. dollar to an
exchange rate of 6.3 bolivars to the U.S. dollar. This resulted in a re-
measurement loss of $186 million in Automotive cost of sales in the first
quarter of 2013. In the fourth quarter of 2014, Ford incurred an $800-million
pretax charge related to currency devaluation in Venezuela.
34
Key Internal Factors Weight Rating
Weighted
Score
Weakness
4.
In 2013, Ford only enjoyed a 5% Chinese
market share.
0.04 2 0.08
Internet:
Investors and analysts monitor increases and decreases in market
share carefully, because this can be a sign of the relative competitiveness of
the company's products or services. Size of market share will affect company
revenue.
Reason why ford market share in china still small :
i. Compete with the $9,500 Chevrolet Sail
ii. Ford cars are expensive. In a market where 70 percent of vehicles sold
cost less than $14,500, Ford's cheapest car is the Fiesta, which starts at
$13,300.
iii. Ford's development costs are also steep compared with competitors'
because it still does much of the research and design for Chinese vehicles
at its headquarters in Dearborn, Michigan, where costs are relatively high.
35
Key Internal Factors Weight Rating
Weighted
Score
Weakness
5.
Ford planned to invest $6 billion between
2013 and 2016 to shift automobile
production to the USA.
0.04 1 0.04
Internet:
a. Automotive assembly compensation is approximately 80% lower in
Mexico then in the United States and low wages.
b. Mexico:
● Low production costs and low tariffs due to the broad reach of
Mexico’s Free Trade Agreements (FTAs) made it possible for
the country to emerge as a prime export base.
● Exports from Mexico to 44 countries are exempt from tariffs,
including the 10% tariff the European Union assign to imported
motor vehicles.
36
37
Key Internal Factors Weight Rating
Weighted
Score
Weakness
6.
The US EPA has linked Ford to 42 toxic
waste sites and the firm continues to be
criticize for producing gas guzzling large
vehicles.
0.05 2 0.10
Internet:
 2006:
 The Upper Ringwood’s residents sued Ford in a New Jersey state
Court for properly damage and personal injuries, citing the improper
disposal of waste from the Mahwah plant.
 Ford failed to tell more than 600 residents how dangerous, the waste
was and that Ford has yet to properly clean it up.
38
Key Internal Factors Weight Rating
Weighted
Score
Weakness
7.
Ford recalled over 220,000 vehicles in
January 2015 for faulty door handles and
seat belt fasteners.
0.09 1 0.09
Internet:
 The Dearborn automaker is recalling 205,000 2010-13 Ford Taurus, Lincoln
MKS and Ford Police Interceptor sedans due to an issue with the spring that
controls the interior door handles. Ford said the door could become unlatched
in a side-impact crash, increasing the risk of injury.
a) Ford Taurus: b ) Lincoln MKS : c) Police Interceptor
Sedan
 Ford is also recalling 16,100 2014 Ford Transit Connect vans for a potential
issue with safety belt fasteners that may not have been tightened properly.
Safety belt fasteners that do not meet installation specifications may loosen
over time, which may cause them not to function as intended, increasing the
risk of injury in a crash.
39
Ford Transit Connect van
 The costs of repairing faulty merchandise can accumulate to multi-billion
dollar losses.
Key Internal Factors Weight Rating
Weighted
Score
Weakness
8.
In 2014, Ford’s revenue and net income
decline dramatic.
0.05 1 0.05
Textbook:
Ford’s income statement shown in Exhibits 3. Note the decline in revenues
and the dramatic decline in net income on 2014.
Internet:
Ford’s income statement are provided in illustration 1 and 2, respectively.
Note the decline in revenues and in net income on 2014. Meanwhile, in 2016,
Ford’s net income dramatic decline from $ 7,373 in 2015 to $ 4, 596 in 2016.
40
7
Illustration 1: Ford’s Income Statement (in millions of USD) form 2012-2014
Illustration 2: Ford’s Financial Statements (in millions of USD) form 2012 until 2014
7
Ford Motor Company 2014 Annual Report
41
Illustration 3: Ford’s Income Tax Statements (in millions of USD) form 2012- 2014
The Reason Revenue and Net Income Ford Decline Dramatically In 2014
 After near-record earnings in 2013, Ford’s revenue and income tumbled in
the last few months of 2014 as the company set aside $800m to deal with its
struggling Venezuelan operations. Ford had repeatedly warned that its profits
would be down in 2014. For the full year, Ford’s earnings fell 56% to $3.2bn.
Ford’s net income fell to $52m in the fourth quarter the, largely due to an
$800m charge from Venezuelan currency, controls and constraints on what it
can build and sell in the country. In South America as a whole, Ford’s losses
ballooned to $1.2bn as the company ware hit by import restrictions in
Argentina and a weaker economy in Brazil.
 Ford spent heavily to introduce a record 24 vehicles worldwide, including a
redesigned Mustang and the new aluminum-body F-150 pickup truck. Ford
is spending more than $1bn to retrofit its two US plants to make the new
truck.
 Ford struggled with higher warranty costs, including a $500m charge for the
recall of 850,000 vehicles with defective air bags. Ford also rapidly
expanding in Asia, where it is building five plants and launching the Lincoln
brand.
42
 Ford cut its full-year pre-tax earnings forecast from $8bn to $6bn. The
company ended up hitting that lower target, earning $6.3bn in pre-tax profits,
down from a near record of $8.6bn a year ago.8
Key Internal Factors Weight Rating
Weighted
Score
Weakness
9
Ford currently has $374 million in current
pension liabilities and $9,721 million in
non-current pension liabilities.
0.03 2 0.08
Internet:
The term pension liability refers to the amount of money that a Ford’s has to
account for in order to make future pension payments. Ford’s long-term
strategy is to reduce the risk of Ford’s funded defined benefit pension plans,
including minimizing the volatility of the value of Ford’s pension assets
relative to pension liabilities and the need for unplanned use of capital
resources to fund the plans. The strategy reduces balance sheet, cash flow,
and income exposures and, in turn, reduces our risk profile.9
Illustration 3: Ford’s Other Liabilities and Deferred Revenue 2013-2014
8
Ford earnings tumble in 2014 after mass recalls and struggles in South America (The Guardian)
9
Ford Motor Company 2014 Annual Report
43
Illustration 4: Ford’s Other Liabilities and Deferred Revenue 2015-2016
Illustration 5: Ford’s Other Liabilities and Deferred Revenue 2016-2017
Key Internal Factors Weight Rating
Weighted
Score
Weakness
10.
Ford Cancels a $1.6 Billion Mexico
Plant.
0.03 2 0.06
Internet:
In 2017, Ford will cancel plans unveiled in April to spend $1.6 billion to build
the new plant in San Luis Potosi, Mexico due to market demand. The
company said, there is no volume and the demand that Ford’s expected for
that plant. Meanwhile, Ford can build the existing facility and use capacity
that Ford’s already have. In addition, in the last couple of years Ford has seen
small cars markedly decline. After look at Ford’s capacity and forecast for
demand. It became very clear that Ford’s did not need this plant.
44
At the same time, Ford announced it would instead invest $700 million to
expand the Flat Rock, Michigan factory and would make new electric, hybrid
and autonomous vehicles and add 700 direct new jobs. The company said it
would continue to build its Ford Focus at an existing plant in Hermosillo,
Mexico, to improve company profitability.10
Minister of Economy, Mexico claimed that it regrets Ford’s decision and has
ensured that the company will reimburse San Luis Potosi state for any costs
associated with the investment. 11
10
Ford CEO: Main reason for canceling Mexico plant was market demand, not Trump
11
Ford Cancels a $1.6 Billion Mexico Plant and Adds 700 Jobs in Michigan
45
References:
1. Textbook
 Fred R.David & Forest R.David. (2017). Strategic Management: A Competitive
Advantage Approach, Concepts and Cases. 16th
Edition. USA: Pearson
Education (USA) Ltd.
2. Website
 Zahra Rezwana (2015).University of Dhaka. Strategy Management of Ford
Motor Company. Retrieved April 7, 2015, from
https://www.slideshare.net/zrezwana1/strategy-management-of-ford-motor-
company
 Đăng Khoa Cao (2014). Ford motor company. Retrieved November 12, 2014,
from https://www.slideshare.net/caodkhoa1/ford-motor-company-
41473352?from_m_app=android
 Ovidijus Jurevicius (2014). IFE & EFE Matrices. Strategy Management Insight.
Retrieved October 20, 2014 from
https://www.strategicmanagementinsight.com/tools/ife-efe-matrix.html
 IFE Matrix (Internal Factor Evaluation) (n.d). from http://www.maxi-
pedia.com/IFE+EFE+matrix+internal+factor+evaluatio
SM/SHAD/S01/G10
46

IFE Matrix Report 2018

  • 1.
    1 ________________________________________________ AZMAN HASHIM INTERNATIONALBUSINESS SCHOOL TOPIC: CHAPTER 6: CONSTRUCTING AN INTERNAL FACTOR EVALUTION (IFE) MATRIX FOR FORD MOTOR: 2015 LECTURER NAME: MR LOKMAN BIN ALI PREPARE BY GROUP 10 NAMES: MATRIC NO: NURHIMA BINTI HASSAN A17HA0196 ASYSYUARAH BINTI TUAH A17HA0016 ZULPADHLI BIN SALUDIN A17HA0296 DATE SUBMISSION: 14 NOVEMBER 2018 SM/SHAD/S01/G10
  • 2.
    2 IFE MATRIX According tobook of Strategic Management, Sixteenth Edition, by David 1.0 : INTRODUCTION According to Fred R. David, in his book of Strategic Management Sixteenth Edition, the strategic management process consists of three stages, which is Strategy Formulation, Strategy Implementation and Strategy Evaluation. However, the process of identifying or determining internal strengths and weaknesses factors of an organization is included in the Strategy Formulation. A summary step in conducting and internal strategic-management audit is to construct an Internal Factor Evaluation (IFE) Matrix. It allow strategies be conducted. The purposes of IFE Matrix is shown below:  To summarizes and evaluates the major strengths and weaknesses in the functional of business.  Provides a basis for identifying and evaluating relationships among those areas. When developing an IFE Matrix, intuitive judgments are being required. Intuitive judgment means a decision reached based on subjective feeling. Therefore, the appearance of scientific approach should not interpreted. The authors also claims that a thorough understanding of the factors included is more important than the actual number.
  • 3.
    3 2.0 : DEVELOPSAN IFE MATRIX An IFE Matrix can be developed in five steps. STEP 1: LIST 20 KEY INTERNAL FACTORS AS IDENTIFIED IN THE INTERNAL- AUDIT PROCESS. The 20 internal factors, includes the listing of 10 strengths and 10 weaknesses factors of an organization. The list of the factors should be specific as possible, it may using percentages, ratios or comparative numbers. In addition, the factors included should be ‘Action-able’ and divisional as possible. The example as shown below : Table 6-8 Sample Internal Factor Evaluation Matrix for a Retail Computer Store Key Internal Factors Category Strengths 1. Inventory turnover increased from 5.8 to 6.7. Production 2. Average customer purchase increased from $97 to $128. Sales 3. Employee morale is excellent. Management 4. In-store promotions resulted in 20% increase in sales. Marketing 5. Newspaper advertising expenditures increased 10%. Advertising 6. Revenues from repair/service in the store up 16%. Service 7. In-store technical support personnel have MIS college degrees. CSR 8. Store’s debt-to-total assets ratio declined to 34%. Finance 9. Revenues per employee up 19%. Finance Weaknesses 1. Revenues from software segment of store down 12%. Finance 2. Location of store negatively impacted by new Highway 34. Operation 3. Carpet and paint in store somewhat in disrepair. Service 4. Bathroom in store needs refurbishing. Customer Service 5. Revenues from businesses down 8%. Finance 6. Store has no website. Marketing 7. Supplier on-time delivery increased to 2.4 days. Service 8. Often customers have to wait to check out Customer Service
  • 4.
    4 STEP 2: ASSIGN AWEIGHT THAT RANGES FROM 0.0 (NOT IMPORTANT) TO 1.0 (ALL-IMPORTANT) TO EACH FACTOR. The weight assigned to a given factor indicates the relative importance of the factor to being the successful in the firm’s industry. The Factors considered to have greatest effect on the organization performance should assigned the highest weight. Both strengths and weaknesses can received high weights. Moreover, the summation of all weight must be equal to 1.0. The weight given is actually an industry-based. The example as shown below : Table 6-8 Sample Internal Factor Evaluation Matrix for a Retail Computer Store Total weights must equal 1.0
  • 5.
    5 STEP 3: ASSIGN RATINGBETWEEN 1 TO 4 TO EACH FACTOR Assigning the rating to each factor to indicate whether that factor represents a major weakness (rating = 1), a minor weakness (rating = 2), a minor strength (rating = 3), or a major strength (rating = 4). Note that strengths must receive a 3 or 4 rating and weaknesses must receive a 1 or 2 rating. Ratings are thus company-based. The example as shown below : Table 6-8 Sample Internal Factor Evaluation Matrix for a Retail Computer Store Rating are company based
  • 6.
    6 STEP 4: MULTIPLY EACHFACTOR’S WEIGHT BY ITS RATING TO DETERMINE A WEIGHTED SCORE FOR EACH VARIABLE. The example as shown below : Table 6-8 Sample Internal Factor Evaluation Matrix for a Retail Computer Store WEIGHT X RATING = WEIGHTED SCORE
  • 7.
    7 STEP 5: SUM THEWEIGHTED SCORE. Sum the weighted scores for each variable to determine the total weighted score for the organization. Regardless of how many factors are included in an IFE Matrix, the total weighted score can range from a low of 1.0 to a high of 4.0, with the average score being 2.5. Total weighted scores well below 2.5 characterize organizations that are weak internally, whereas scores significantly above 2.5 indicate a strong internal position. Analysis:  This store receives a 2.5 total weighted score, which on a 1 to 4 scale is exactly average/ halfway, indicating there is definitely room for improvement in store operations, strategies, policies, and procedures.  The IFE Matrix provides important information for strategy formulation.  This retail computer store might want to hire another checkout person and repair its carpet, paint, and bathroom problems.  The store may want to increase advertising for its repair/services, because that is a really important (weight 0.15) factor to being successful in this business
  • 8.
    8 CASE STUDY FORDMOTOR COMPANY : 2015 3.0 : FORD IFE MATRIX IN 2015 Below is the Ford: 2015 IFE Matrix in five steps. STEP 1: LIST 20 KEY INTERNAL FACTORS AS IDENTIFIED IN THE INTERNAL- AUDIT PROCESS. There are total of 20 internal factors, includes the listing of 10 strengths and 10 weaknesses factors of Ford. The list of the factors should be specific as possible, it may using percentages, ratios or comparative numbers. In addition, the factors included should be ‘Action-able’ and divisional as possible The Ford internal factors as shown below : Key Internal Factors Strengths Category 1. Ford is engaged in its largest manufacturing expansion in over 50 years by increasing capacity in six US plants and by opening two new plants in Asia and one each in South America and Europe. The US plants alone are having $6 billion of improvements. Ford’s F-150 pickup truck is the most popular truck in the world for 32 years running. Production & Operation 2. Since 2005, Ford’s warranty repairs have declined 66% for vehicles in the first three months of service with average warranty costs falling 54% Warranties 3. The new F-150 comes with a 2.7-liter V6 Eco Boost engine, giving it the same power as a V8, with much better fuel economy. R&D 4. To improve safety, many Ford products now include Blind Spot Information Systems, lane alerts, and rear parking assistance. R&D 5. In 2014, Ford launched more vehicles than ever before in a single calendar year, including a new Mustang and F- 150. Ford is especially proud of offering its Mustang for the first time ever in select markets in Europe and Asia. Marketing & Production 6. In 2013, Ford sold over 85,000 hybrid or all electric, plug-in automobiles, up 150% from 2012 as the company attempts to produce what one executive called a Tesla for the average person. R&D, Marketing & Production 7. Ford derives approximately 60% of its revenues from the USA, Canada, and Mexico. Virtually all the company’s profits in 2014 came from these countries. Finance
  • 9.
    9 8. Labor expenseswas reduce after labor unions agreed to concessions. Management & Finance 9. The Ford Explorer has recently been shift to become more of a SUV style along with several other popular SUV models. R&D Marketing 10. The Ford Fiesta and Ford Fusion are excellent cars in the small and midsize categories respectively. Pricing & Production Weaknesses 1. Ford reported EBT of negative $1.1 billion in both Europe and South America in 2014. Finance 2. Ford is in the midst of a $400 million restructuring program in Europe and anticipates Europe will become profitable sometime in 2015 or 2016. Finance & CSR 3. Net income dropped by 56% to $3,187 billion in 2014. Finance 4. In 2013, Ford only enjoyed a 5% China market share. Finance 5. Ford planned to invest $6 billion between 2013 and 2016 to shift automobile production to the USA. Management & Operation 6. The US EPA has linked Ford to 42 toxic waste sites and the firm continues to criticized for producing gas guzzling large vehicles. R&D 7. Ford recalled over 220,000 vehicles in January 2015 for faulty door handles and seat belt fasteners. Warranties 8. In 2014, Ford’s revenue decline dramatic in net income. Finance 9. Ford currently has $374 million in current pension liabilities and $9,721 million in non-current pension liabilities. Finance 10. Ford Cancels a $1.6 Billion Mexico Plant. Finance & Management
  • 10.
    10 STEP 2: ASSIGN AWEIGHT THAT RANGES FROM 0.0 (NOT IMPORTANT) TO 1.0 (ALL-IMPORTANT) TO EACH FACTOR. Below is Ford’s key internal factors weight : Total weights must equal 1.0
  • 11.
    11 STEP 3: ASSIGN RATINGBETWEEN 1 TO 4 TO EACH FACTOR Below is Ford’s key internal factors Rating : Rating are company based
  • 12.
    12 Assigning the ratingto each factor to indicate whether that factor represents:  A major weakness (rating = 1);  A minor weakness (rating = 2);  A minor strength (rating = 3);  A major strength (rating = 4). # Note that strengths must receive a 3 or 4 rating and weaknesses must receive a 1 or 2 rating. Ratings are thus company-based. STEP 4: MULTIPLY EACH FACTOR’S WEIGHT BY ITS RATING TO DETERMINE A WEIGHTED SCORE FOR EACH VARIABLE. The Ford’s Weighted score as shown below : WEIGHT X RATING = WEIGHTED SCORE TOTAL WEIGHTED SCORE
  • 13.
    13 STEP 5: SUM THEWEIGHTED SCORE. Total weighted score of key internal factors for Ford : 2015: Analysis :  Ford have strong internal organization.  Overall, Ford Motor Company in 2015 receives a 2.79 total weighted score, which on are 1 to 4 scale is exactly above average. This is indicates that a lot improvement need to do by Ford’s.  Based on weakness key internal by Ford the most problems occur in their product is door handles and seat belt fasteners (weighted of 0.09).  This IFE Matrix provide important information for strategy formulation such as Ford might want to do intensive R&D on their product or want to find other alternative to settle this problem. TOTAL WEIGHTED SCORE = 2.79
  • 14.
    14 OTHER RESOURCES KEY INTERNALSTRENGTH FORD : 2015 Key Internal Factors Weight Rating Weighted Score Strengths 3 or 4 1. Largest manufacturing expansion in over 50 years by increasing capacity in six US plants and by opening two new plants in Asia and one each in South America and Europe. 0.07 4 0.28 Internet: “To meet surging customer demand for our top-selling cars, utilities and trucks, we are continuing to run our North American facilities at full manned capacity, and we will add 200,000 units of annual straight-time capacity this year,” - Jim Tetreault,  Ford plans to add close to 3,500 hourly jobs to meet customer demand for the company’s best-selling vehicles. To meet customer demand for Ford vehicles, the company will add nearly 3,500 hourly jobs in 2013. With its latest announcement of more than 2,000 new jobs at Kansas City Assembly Plant, as well as more than 1,400 new jobs at Flat Rock Assembly Plant, Ford is three-quarters of the way to its plan to create 12,000 hourly jobs in the United States by 2015. The company hired more than 8,000 salaried and hourly employees in the U.S. last year.  Ford will add an additional 200,000 units of annual straight-time capacity this year after increasing annual straight-time capacity by 400,000 units in the region last year. The 200,000 unit annual straight-time capacity additions this year will come from Chicago Assembly Plant, Flat Rock Assembly Plant and Kansas City Assembly Plant, including increased production of some of Ford’s best- selling vehicles including Ford Explorer, Ford Fusion and Ford F-Series.
  • 15.
    15  Ford willshorten its summer shutdown from the traditional two weeks to one week for a majority of North American assembly plants, increasing production by an extra 40,000 units. Six assembly plants, will take a reduced summer shutdown this year. The assembly plants taking one week of shutdown are Chicago Assembly, Cuautitlán Assembly, Hermosillo Stamping and Assembly, Kentucky Truck, Michigan Assembly and Oakville Assembly. Key Internal Factors Weight Rating Weighted Score Strengths 3 or 4 2. Since 2005, Ford’s warranty repairs have declined 66% for vehicles in the first three months of service with average warranty costs falling 54%. 0.08 4 0.32 Internet: Ford Motor Company's steady vehicle quality improvement in recent years is beginning to translate into significant savings for the company and fewer repairs. These savings can attributed to four straight years of quality improvements on Ford, Lincoln, and Mercury vehicles. Ford have made significant strides toward improving quality since 2005. One-way ford track this is in the incidence of warranty repairs per 1,000 vehicles in the first 3 months of service. Global warranty repairs have fallen 66% from 2005 to 2013. As the incidence of repair has come down, so has the average warranty cost per unit in the first 3 months in service. Over the same period, global warranty repair cost per unit has improved by 54%, including improvements of more than 70% in Asia Pacific Africa, more than 60% in Europe and South America, and about 45% in North America. Key Internal Factors Weight Rating Weighted Score Strengths 3 or 4 3. The new F-150 comes with a 2.7-liter V6 Eco Boost engine, giving it the same power as a V8, with much better fuel economy. 0.07 4 0.28
  • 16.
    16 Textbook: The 2015 F-150will be available with a 2.7-Liter Eco-Boost V6 that ramps up the MPG even more. It reduces mass by using iron and aluminum and it is capable of more than 300hp in a lightweight and compact design. The 2.7- Liter Eco-Boost will also be the first Ford truck engine with automatic stop/start capability. Specifically tuned for truck customers, this technology shuts off the engine when the vehicle is at a stop (except when towing or in four-wheel drive). Once the brake released, the engine restarts quickly. Base on review and experiment that had done by DAVID BOOTH and DEREK MCNAUGHTON about Ford f-150 fuel consumption. They said that For a mere 2.7 liters, its ability to cruise even beyond 120 km/h and also recorded about the same fuel economy at 120 — 11.4 L/100 kilometers, to be exact , but also noted that consumption went down dramatically to 8.5 L/100km when they reduced speed to 100 km/h. Like many of Ford’s EcoBoost engines, the 2.7L looks to specifically tuned to show its best on the EPA’s dyno. It shows that the engine can save oil consumption and good for customer because they can save on fuel. Chart above show comparison of fuel consumption mile per-gallon over 100 miles while towing 4,200 pounds load. Ford f-150 3.5L and 2.7L with Ecoboost consume fuel lower than other truck such as Ram 1500 Trademan, Chevrolet Silverado 1500, and Chevrolet Colorado Z71
  • 17.
    17 Key Internal FactorsWeight Rating Weighted Score Strengths 3 or 4 4. To improve safety, Ford now include Blind Spot Information Systems, lane alerts, and rear parking assistance. 0.10 4 0.4 Internet: The engineers at Ford have put plenty of thought into keeping drivers and passengers safe when the unthinkable happens. The Ford Motor Company has always considered the safety of their customers to be one their most important jobs. This is apparent in the approach they take to ensuring the safety of their vehicles, and the customer that drive and ride in them. Base on the illustration above it show that the latest safety feature that ford installed on their vehicle. Key Internal Factors Weight Rating Weighted Score Strengths 3 or 4 5. In 2014, Ford launched more vehicles than ever before in a single calendar year, including a new Mustang and F-150. Ford is especially proud of offering its Mustang for the first time ever in select markets in Europe and Asia. 0.04 3 0.12
  • 18.
    18 Internet: The all-new F-150launched in the fall of 2014 is the first mass-market pickup truck with an aluminum-alloy body, which improves fuel economy. In addition, its stronger steel frame contains more high-strength steel, which enables the F-150 to tow even heavier loads. 2014 Ford F-150 2018 Ford F-150 2019 Ford F-150 Aggressive new car launches these past two years, including the launches of the F-150, Mustang and Edge, succeeded in setting new business performance records for Ford in the second quarter of 2015. Ford reported its highest quarterly profit in 15 years, with a pre-tax profit of USD 2.9 billion and net income of USD 1.9 billion. More than 8,000 Mustangs sold in Europe; customers show preference for fastback body style, 421 PS 5.0-litre V8 engine, and Race Red and Magnetic Grey colors 2014 Ford Mustang 2018 Ford Mustang 2019 Ford Mustang
  • 19.
    19 Analysis : ● Fullyear 2014 pre-tax profit of $6.3 billion, a decline of $2.3 billion compared with a year ago; full year after-tax earnings, excluding special items, were $1.16 per share, 47 cents lower compared with a year ago. ● Full year net income of $3.2 billion, or 80 cents per share. ● Automotive pre-tax profit of $4.5 billion; North America profitable and Asia Pacific posted a record profit; Europe and Middle East & Africa both improved; South America reported a loss. ● Wholesale volume about equal to a year ago and company revenue down 2 percent; achieved record market share in Asia Pacific, driven by record share in China. ● Best results at Ford Credit since 2011. ● Record-setting year of 24 vehicles launched globally, including the all-new F-150, Mustang, Escort, Kia, Transit and Lincoln MKC.
  • 20.
    20 Key Internal FactorsWeight Rating Weighted Score Strengths 3 or 4 6. In 2013, Ford sold over 85,000 hybrid or all electric, plug-in automobiles, up 150% from 2012 as the company attempts to produce what one executive called a Tesla for the average person. 0.04 4 0.16 Internet:
  • 21.
    21  Calendar year2013 hybrid market sales saw the Prius “family” decline from 2012 totals. This was presumably due to new competition, particularly from Ford.  The huge increase in sales means that Ford is now second only to Toyota concerning hybrid vehicle sales in the US. In addition, Ford’s share of the US hybrid market is continuing to grow.  Ford has attributed the big increase in sales to the strength of its new array of electrified vehicles : US Hybrid Sale for December 2013
  • 22.
    22 2013 FORD C-MAXHYBRID $ 8,771 2013 FORD C-MAX ENERGI $ 10,071 2013 FORD FUSION ENERGI $ 15,717 2013 FORD FUSION HYBRID $11,294 2013 LINCOLN MKZ HYBRID $13,540
  • 23.
    23 Key Internal FactorsWeight Rating Weighted Score Strengths 3 or 4 7. Ford derives approximately 60% of its revenues from the USA, Canada, and Mexico. Virtually all the company’s profits in 2014 came from these countries. 0.05 4 0.20  The North American Free Trade Agreement entered into force on January 1, 1994, eliminating most barriers to free trade between the United States, Canada, and Mexico.  Ford Motor Company was one of many companies able to benefit by optimizing its manufacturing operations without the distortion of tariffs and other customs barriers. Today the Company has three manufacturing facilities in Mexico:  There are several benefits to Ford of manufacturing in Mexico: i. The country has a relatively skilled and low-cost labor force. ii. Well located geographically to ship to the U.S. or South America.
  • 24.
    24 iii. Has wide-rangingtrade agreements, and has government policies promoting exports. iv. Increasing number of Mexican graduates from engineering and technical schools, which have expanded the pool of skilled labor. v. The country’s “maquiladora” program also allows for duty-free importation of raw materials, components and equipment needed in the manufacture of goods for subsequent export.  Hourly Manufacturing Compensation by Country Key Internal Factors Weight Rating Weighted Score Strengths 3 or 4 8. Labor expenses was reduce after labor unions agreed to concessions. 0.01 3 0.03 Textbook: In 2007, Ford reached an agreement with the UAW on retirement benefits and other costs. The company was able to avoid a government takeover, unlike its counterpart, General Motors. Wages, the second-largest expense, historically have been about $70,000 per employee in the United States and account for 5 percent of total revenue expenses. Higher commodity prices and wage expenses forced GM and Chrysler to reach similar cost-cutting labor agreements in concessionary deal with United Auto Workers.1 Finally, Labor expenses were reduce after labor unions agreed to concessions. Internet: United Auto Workers union leaders urged members to approve a concessionary deal with Ford Motor Co, stepping up the pressure on General 1 Union leaders urge vote for Ford agreement
  • 25.
    25 Motors Corp andChrysler to reach similar cost-cutting labor agreements. The UAW agreement, which includes concessions, intended to reduce operating costs and a change in the way Ford funds a union-aligned healthcare trust, aimed at making Ford competitive with the U.S. operations of foreign carmakers. The agreement includes no reductions in UAW base hourly pay, but would suspend cost-of-living adjustments, performance bonuses and the Christmas bonus. Ford's new four-year UAW contract may appear rich, but it increases labor costs by less than 1.5% a year. The costs of the four-year deal are in keeping with the company's projections both short and long term, and in line with inflation projections. Noting the deal is no more expensive than if Ford had adopted the same agreement that the UAW negotiated with General Motors. Importantly, Ford feels its labor costs —, which increase to $60 an hour with benefits in 2019 from $57 now — eliminates the labor cost gap to GM and narrows the gap with lower-cost Fiat Chrysler Automobiles. Ford's labor cost will remain $8-$10 an hour higher than Japanese rivals Toyota and Honda.2 Key Internal Factors Weight Rating Weighted Score Strengths 3 or 4 9. The Ford Explorer has recently been shift to become more of a SUV style along with several other popular SUV models. 0.07 4 0.28 Textbook: 2 Ford: UAW deal brings costs even with GM, close to FCA
  • 26.
    26  Market shareof Cross Over and SUV Vehicles (Ford Explorer) Exhibit 9 reveals the percent of revenue of various classes of vehicle. Crossover utility vehicles have taken much of the demand away from SUVs, which account for only 10 percent of total U.S. market share. These vehicles look much like an SUV, but are built on car chasses and lack the towing power of an SUV. They also tend to get much better gas mileage, as automakers started applying hybrid technology to crossovers before SUVs. Notable SUVs include the Ford Flex, Toyota Venza, and Dodge Journey. The Ford Explorer has recently been shifted to become more of a SUV style along with several other popular SUV models. Internet: According to USA Today (2017), Ford has once again made some changes to its Ford Explorer SUV. The updates on the Ford Explorer include a new grille and redesigned fog lamps. It also offered in four new colors and with five new wheel choices. The Explorer helped define the SUV segment and sales in the U.S. peaked at 445,000 in 2000. Nearly 7 million have sold since the SUV debuted in 1990. Ford will rethink to make it more fuel-efficient and nimble to drive. Explorer has been a popular and successful vehicle.3 Chart 1: Comparison Car Sales by three model Picture 1: Toyota Highlander Picture 2: Chevrolet Traverse Picture 3: Ford Explorer 3 Ford updates looks of the 2018 Explorer SUV with new grille
  • 27.
    27 USA Today (2017)claimed that Ford Explorer has become one of the nation's most popular police cruisers. It just crossed the 50% market share threshold for the first time since it introduced in 2012.4 Picture 4: Ford Explorer Police Interceptor Key Internal Factors Weight Rating Weighted Score Strengths 3 or 4 10. The Ford Fiesta and Ford Fusion are excellent cars in the small- and mid-size categories respectively. 0.04 3 0.12 Textbook:  Market Share of Subcompact (Ford Fiesta) The smaller cars popular include the Ford Fiesta and the Chevrolet Sonic which can start as low as $15,000.  Market Share of Midsize Cars (Ford Fusion) Midsize cars are also extremely popular, taking much of the market share away from larger vehicles. The Ford Fusion, Chevy Malibu, Dodge Charger, and Toyota Camry are examples of midsize vehicles. Internet:  Subcompact cars are the smallest and least expensive vehicles on the market, but their low prices are not their only appeal.5 4 Nation's most popular police car is now an SUV 5 Best Subcompact Cars 2018 Ford Fiesta $14,205 - $21,285 MSRP 2018 Chevrolet Sonic $15,295 - $21,320 MSRP 2018 Toyota Yaris $15,950 - 17,050
  • 28.
    28 *MSRP=Manufacturer Suggested RetailPrice  Midsize cars are one of the most popular types of vehicles with consumers, and with good reason. When it comes to commuting, hauling the kids around town, or road tripping, few types of cars balance space, comfort, fuel economy, and performance as well as the best midsize cars do.6 Graph 2: Comparison Car Sales on Small/ Subcompact Cars Graph 2 shown that Chevrolet Sonic sales dramatically decline in 2014, while Ford Fiesta sales are more than Chevrolet Sonic in the same year. Toyota Yaris is not so popular on small/subcompact cars market share.  Midsize cars are one of the most popular types of vehicles with consumers, and with good reason. When it comes to commuting, hauling the kids around town, or road tripping, few types of cars balance space, comfort, fuel economy, and performance as well as the best midsize cars do. 6 Best Midsize Cars
  • 29.
    29 Graph 3: ComparisonCar Sales on Midsize cars Graph 3 shown that Toyota Camry are popular car on midsize cars. The second popular are Ford Fusion and follow by Chevrolet Malibu.
  • 30.
    30 OTHER RESOURCES KEY INTERNALWEAKNESSES FORD : 2015 Key Internal Factors Weight Rating Weighted Score Weakness 1. Ford reported EBT of negative $1.1 billion in both Europe and South America in 2014. 0.06 1 0.06 Textbook: Pretax earnings is a company's income after all operating expenses, including interest and depreciation, have been deducted from total sales or revenues, but before income taxes have been subtracted. Also known as pretax income or earnings before tax (EBT). Internet:  Ford automotive sector in South America Segment: Base on charts above, full-year pre-tax loss was $1.2 billion; The deterioration in all metrics was driven by unfavorable changes in the external factors, which is effects of slowing GDP growth, lower industry volumes in larger markets, weaker currencies, high inflation, as well as policy uncertainty in some countries.
  • 31.
    31 The decrease inpre-tax profit for 2014 compared with 2013 is more than explained by unfavorable exchange, higher costs (primarily driven by higher inflation), and lower volume, offset partially by favorable net pricing. The higher net pricing reflects partial recovery of the adverse effects of high local inflation and weaker local currencies, along with pricing associated with the new products. The full year loss includes $426 million of adverse balance sheet exchange effects, related primarily to the devaluation of the Venezuela bolivar in the first quarter.  Ford automotive sector in Europe Segment: Base on charts above, Europe’s full-year wholesale volume and revenue were up 5% and 8%, respectively, from a year ago. Operating margin was negative 3.6% and the pre-tax loss was $1.1 billion, both improved from a year ago. The improvement in pre-tax results is more than explained by higher volume and lower cost, offset partially by Russia and other factors, including lower component pricing and parts and accessories profits. Key Internal Factors Weight Rating Weighted Score Weakness 2. Ford is in the midst of a $400 million restructuring program in Europe and anticipates Europe will become profitable sometime in 2015 or 2016. 0.02 2 0.04
  • 32.
    32 Textbook: In Europe, Fordexpects reduced losses in 2014, including restructuring costs of about $400 million that will be reported in 2014 operating results. The Europe transformation plan continues to progress well and the business unit remains on track to achieve profitability in 2015. Internet:  Business Restructuring – Europe In October 2012, ford committed to commence a transformation plan for their Europe operations. The plan included the closure of two U.K. facilities an assembly plant in Southampton, and a stamping and tooling plant in Dagenham in 2013 and a major assembly plant in Genk, Belgium by the end of 2014. Before finalizing separation plan in Genk, ford engaged in a consultation process with the labor unions, which completed in June 2013. Separation- related costs, recorded in Automotive cost of sales and Selling, administrative and other expenses, include both the costs associated with the voluntary separation programs in the U.K. and the involuntary employee actions at Genk, as well as payments to suppliers. The following table summarizes the separation-related activity, excluding pension, recorded in Accrued liabilities and deferred revenue, for the period ended September 30 (in millions): Ford current estimate of total separation-related costs for the U.K. and Genk facilities is approximately $1 billion, excluding approximately $200 million of pension-related costs. Key Internal Factors Weight Rating Weighted Score Weakness 3. Net income dropped by 56% in 2014. 0.02 1 0.02
  • 33.
    33 Ford said thatits net income for the 2014 plummeted 56% from the previous year, primarily because of higher costs, lower volumes and a series of surprising setbacks.Industry analysts said that Ford’s 2014 results were mostly because Ford is investing heavily in revamping its product line-up, launching 23 vehicles in 2014 Ford Motor Co. posted a 56-percent drop in net income in 2014 to $3.2 billion, bogged down by the cost of introduction of 22 new vehicles globally as well as by a drop in its share of the United States auto market. While the carmaker earned $52 million in the fourth quarter, it was much lower than the $3 billion posted in the same period in 2013, when the company benefited from favorable tax benefits. Heavy investment to expand Asian operations and restructure its troubled European division at the same time it was grappling with poor economic conditions in South America and Europe. Base on income statement above, it clearly show that net income dropped from $7,182 billion in 2013 to $3,187 in 2014. On February 13, 2013 Ford operation in Venezuelan effected by devaluation of the bolivar, from an exchange rate of 4.3 bolivars to the U.S. dollar to an exchange rate of 6.3 bolivars to the U.S. dollar. This resulted in a re- measurement loss of $186 million in Automotive cost of sales in the first quarter of 2013. In the fourth quarter of 2014, Ford incurred an $800-million pretax charge related to currency devaluation in Venezuela.
  • 34.
    34 Key Internal FactorsWeight Rating Weighted Score Weakness 4. In 2013, Ford only enjoyed a 5% Chinese market share. 0.04 2 0.08 Internet: Investors and analysts monitor increases and decreases in market share carefully, because this can be a sign of the relative competitiveness of the company's products or services. Size of market share will affect company revenue. Reason why ford market share in china still small : i. Compete with the $9,500 Chevrolet Sail ii. Ford cars are expensive. In a market where 70 percent of vehicles sold cost less than $14,500, Ford's cheapest car is the Fiesta, which starts at $13,300. iii. Ford's development costs are also steep compared with competitors' because it still does much of the research and design for Chinese vehicles at its headquarters in Dearborn, Michigan, where costs are relatively high.
  • 35.
    35 Key Internal FactorsWeight Rating Weighted Score Weakness 5. Ford planned to invest $6 billion between 2013 and 2016 to shift automobile production to the USA. 0.04 1 0.04 Internet: a. Automotive assembly compensation is approximately 80% lower in Mexico then in the United States and low wages. b. Mexico: ● Low production costs and low tariffs due to the broad reach of Mexico’s Free Trade Agreements (FTAs) made it possible for the country to emerge as a prime export base. ● Exports from Mexico to 44 countries are exempt from tariffs, including the 10% tariff the European Union assign to imported motor vehicles.
  • 36.
  • 37.
    37 Key Internal FactorsWeight Rating Weighted Score Weakness 6. The US EPA has linked Ford to 42 toxic waste sites and the firm continues to be criticize for producing gas guzzling large vehicles. 0.05 2 0.10 Internet:  2006:  The Upper Ringwood’s residents sued Ford in a New Jersey state Court for properly damage and personal injuries, citing the improper disposal of waste from the Mahwah plant.  Ford failed to tell more than 600 residents how dangerous, the waste was and that Ford has yet to properly clean it up.
  • 38.
    38 Key Internal FactorsWeight Rating Weighted Score Weakness 7. Ford recalled over 220,000 vehicles in January 2015 for faulty door handles and seat belt fasteners. 0.09 1 0.09 Internet:  The Dearborn automaker is recalling 205,000 2010-13 Ford Taurus, Lincoln MKS and Ford Police Interceptor sedans due to an issue with the spring that controls the interior door handles. Ford said the door could become unlatched in a side-impact crash, increasing the risk of injury. a) Ford Taurus: b ) Lincoln MKS : c) Police Interceptor Sedan  Ford is also recalling 16,100 2014 Ford Transit Connect vans for a potential issue with safety belt fasteners that may not have been tightened properly. Safety belt fasteners that do not meet installation specifications may loosen over time, which may cause them not to function as intended, increasing the risk of injury in a crash.
  • 39.
    39 Ford Transit Connectvan  The costs of repairing faulty merchandise can accumulate to multi-billion dollar losses. Key Internal Factors Weight Rating Weighted Score Weakness 8. In 2014, Ford’s revenue and net income decline dramatic. 0.05 1 0.05 Textbook: Ford’s income statement shown in Exhibits 3. Note the decline in revenues and the dramatic decline in net income on 2014. Internet: Ford’s income statement are provided in illustration 1 and 2, respectively. Note the decline in revenues and in net income on 2014. Meanwhile, in 2016, Ford’s net income dramatic decline from $ 7,373 in 2015 to $ 4, 596 in 2016.
  • 40.
    40 7 Illustration 1: Ford’sIncome Statement (in millions of USD) form 2012-2014 Illustration 2: Ford’s Financial Statements (in millions of USD) form 2012 until 2014 7 Ford Motor Company 2014 Annual Report
  • 41.
    41 Illustration 3: Ford’sIncome Tax Statements (in millions of USD) form 2012- 2014 The Reason Revenue and Net Income Ford Decline Dramatically In 2014  After near-record earnings in 2013, Ford’s revenue and income tumbled in the last few months of 2014 as the company set aside $800m to deal with its struggling Venezuelan operations. Ford had repeatedly warned that its profits would be down in 2014. For the full year, Ford’s earnings fell 56% to $3.2bn. Ford’s net income fell to $52m in the fourth quarter the, largely due to an $800m charge from Venezuelan currency, controls and constraints on what it can build and sell in the country. In South America as a whole, Ford’s losses ballooned to $1.2bn as the company ware hit by import restrictions in Argentina and a weaker economy in Brazil.  Ford spent heavily to introduce a record 24 vehicles worldwide, including a redesigned Mustang and the new aluminum-body F-150 pickup truck. Ford is spending more than $1bn to retrofit its two US plants to make the new truck.  Ford struggled with higher warranty costs, including a $500m charge for the recall of 850,000 vehicles with defective air bags. Ford also rapidly expanding in Asia, where it is building five plants and launching the Lincoln brand.
  • 42.
    42  Ford cutits full-year pre-tax earnings forecast from $8bn to $6bn. The company ended up hitting that lower target, earning $6.3bn in pre-tax profits, down from a near record of $8.6bn a year ago.8 Key Internal Factors Weight Rating Weighted Score Weakness 9 Ford currently has $374 million in current pension liabilities and $9,721 million in non-current pension liabilities. 0.03 2 0.08 Internet: The term pension liability refers to the amount of money that a Ford’s has to account for in order to make future pension payments. Ford’s long-term strategy is to reduce the risk of Ford’s funded defined benefit pension plans, including minimizing the volatility of the value of Ford’s pension assets relative to pension liabilities and the need for unplanned use of capital resources to fund the plans. The strategy reduces balance sheet, cash flow, and income exposures and, in turn, reduces our risk profile.9 Illustration 3: Ford’s Other Liabilities and Deferred Revenue 2013-2014 8 Ford earnings tumble in 2014 after mass recalls and struggles in South America (The Guardian) 9 Ford Motor Company 2014 Annual Report
  • 43.
    43 Illustration 4: Ford’sOther Liabilities and Deferred Revenue 2015-2016 Illustration 5: Ford’s Other Liabilities and Deferred Revenue 2016-2017 Key Internal Factors Weight Rating Weighted Score Weakness 10. Ford Cancels a $1.6 Billion Mexico Plant. 0.03 2 0.06 Internet: In 2017, Ford will cancel plans unveiled in April to spend $1.6 billion to build the new plant in San Luis Potosi, Mexico due to market demand. The company said, there is no volume and the demand that Ford’s expected for that plant. Meanwhile, Ford can build the existing facility and use capacity that Ford’s already have. In addition, in the last couple of years Ford has seen small cars markedly decline. After look at Ford’s capacity and forecast for demand. It became very clear that Ford’s did not need this plant.
  • 44.
    44 At the sametime, Ford announced it would instead invest $700 million to expand the Flat Rock, Michigan factory and would make new electric, hybrid and autonomous vehicles and add 700 direct new jobs. The company said it would continue to build its Ford Focus at an existing plant in Hermosillo, Mexico, to improve company profitability.10 Minister of Economy, Mexico claimed that it regrets Ford’s decision and has ensured that the company will reimburse San Luis Potosi state for any costs associated with the investment. 11 10 Ford CEO: Main reason for canceling Mexico plant was market demand, not Trump 11 Ford Cancels a $1.6 Billion Mexico Plant and Adds 700 Jobs in Michigan
  • 45.
    45 References: 1. Textbook  FredR.David & Forest R.David. (2017). Strategic Management: A Competitive Advantage Approach, Concepts and Cases. 16th Edition. USA: Pearson Education (USA) Ltd. 2. Website  Zahra Rezwana (2015).University of Dhaka. Strategy Management of Ford Motor Company. Retrieved April 7, 2015, from https://www.slideshare.net/zrezwana1/strategy-management-of-ford-motor- company  Đăng Khoa Cao (2014). Ford motor company. Retrieved November 12, 2014, from https://www.slideshare.net/caodkhoa1/ford-motor-company- 41473352?from_m_app=android  Ovidijus Jurevicius (2014). IFE & EFE Matrices. Strategy Management Insight. Retrieved October 20, 2014 from https://www.strategicmanagementinsight.com/tools/ife-efe-matrix.html  IFE Matrix (Internal Factor Evaluation) (n.d). from http://www.maxi- pedia.com/IFE+EFE+matrix+internal+factor+evaluatio
  • 46.