Download as PDF, PPTX

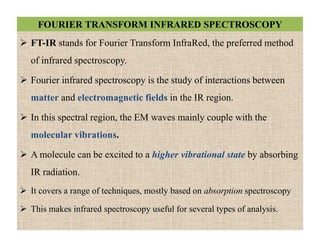
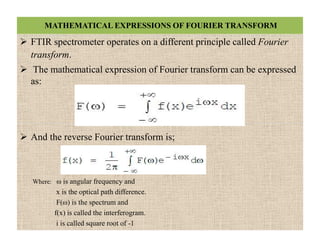
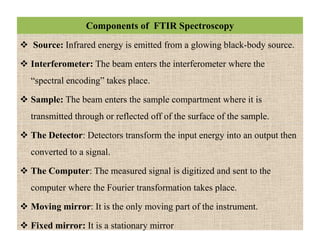
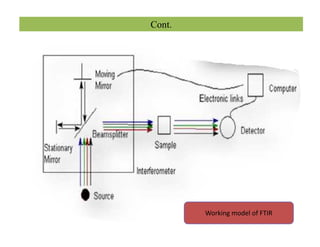
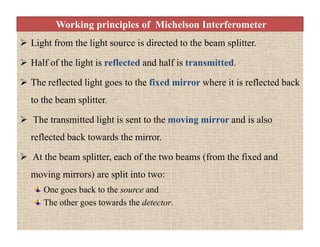
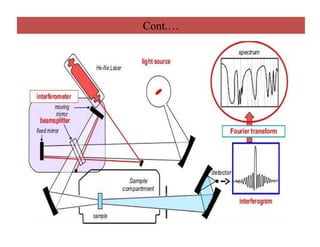
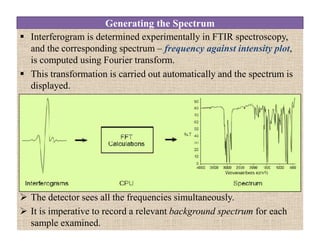


The document discusses Fourier transform infrared spectroscopy (FTIR). It provides a brief history of FTIR's development. FTIR uses a Michelson interferometer to measure all infrared frequencies simultaneously. The interferometer splits light from a source between two mirrors, and the light is recombined to generate an interferogram that is transformed into a spectrum using Fourier transforms. FTIR allows identifying materials, determining sample consistency and quantifying mixtures by analyzing molecular absorption of infrared radiation.


![FOURIER -TRANSFORM INFRARED SPECTROMETER [FTIR]](https://cdn.slidesharecdn.com/ss_thumbnails/ftir-160604063055-thumbnail.jpg?width=640&height=640&fit=bounds)


