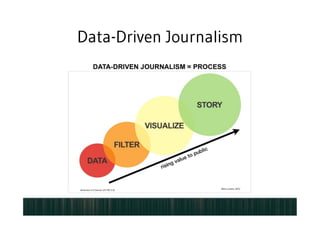
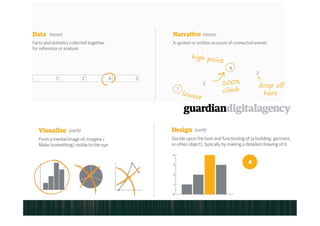
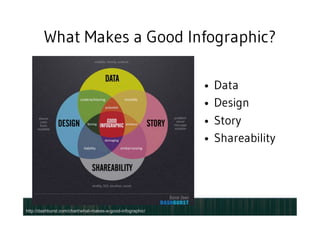
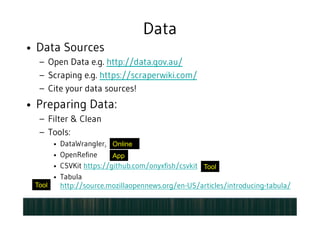
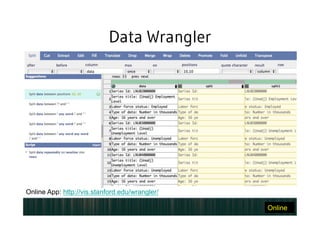
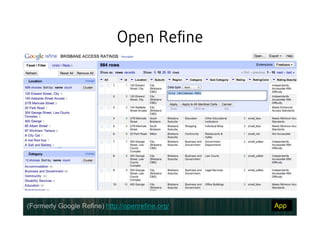
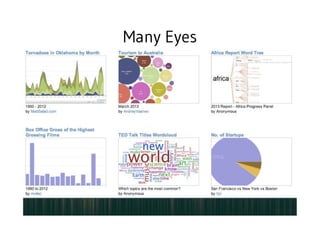
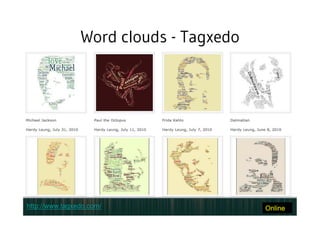
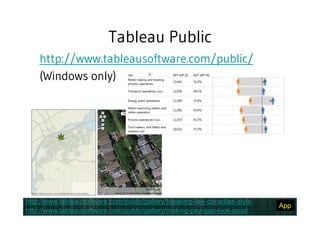
Intro to data visualisation

Intro to Data Visualisation
Data-Driven Journalism
Intro to data visualisation
"Communicating
complex data and
intricate ideas through
clear and beautiful
visual storytelling."
- Tobias Sturt – Design Manager, The Guardian Digital Agency
http://www.100yearsofworldcuisine.com/
http://www.guardian.co.uk/world/interactive/2012/may/08/gay-rights-united-states
http://partylines.theglobalmail.org/
http://www.smh.com.au/data-point/census-2012
http://connectedchina.reuters.com/
http://www.guardian.co.uk/news/datablog/2012/dec/04/government-spending-department-2011-12
http://www.visualisingdata.com/index.php/
2013/04/discussion-storytelling-and-
success-stories/
http://awesome.good.is/transparency/web/
0906/trans0609largestbankruptciee s.html
http://www.abc.net.au/mediawatch/transcripts/s3694586.htm
What Makes a Good Infographic?
•  Data
•  Design
•  Story
•  Shareability
http://dashburst.com/chart/what-makes-a-good-infographic/
Story
•  Data visualisations may be
–  Insightful vs Infotainment
–  Exploratory vs Explanatory
Design
•  Graphical layout and design
–  Colours & Typeface
–  Proximity & placement
–  Accessibility
•  Interaction / User Experience Design
–  Static vs interactive
–  Mobile device / touch support?
•  Custom design vs using existing tools and
visualisation techniques
http://visualizing.org/stories/taxonomy-data-visualization
http://www.visual-literacy.org/periodic_table/periodic_table.html
Data
•  Data Sources
–  Open Data e.g. http://data.gov.au/
–  Scraping e.g. https://scraperwiki.com/
–  Cite your data sources!
•  Preparing Data:
–  Filter & Clean
–  Tools:
•  DataWrangler,
•  OpenRefine
•  CSVKit https://github.com/onyxfish/csvkit
•  Tabula
http://source.mozillaopennews.org/en-US/articles/introducing-tabula/
Online
App
Tool
Tool
Data Wrangler
Online App: http://vis.stanford.edu/wrangler/
Online
Open Refine
(Formerly Google Refine) http://openrefine.org/ App
Data Visualisation Tools
•  Off-the-shelf apps and services for creating:
–  Maps
–  Charts
–  Timelines
–  Network diagrams
–  And more…
MAPS
Color Brewer
http://colorbrewer2.com/ Online
Open Heat Map
http://www.openheatmap.com/ Online
Google Fusion Tables
https://drive.google.com/ Online
MapBox TileMill
http://mapbox.github.io/tilemill/index.html App
Basic Charts
•  Excel or OpenOffice.org Calc
•  Google Charts and Google Fusion Tables
–  http://imagecharteditor.appspot.com/
Online
App
Infogr.am
http://infogr.am/ Online
Data Wrapper
Onlinehttp://datawrapper.de/
Timelines
Google Fusion Tables
https://github.com/FlowingMedia/TimeFlow/wiki
App
Online
Time Flow
NETWORK DIAGRAMS
Gephi
http://gephi.org/ App
Many Eyes
http://www-958.ibm.com/software/analytics/manyeyes/ Online
AND MORE…
Many Eyes
Word clouds - Tagxedo
http://www.tagxedo.com/ Online
Tableau Public
http://www.tableausoftware.com/public/
(Windows only)
http://www.tableausoftware.com/public/gallery/making-pay-gap-look-good
http://www.tableausoftware.com/public/gallery/breaking-law-canadian-style
App
Shareability
•  Vector Graphics software:
–  Adobe Illustrator
–  Inkscape http://inkscape.org/
•  Publish zoomable infographics online:
–  http://www.closr.it/
–  http://zoom.it/
•  Tracking impact:
–  Google analytics http://www.google.com/analytics/
–  Pixel-ping http://documentcloud.github.io/pixel-ping/
App
App
Online
Online
Online
Tool
Advanced Techniques
•  For creating custom, interactive
visualisations (some coding required):
–  R http://www.r-project.org/
–  Processing http://processing.org/
–  Visualisation code libraries e.g.
• Data-Driven Documents (D3) http://d3js.org/
• Prefuse http://prefuse.org/
Resources
•  Videos:
–  http://datajournalism.stanford.edu/
–  http://teachingtosee.org/film/TeachingToSee.html
•  Podcast:
–  http://datastori.es/
•  Websites:
–  http://www.visualizing.org/
–  http://visual.ly/
–  http://flowingdata.com/
–  http://www.visualcomplexity.com/vc/
–  http://www.informationisbeautiful.net/
Books
•  Data Journalism Handbook
–  http://datajournalismhandbook.org/1.0/en/
•  The Back of the Napkin: Solving Problems and
Selling Ideas with Pictures - Dan Roam
•  The Wall Street Journal Guide to Information
Graphics: The Dos and Don'ts of Presenting Data,
Facts, and Figures - Donna M. Wong
•  Show Me the Numbers: Designing Tables and
Graphs to Enlighten - Stephen Few
1 of 41

More Related Content

What's hot(20)

AWS Intelligent at Edge for IoTAWS Intelligent at Edge for IoT
AWS Intelligent at Edge for IoT
Amazon Web Services2.2K views
Great Speakers Tell StoriesGreat Speakers Tell Stories
Great Speakers Tell Stories
Slides That Rock167.8K views
Infographics Text Lists Powerpoint diagramsInfographics Text Lists Powerpoint diagrams
Infographics Text Lists Powerpoint diagrams
Peter Zvirinsky13.5K views
Sketchnoting: 10 Tips to get StartedSketchnoting: 10 Tips to get Started
Sketchnoting: 10 Tips to get Started
Silvia Rosenthal Tolisano118K views
The Science of PresentationsThe Science of Presentations
The Science of Presentations
Mike Taylor3.4K views
AcademicHandbookAcademicHandbook
AcademicHandbook
Kyle Moulton, TS/SCI1.7K views
How to make efficient powerpoint slidesHow to make efficient powerpoint slides
How to make efficient powerpoint slides
Balasubramanian Thiagarajan18.9K views
Agenda PPT SlideAgenda PPT Slide
Agenda PPT Slide
SlideTeam635 views
7 PowerPoint Design Hacks7 PowerPoint Design Hacks
7 PowerPoint Design Hacks
Clariant Creative Agency3.8K views
Fight the Power(point)!Fight the Power(point)!
Fight the Power(point)!
Todd Reubold384.5K views
Presentaciones impactantesPresentaciones impactantes
Presentaciones impactantes
Javier Golding15.1K views

Viewers also liked(20)

The 8 Hats of Data VisualisationThe 8 Hats of Data Visualisation
The 8 Hats of Data Visualisation
Andy Kirk81.8K views
Demogtrends-Sept12Demogtrends-Sept12
Demogtrends-Sept12
Alison Taylor274 views
5 Key Trends Redefining Australia5 Key Trends Redefining Australia
5 Key Trends Redefining Australia
Mark McCrindle729 views
Working Without EstimatesWorking Without Estimates
Working Without Estimates
ThoughtWorks Studios1K views

Similar to Intro to data visualisation(20)

Data visualisation toolsData visualisation tools
Data visualisation tools
GDNet - Global Development Network, Cairo Office482 views
HackferenceHackference
Hackference
Doug Sillars587 views
Milano uxMilano ux
Milano ux
Doug Sillars161 views
IT trends – 2013 & beyondIT trends – 2013 & beyond
IT trends – 2013 & beyond
Neha Mehta1.5K views
Ai based analytics in the cloudAi based analytics in the cloud
Ai based analytics in the cloud
Svetlin Stanchev160 views
Oggcamp Fast and Beautiful ImagesOggcamp Fast and Beautiful Images
Oggcamp Fast and Beautiful Images
Doug Sillars289 views
EIUG Edinburgh Joe Murphy librarian futuristEIUG Edinburgh Joe Murphy librarian futurist
EIUG Edinburgh Joe Murphy librarian futurist
Joe Murphy Librarian & Futurist2.5K views
Turin webperf meetupTurin webperf meetup
Turin webperf meetup
Doug Sillars392 views
Reading gdg imagesReading gdg images
Reading gdg images
Doug Sillars23 views
Architecture of Big Data SolutionsArchitecture of Big Data Solutions
Architecture of Big Data Solutions
Guido Schmutz1.3K views
Responsive Images and VideoResponsive Images and Video
Responsive Images and Video
Jason Grigsby6.2K views
Digital Transformation in MediaDigital Transformation in Media
Digital Transformation in Media
HARMAN Services6.1K views
Future Of Digital MarketingFuture Of Digital Marketing
Future Of Digital Marketing
Neil Perkin17.5K views

More from Anna Gerber

How the Web worksHow the Web works
How the Web worksAnna Gerber
495 views12 slides
"Serverless" express"Serverless" express
"Serverless" expressAnna Gerber
526 views22 slides
Iot 101Iot 101
Iot 101Anna Gerber
503 views28 slides

More from Anna Gerber(20)

Internet of Things (IoT) IntroInternet of Things (IoT) Intro
Internet of Things (IoT) Intro
Anna Gerber678 views
How the Web worksHow the Web works
How the Web works
Anna Gerber495 views
Do you want to build a robotDo you want to build a robot
Do you want to build a robot
Anna Gerber619 views
"Serverless" express"Serverless" express
"Serverless" express
Anna Gerber526 views
Iot 101Iot 101
Iot 101
Anna Gerber503 views
3D Printing Action Heroes3D Printing Action Heroes
3D Printing Action Heroes
Anna Gerber1.7K views
3D Sculpting Action Heroes3D Sculpting Action Heroes
3D Sculpting Action Heroes
Anna Gerber1.5K views
JavaScript RoboticsJavaScript Robotics
JavaScript Robotics
Anna Gerber2.1K views
Intro to Electronics in PythonIntro to Electronics in Python
Intro to Electronics in Python
Anna Gerber6.8K views
Getting started with the Trove APIGetting started with the Trove API
Getting started with the Trove API
Anna Gerber1.2K views
Intro to JavaIntro to Java
Intro to Java
Anna Gerber456 views
Using Yahoo PipesUsing Yahoo Pipes
Using Yahoo Pipes
Anna Gerber1.2K views

Recently uploaded(20)

METHOD AND SYSTEM FOR PREDICTING OPTIMAL LOAD FOR WHICH THE YIELD IS MAXIMUM ...METHOD AND SYSTEM FOR PREDICTING OPTIMAL LOAD FOR WHICH THE YIELD IS MAXIMUM ...
METHOD AND SYSTEM FOR PREDICTING OPTIMAL LOAD FOR WHICH THE YIELD IS MAXIMUM ...
Prity Khastgir IPR Strategic India Patent Attorney Amplify Innovation24 views
Java Platform Approach 1.0 - Picnic MeetupJava Platform Approach 1.0 - Picnic Meetup
Java Platform Approach 1.0 - Picnic Meetup
Rick Ossendrijver24 views
The Research Portal of Catalonia: Growing more (information) & more (services)The Research Portal of Catalonia: Growing more (information) & more (services)
The Research Portal of Catalonia: Growing more (information) & more (services)
CSUC - Consorci de Serveis Universitaris de Catalunya59 views
Web Dev - 1 PPT.pdfWeb Dev - 1 PPT.pdf
Web Dev - 1 PPT.pdf
gdsczhcet49 views

Intro to data visualisation