Download to read offline
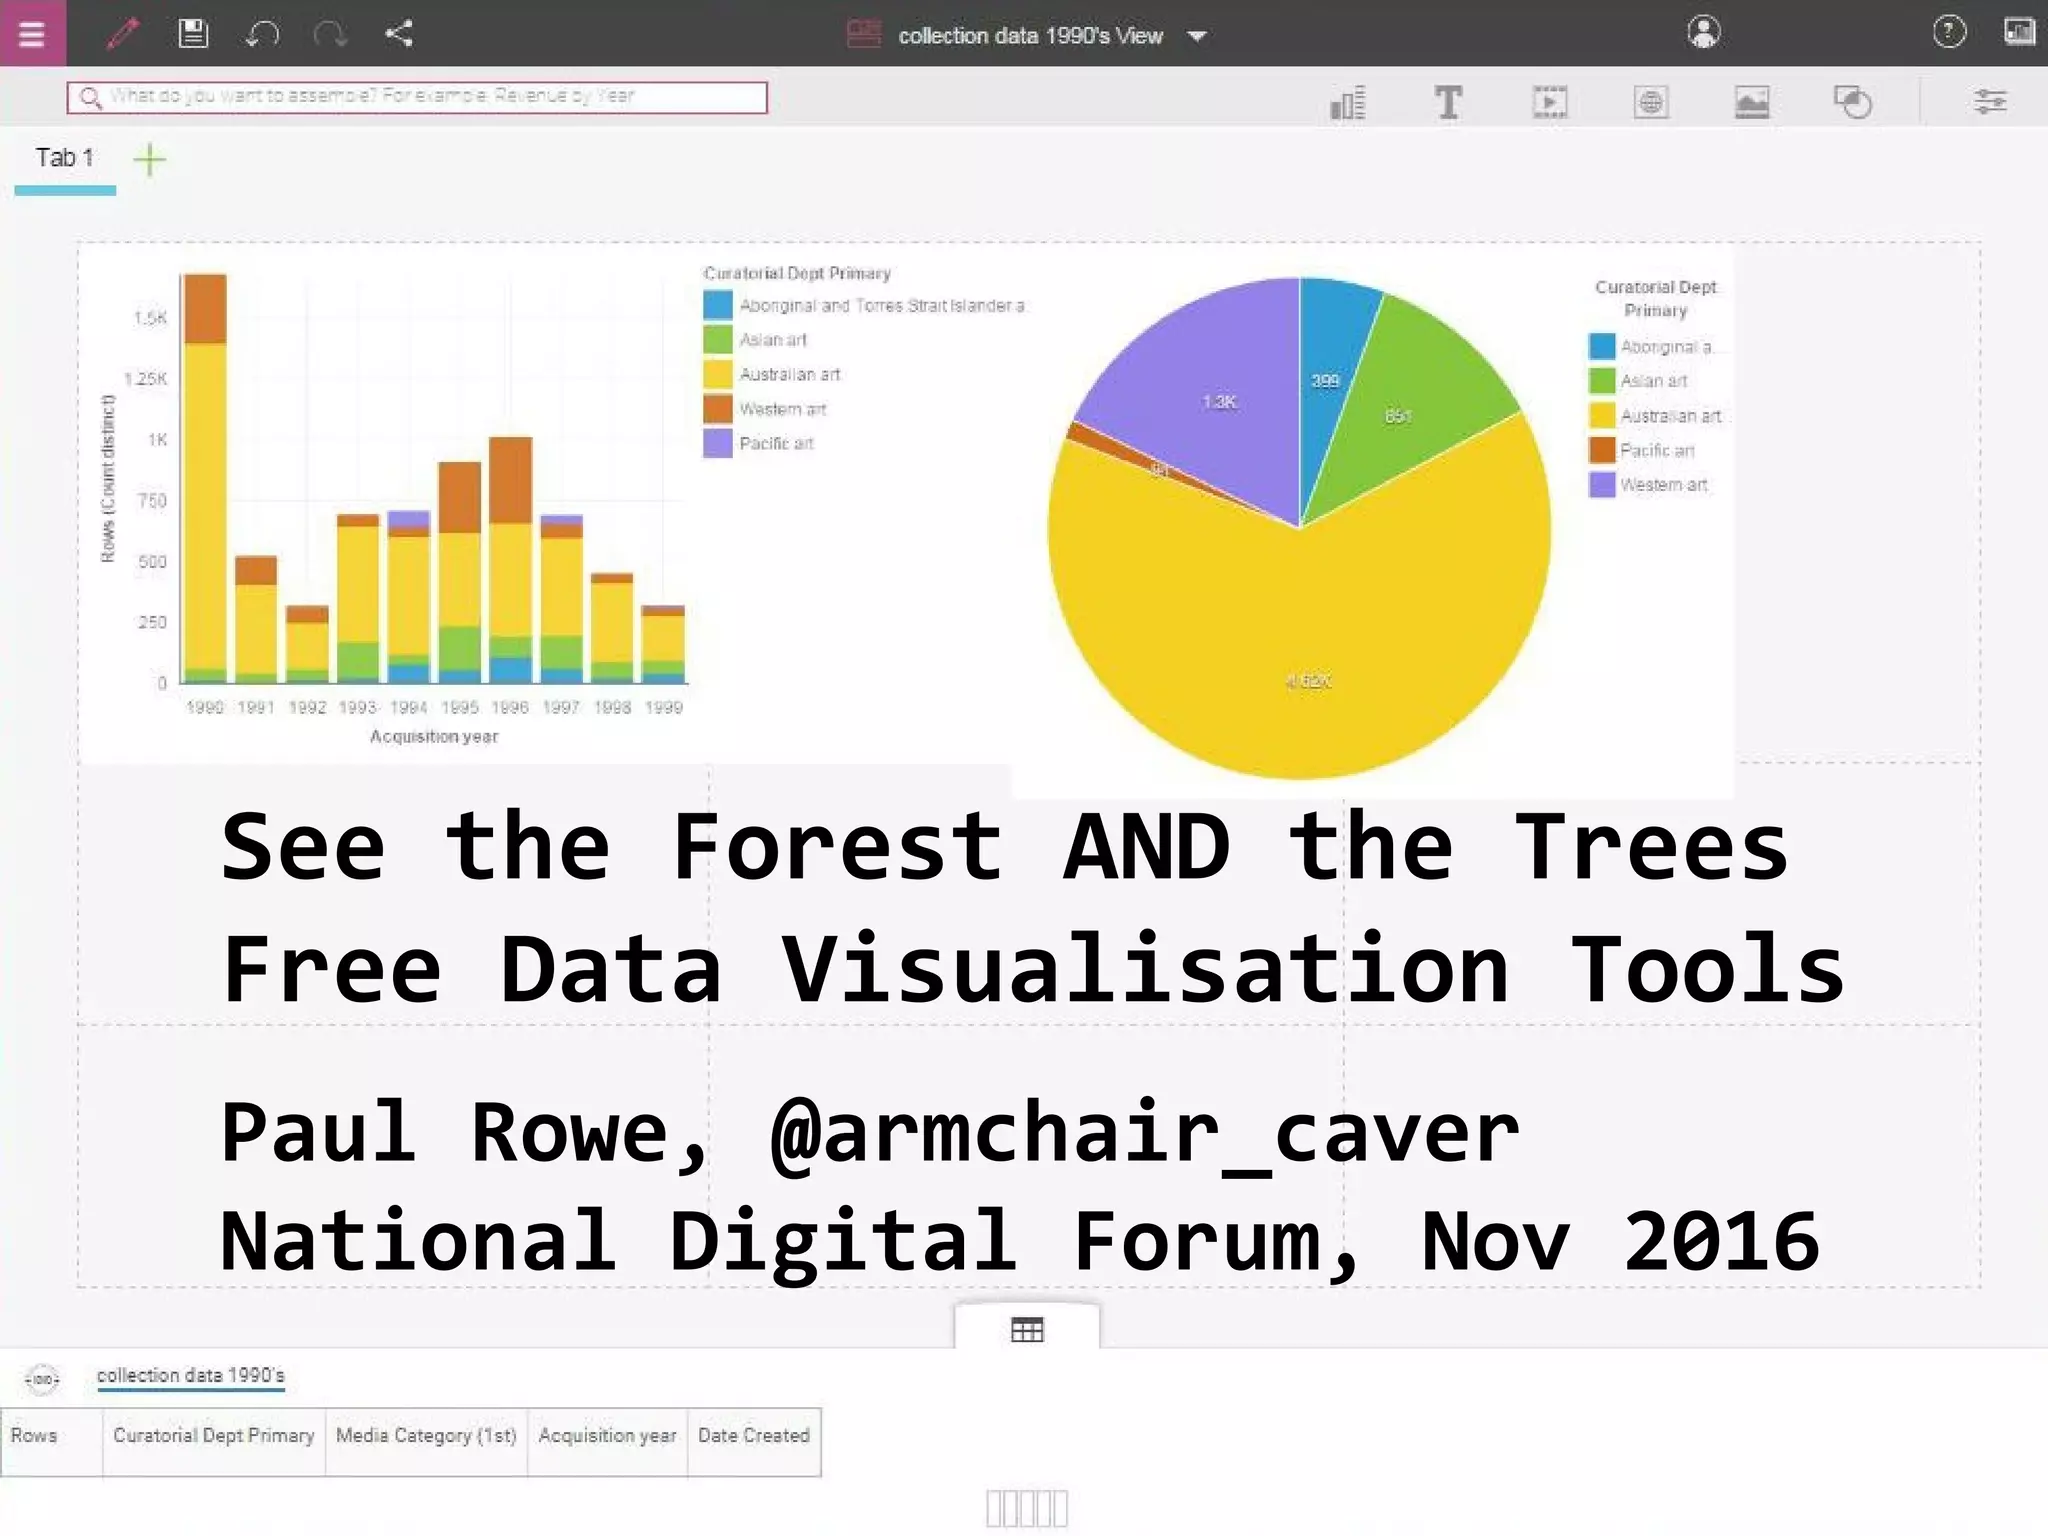
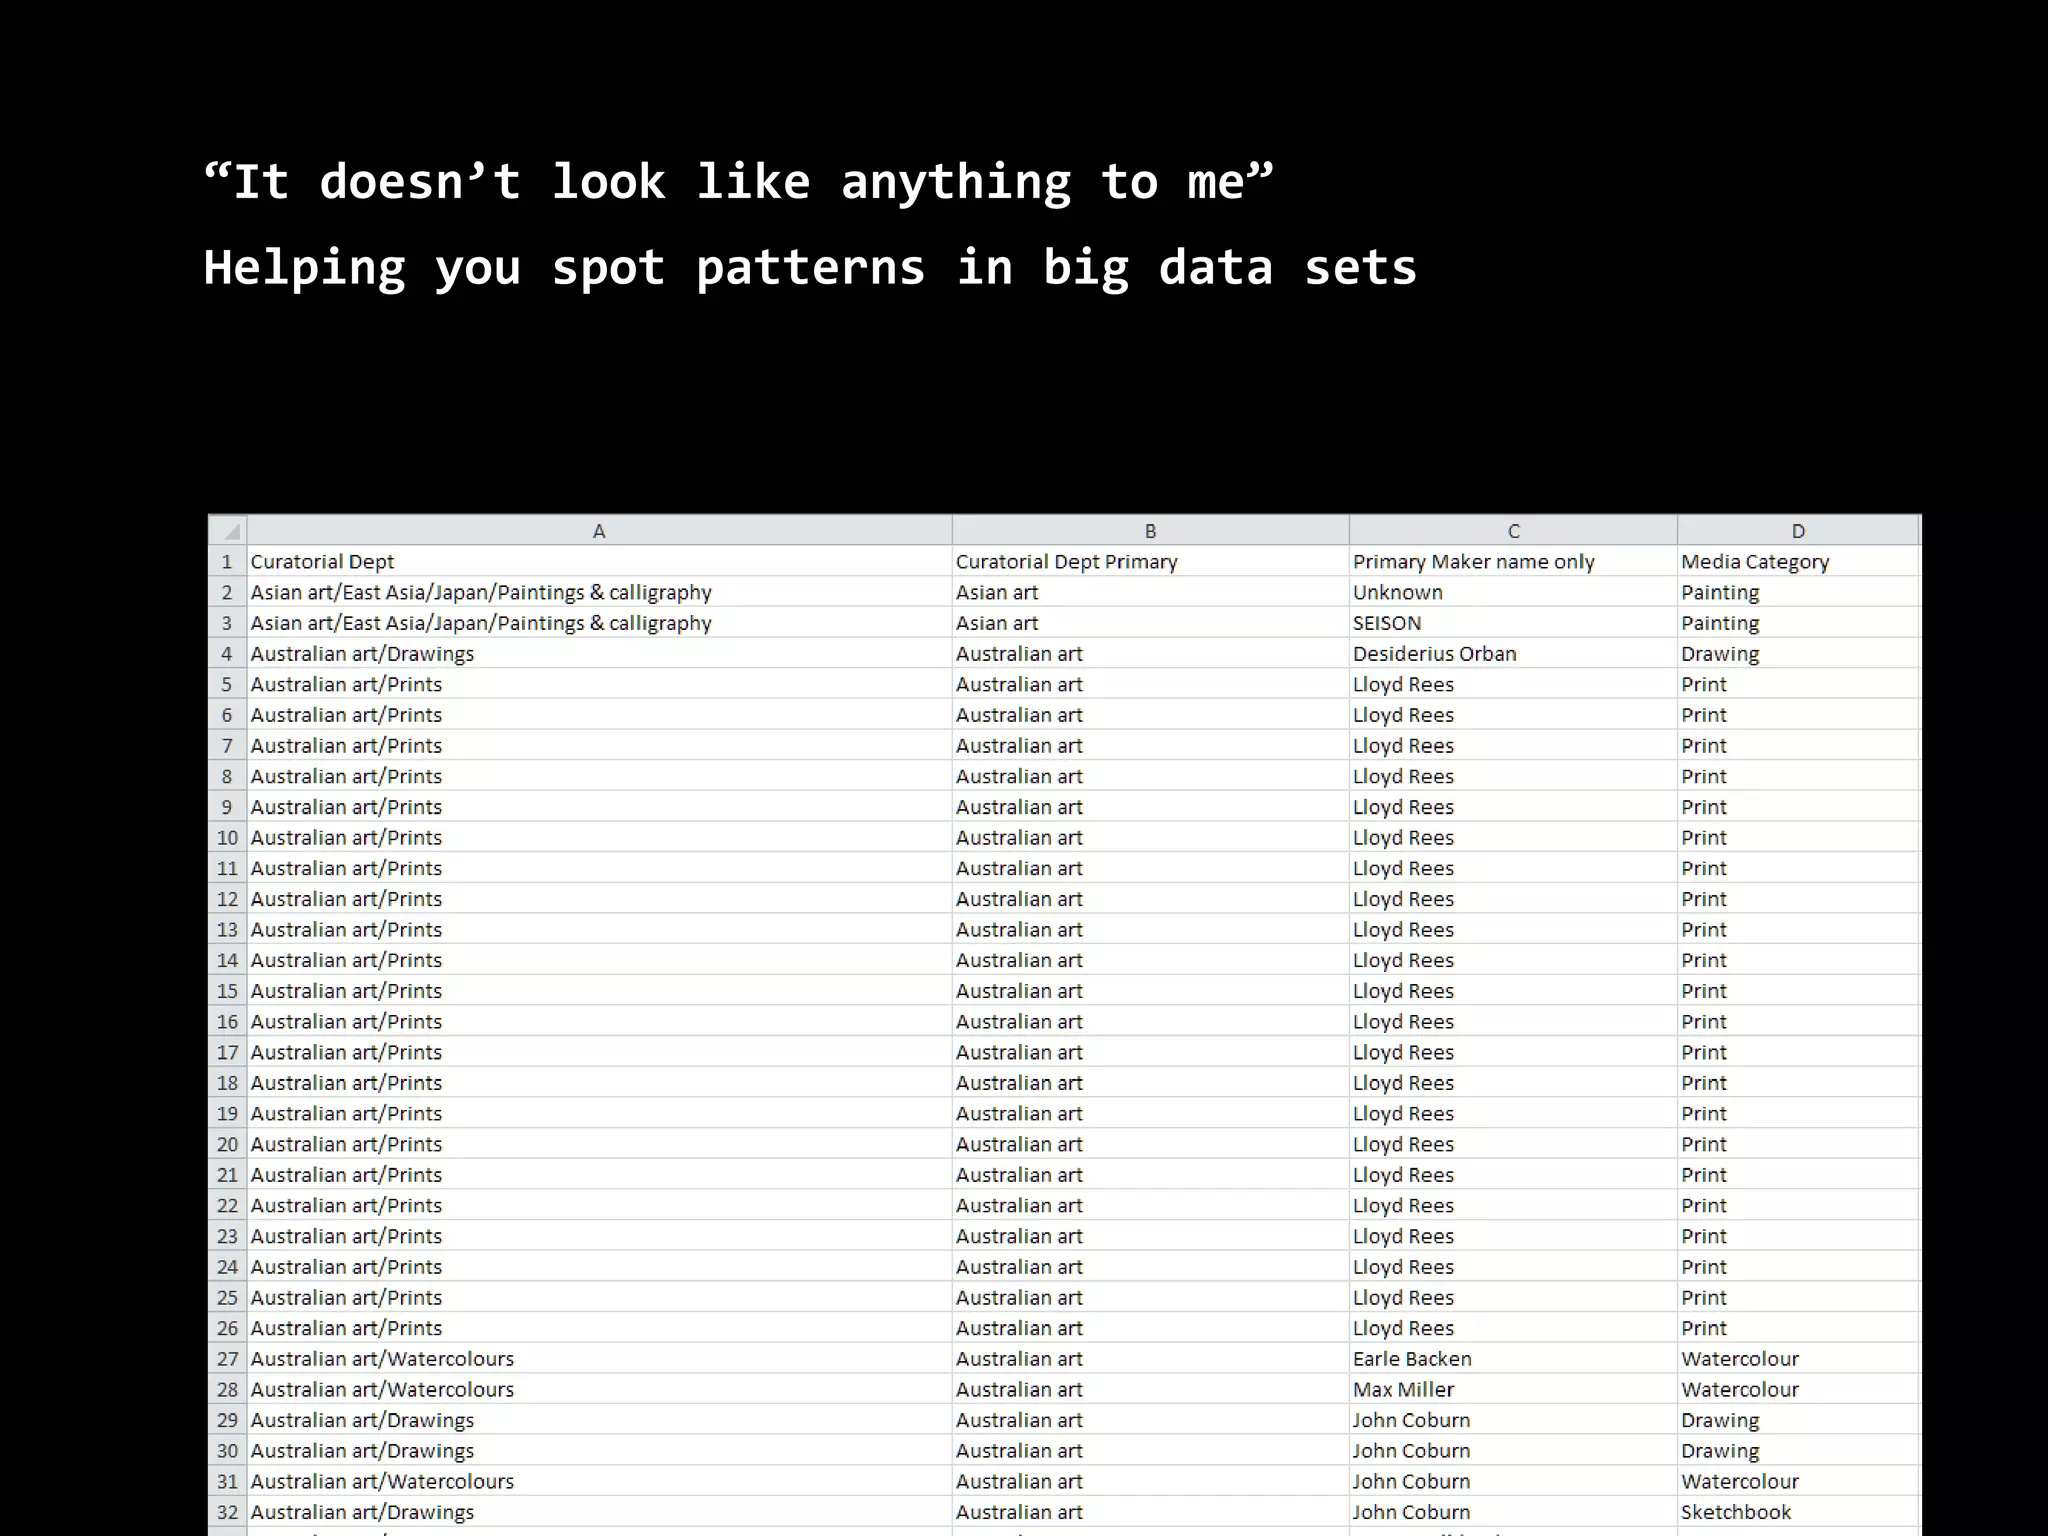
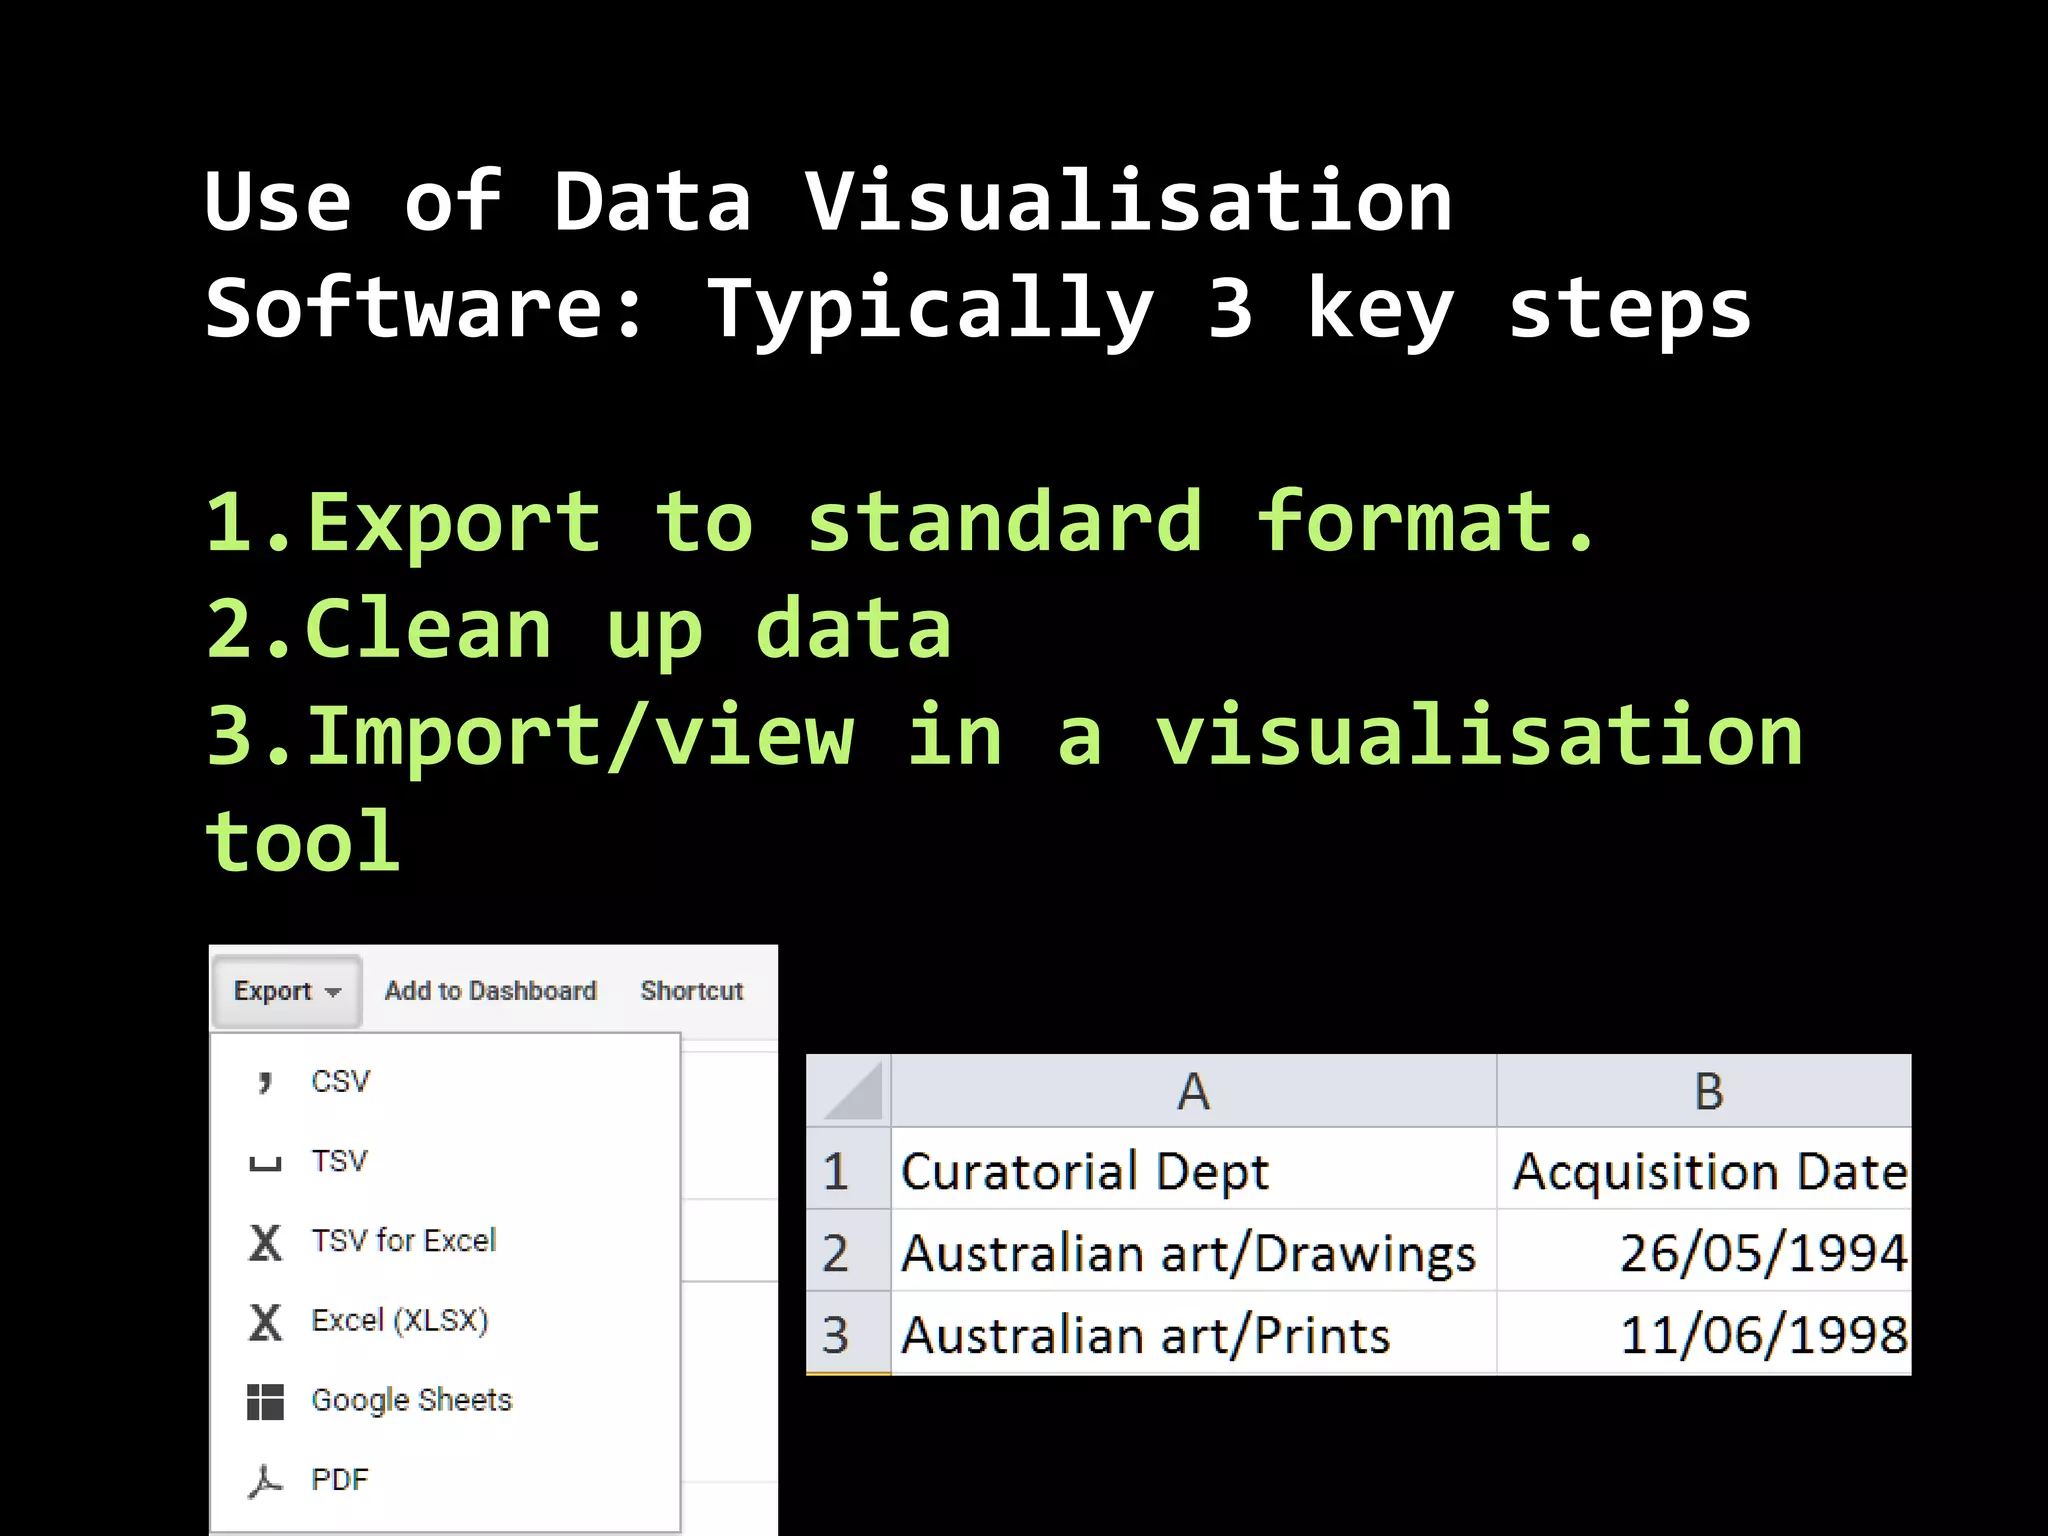
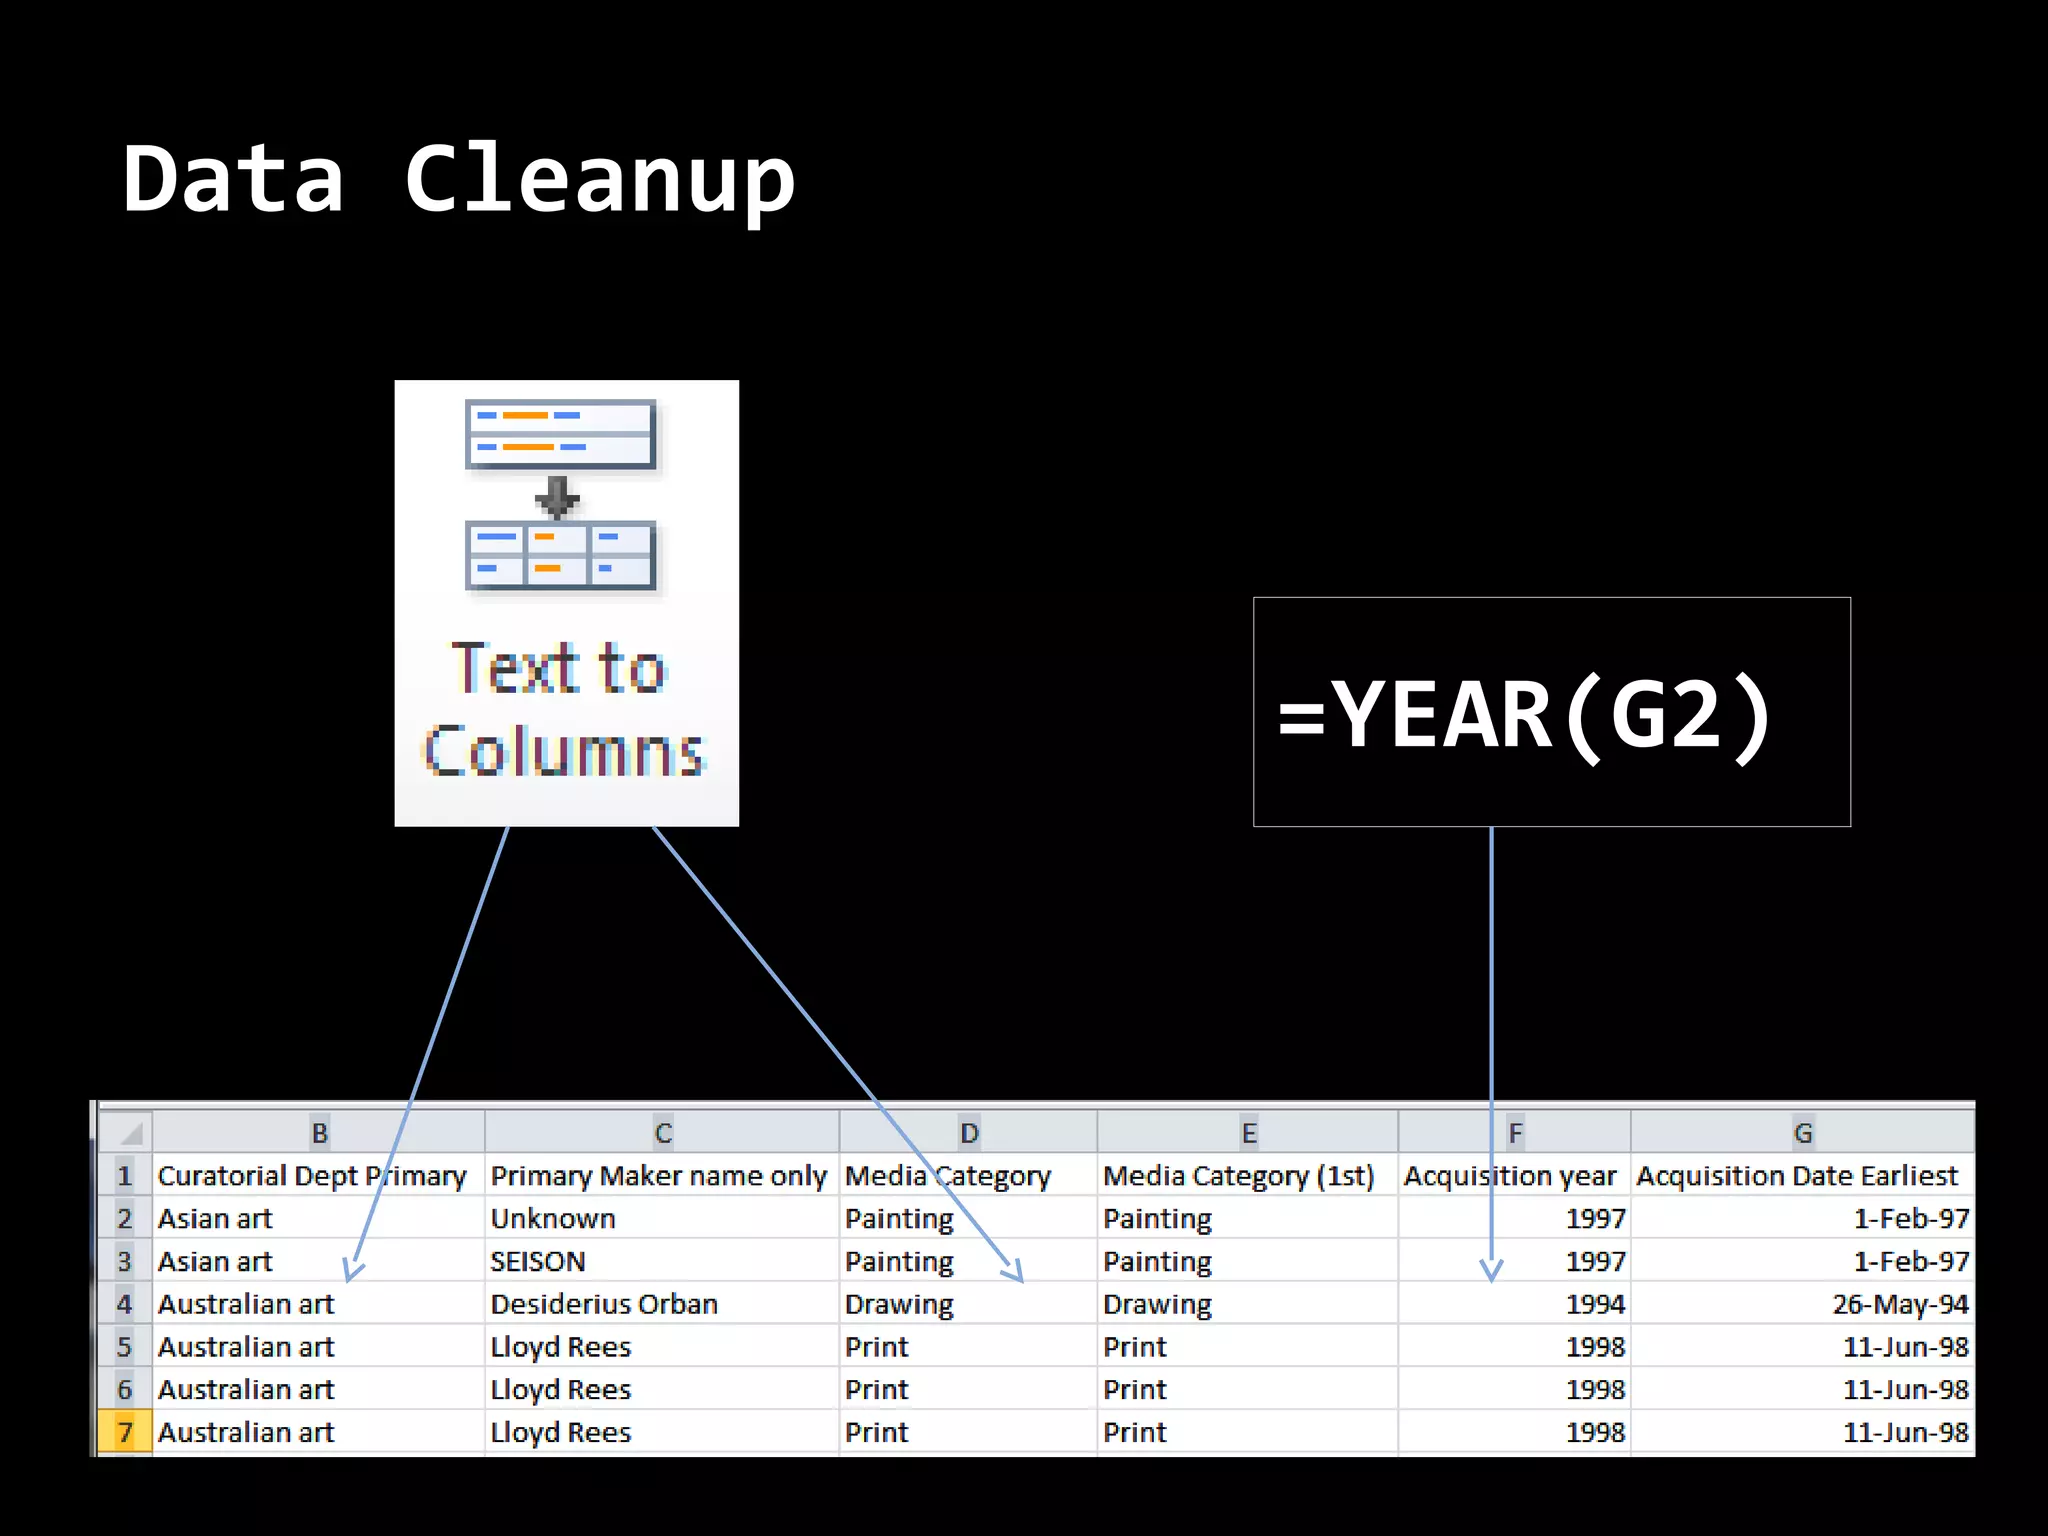
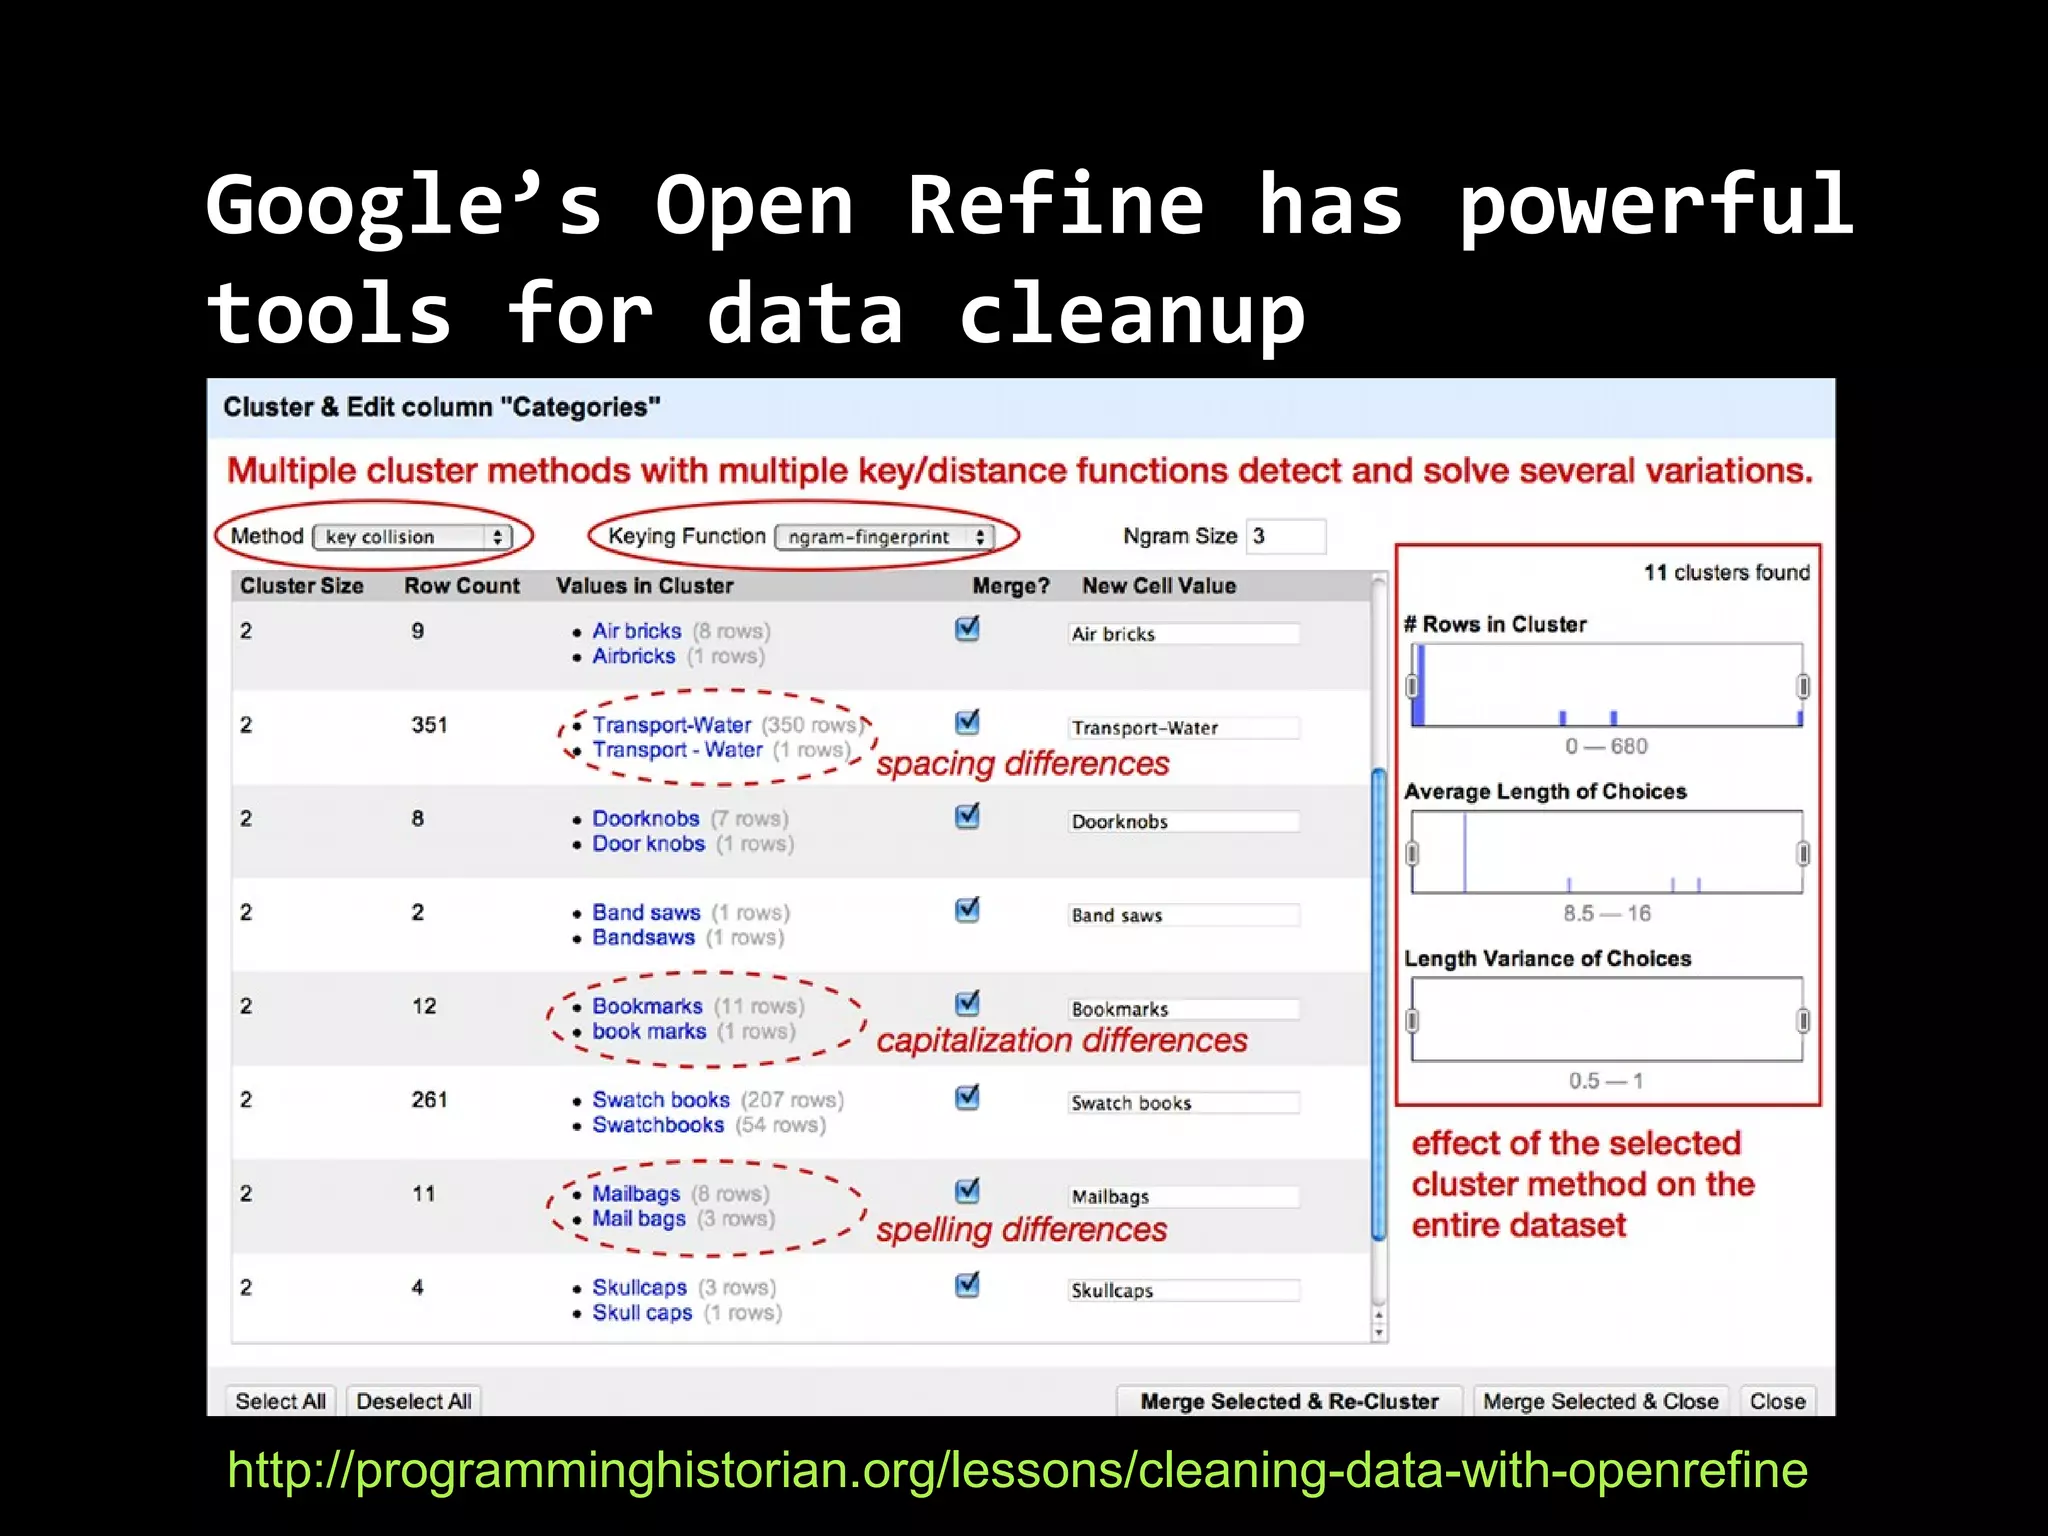
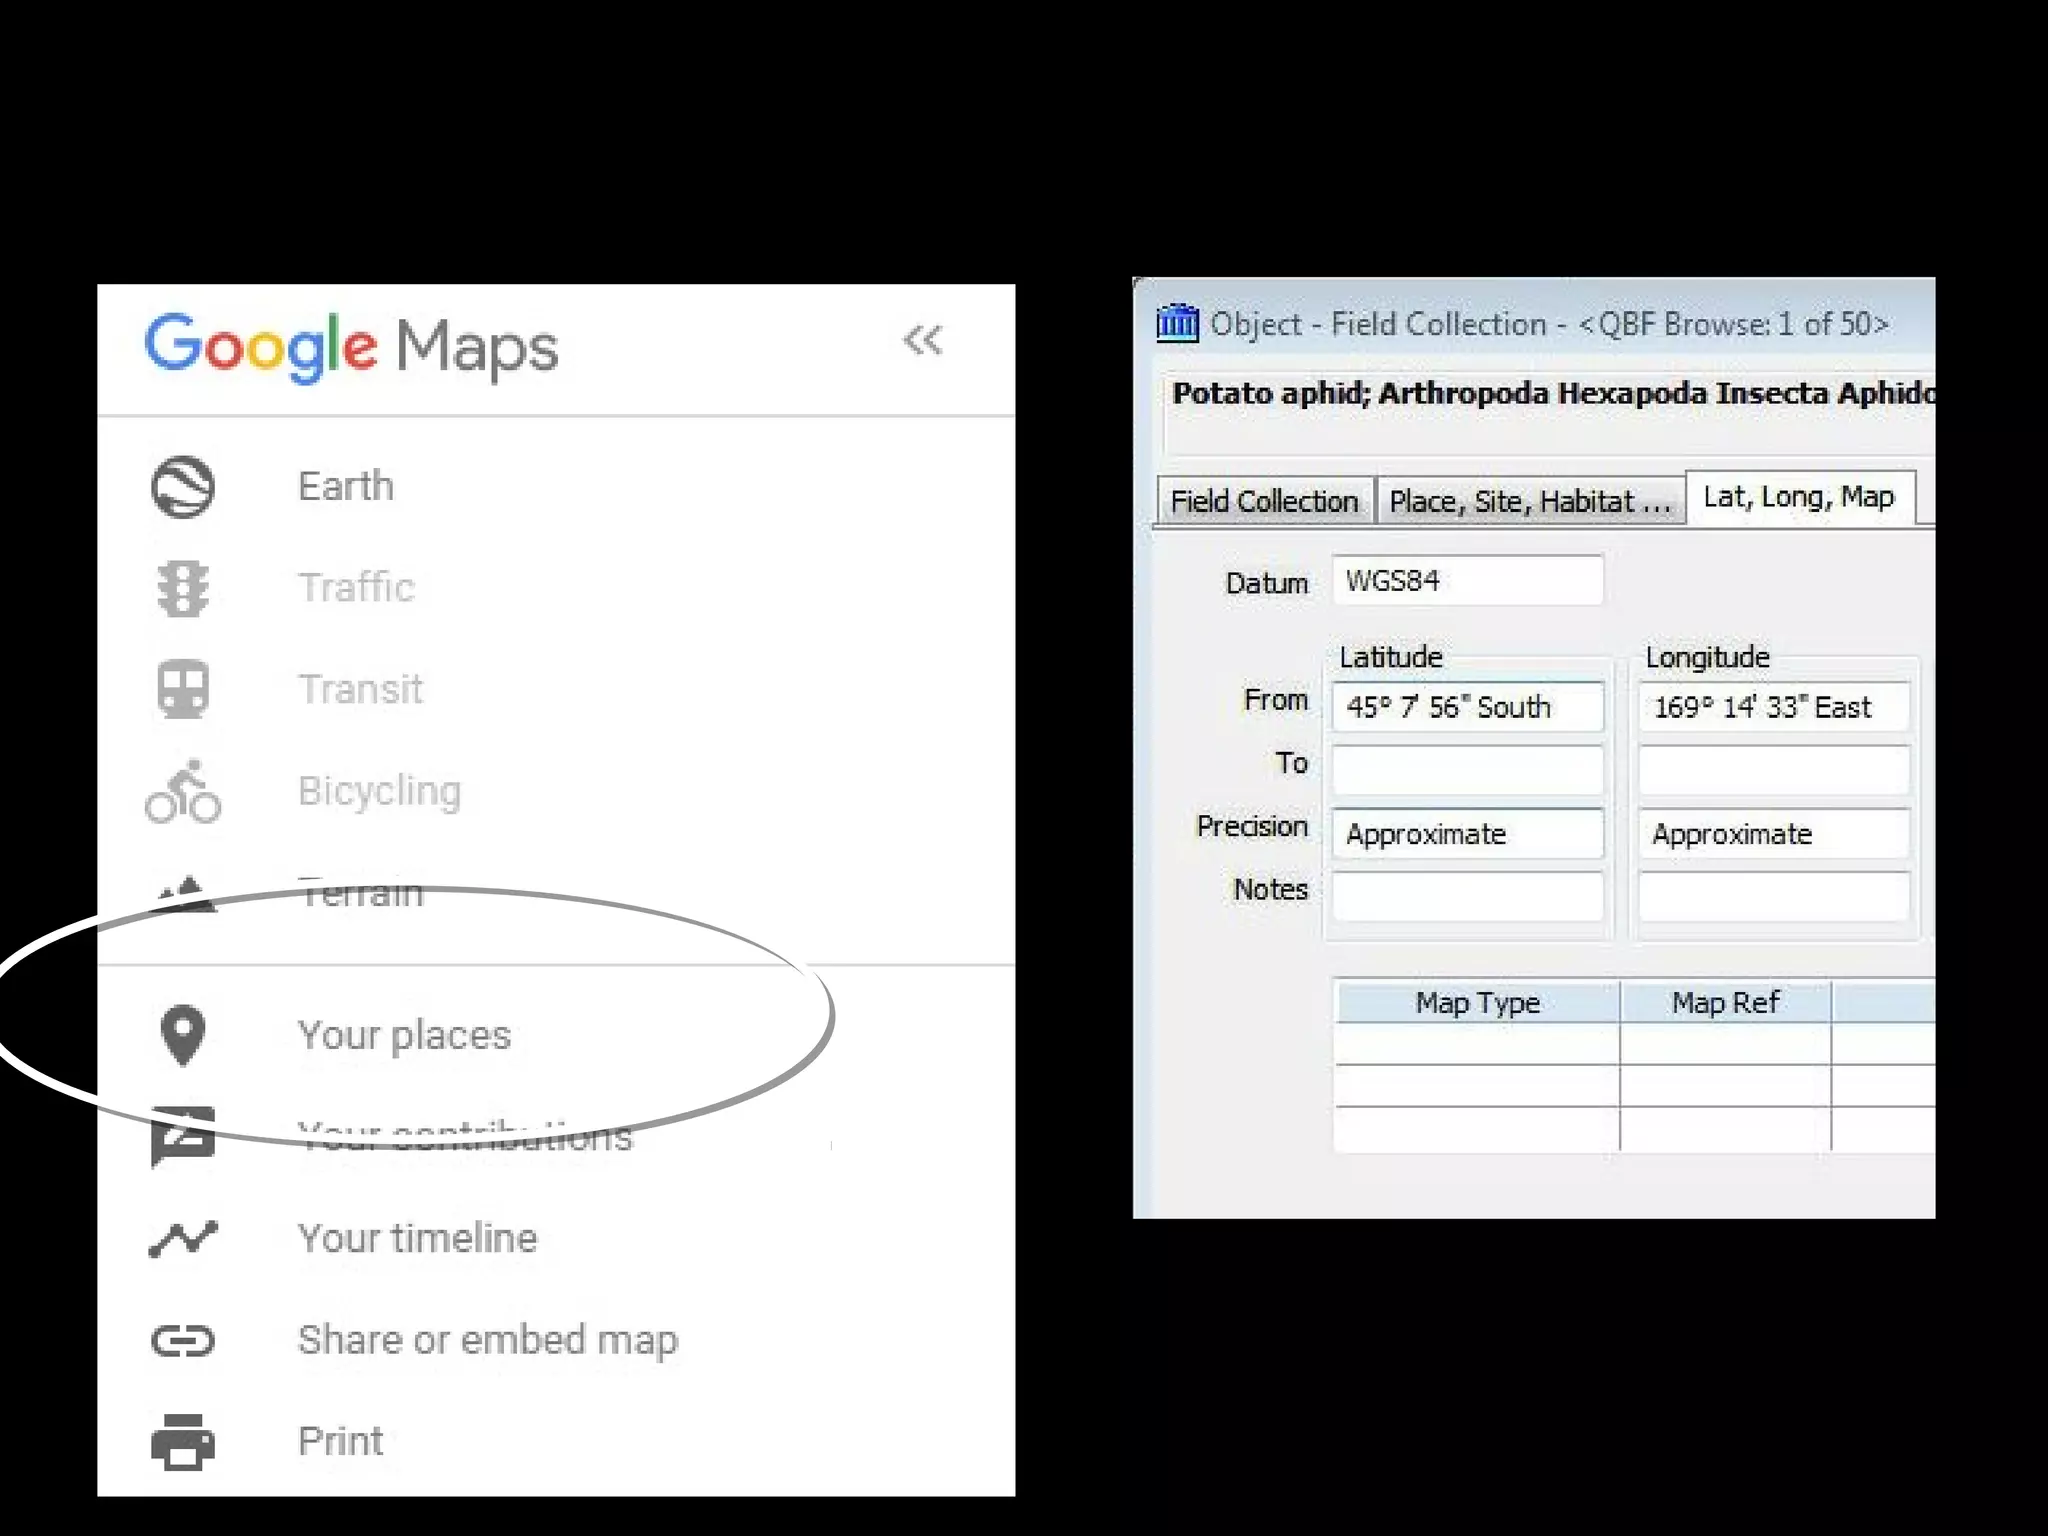
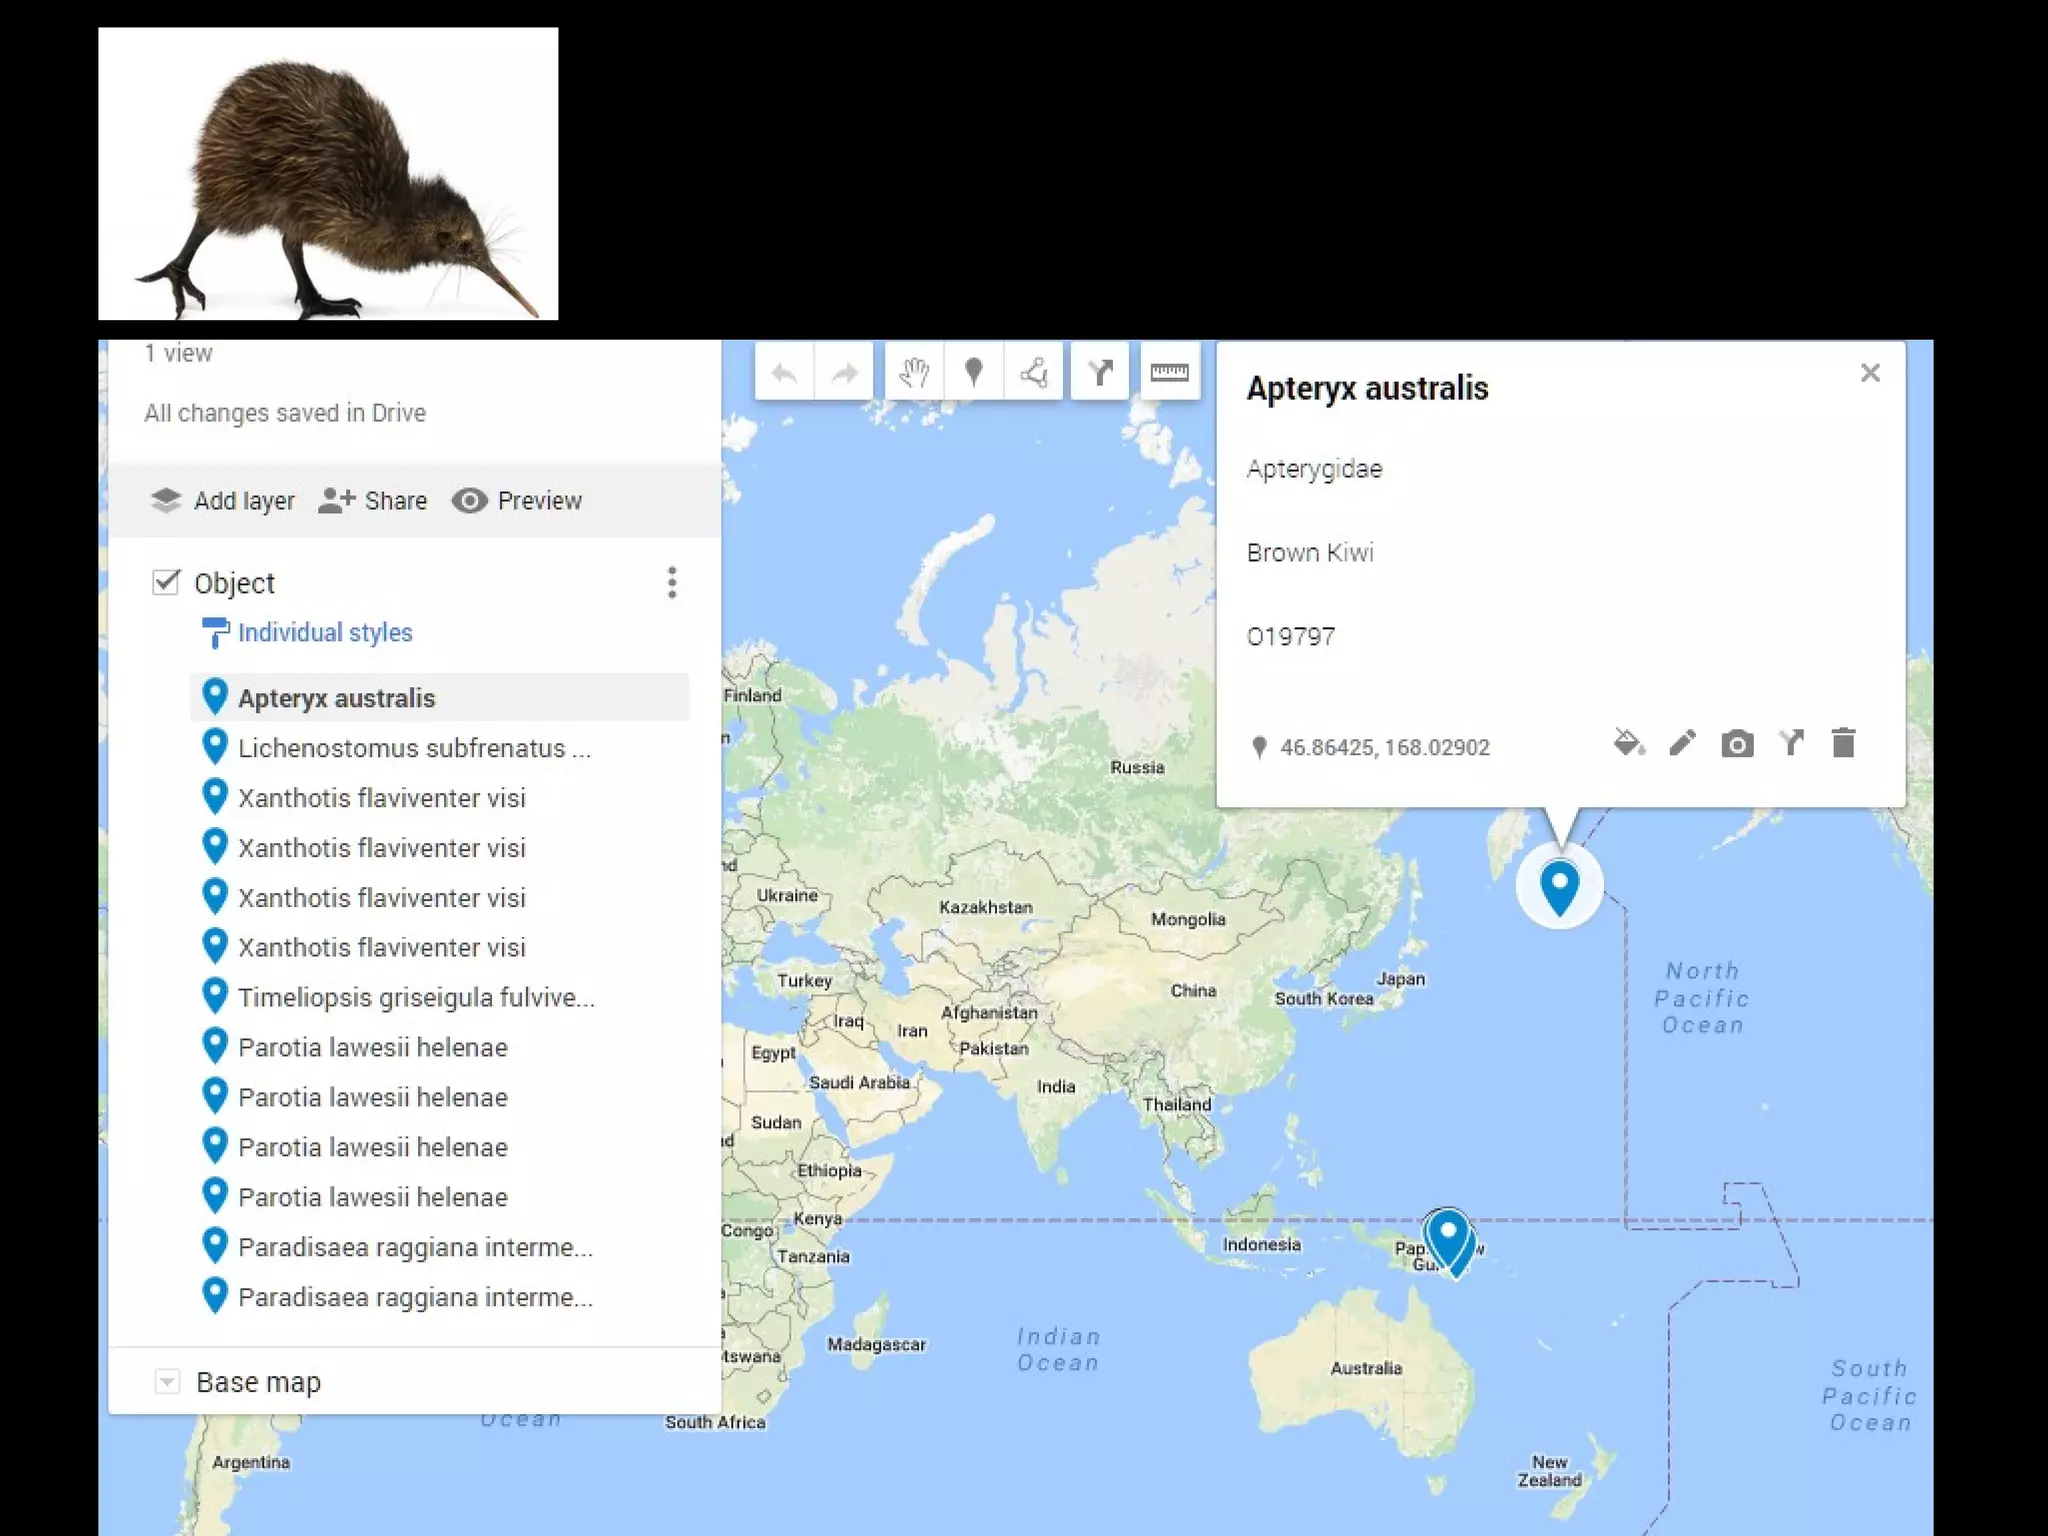
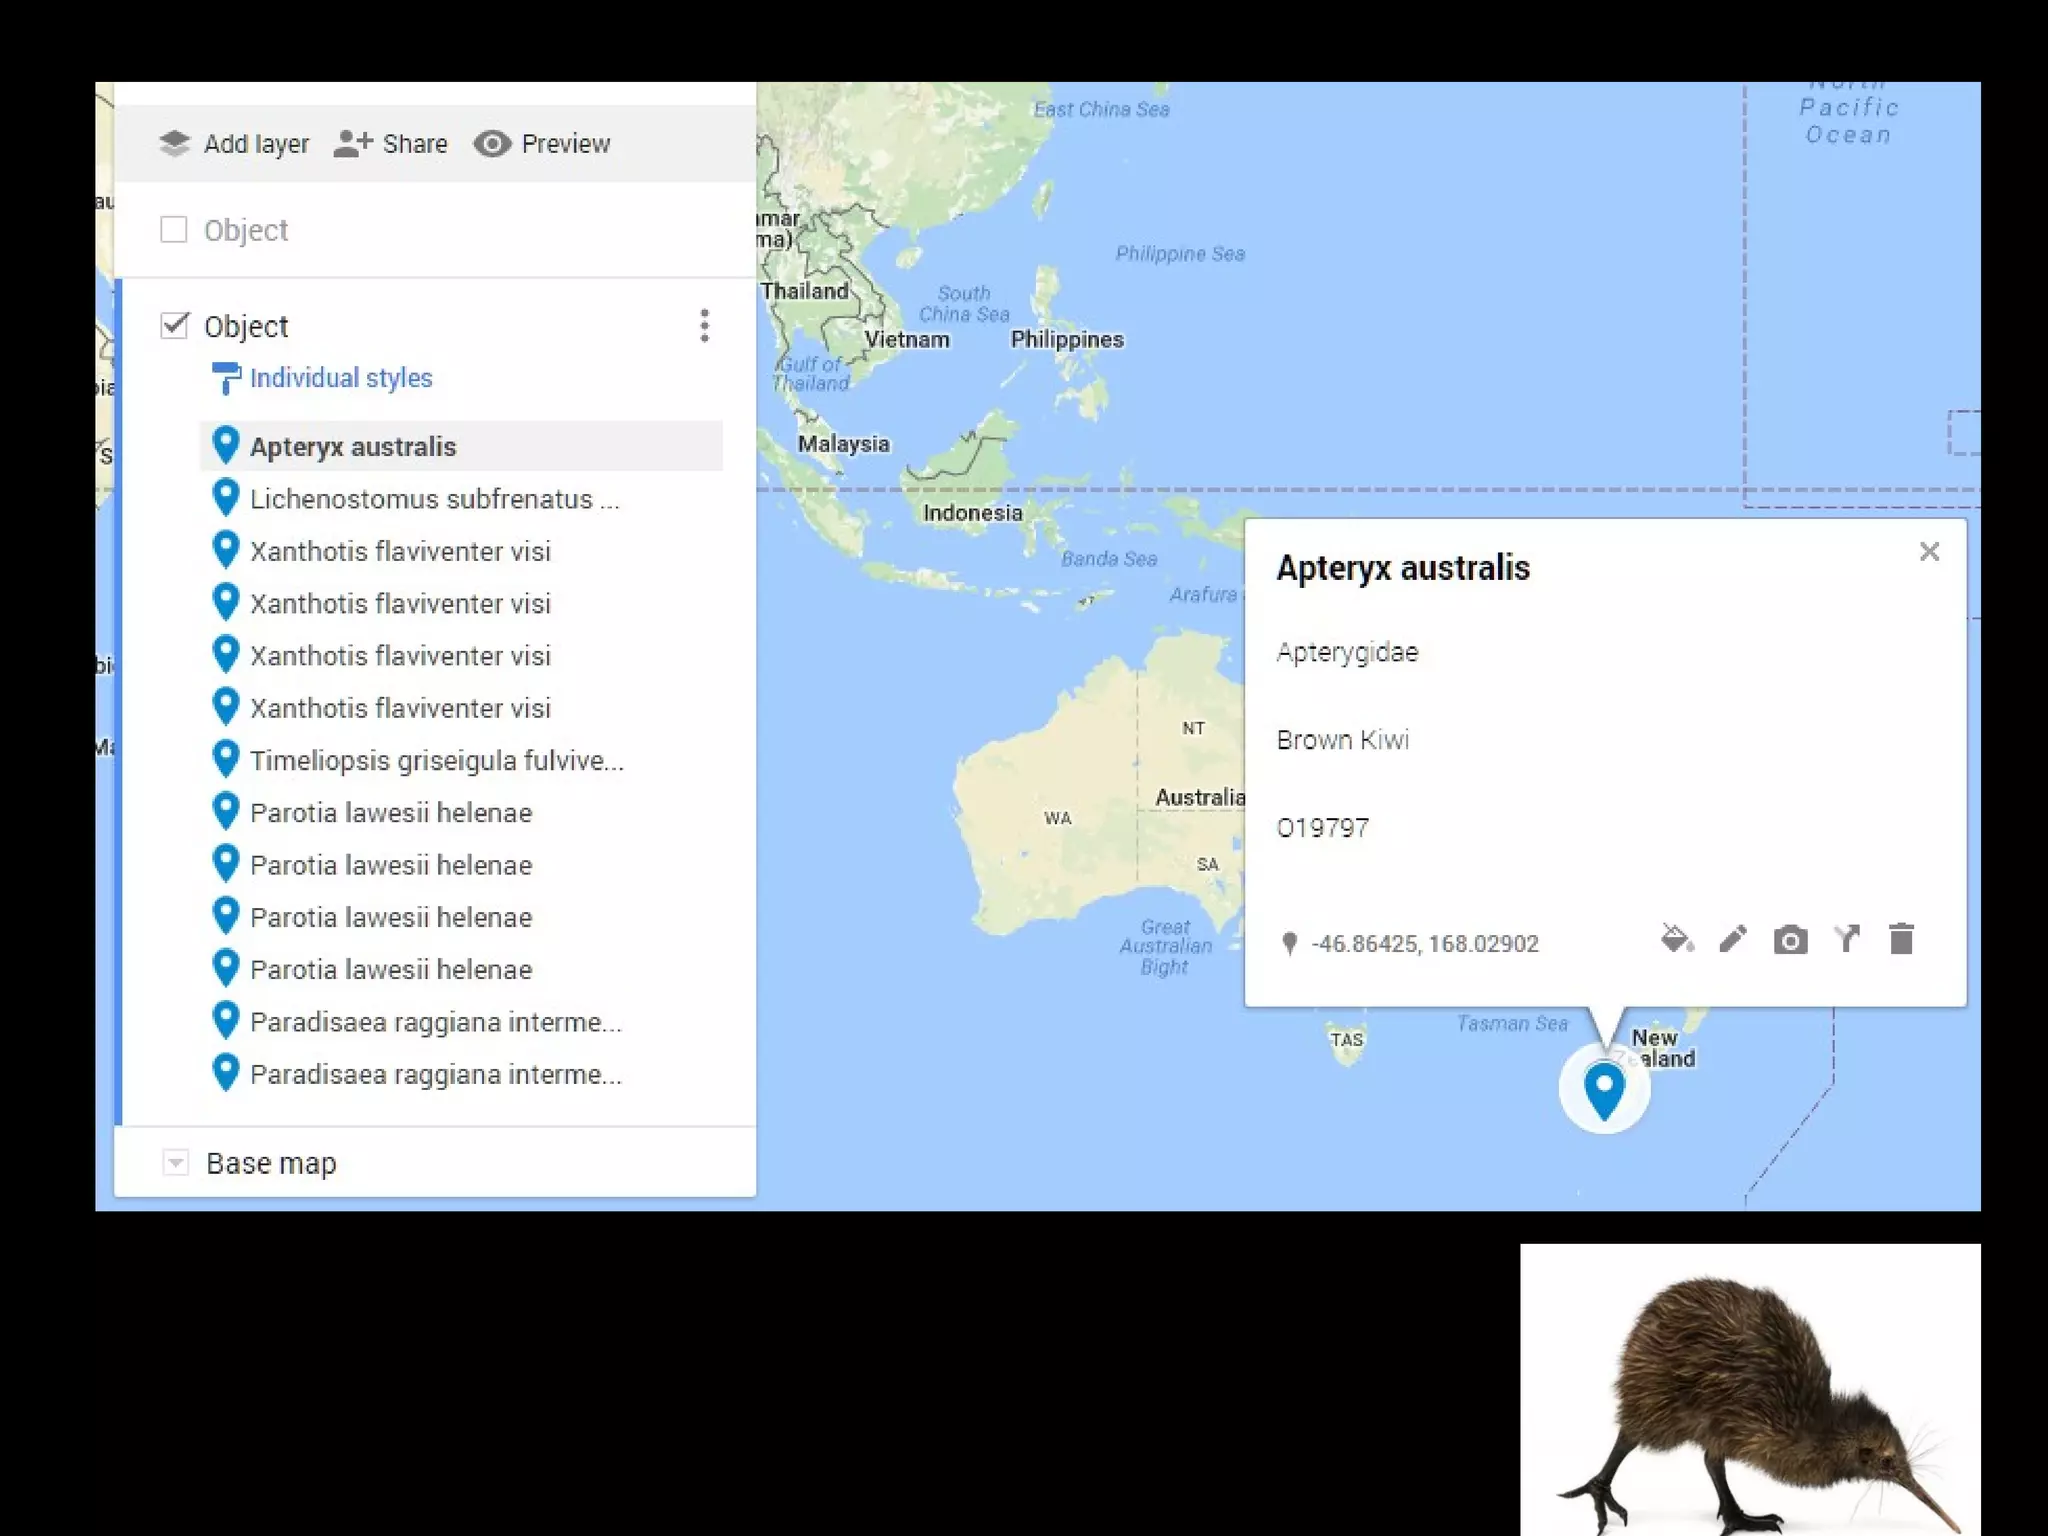
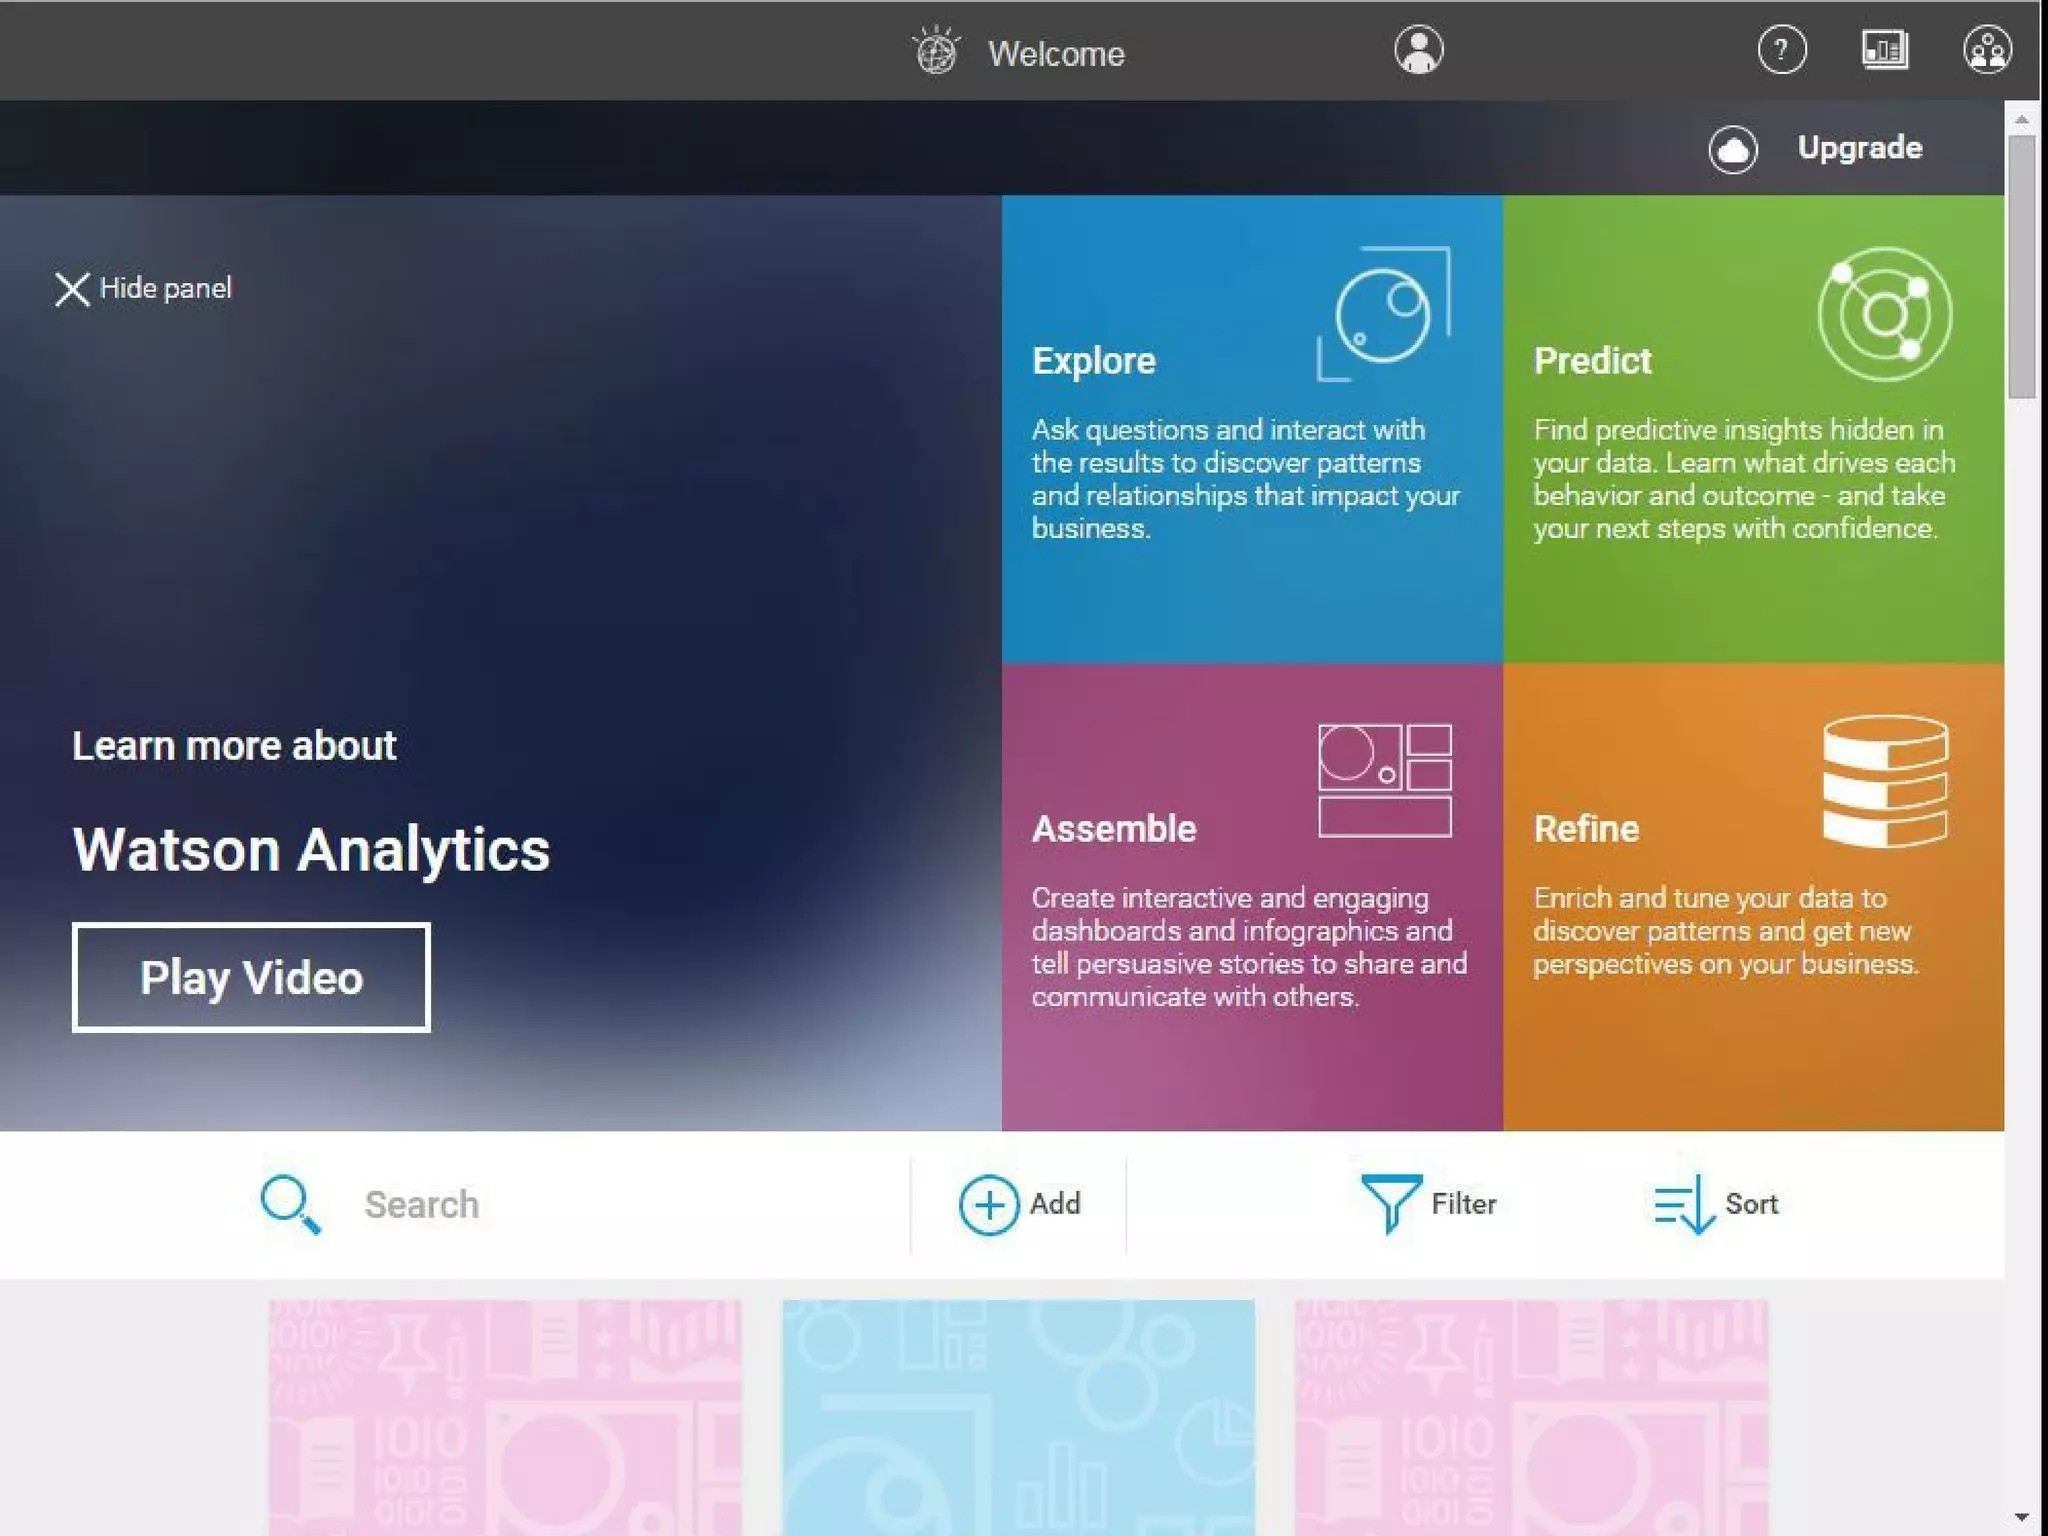
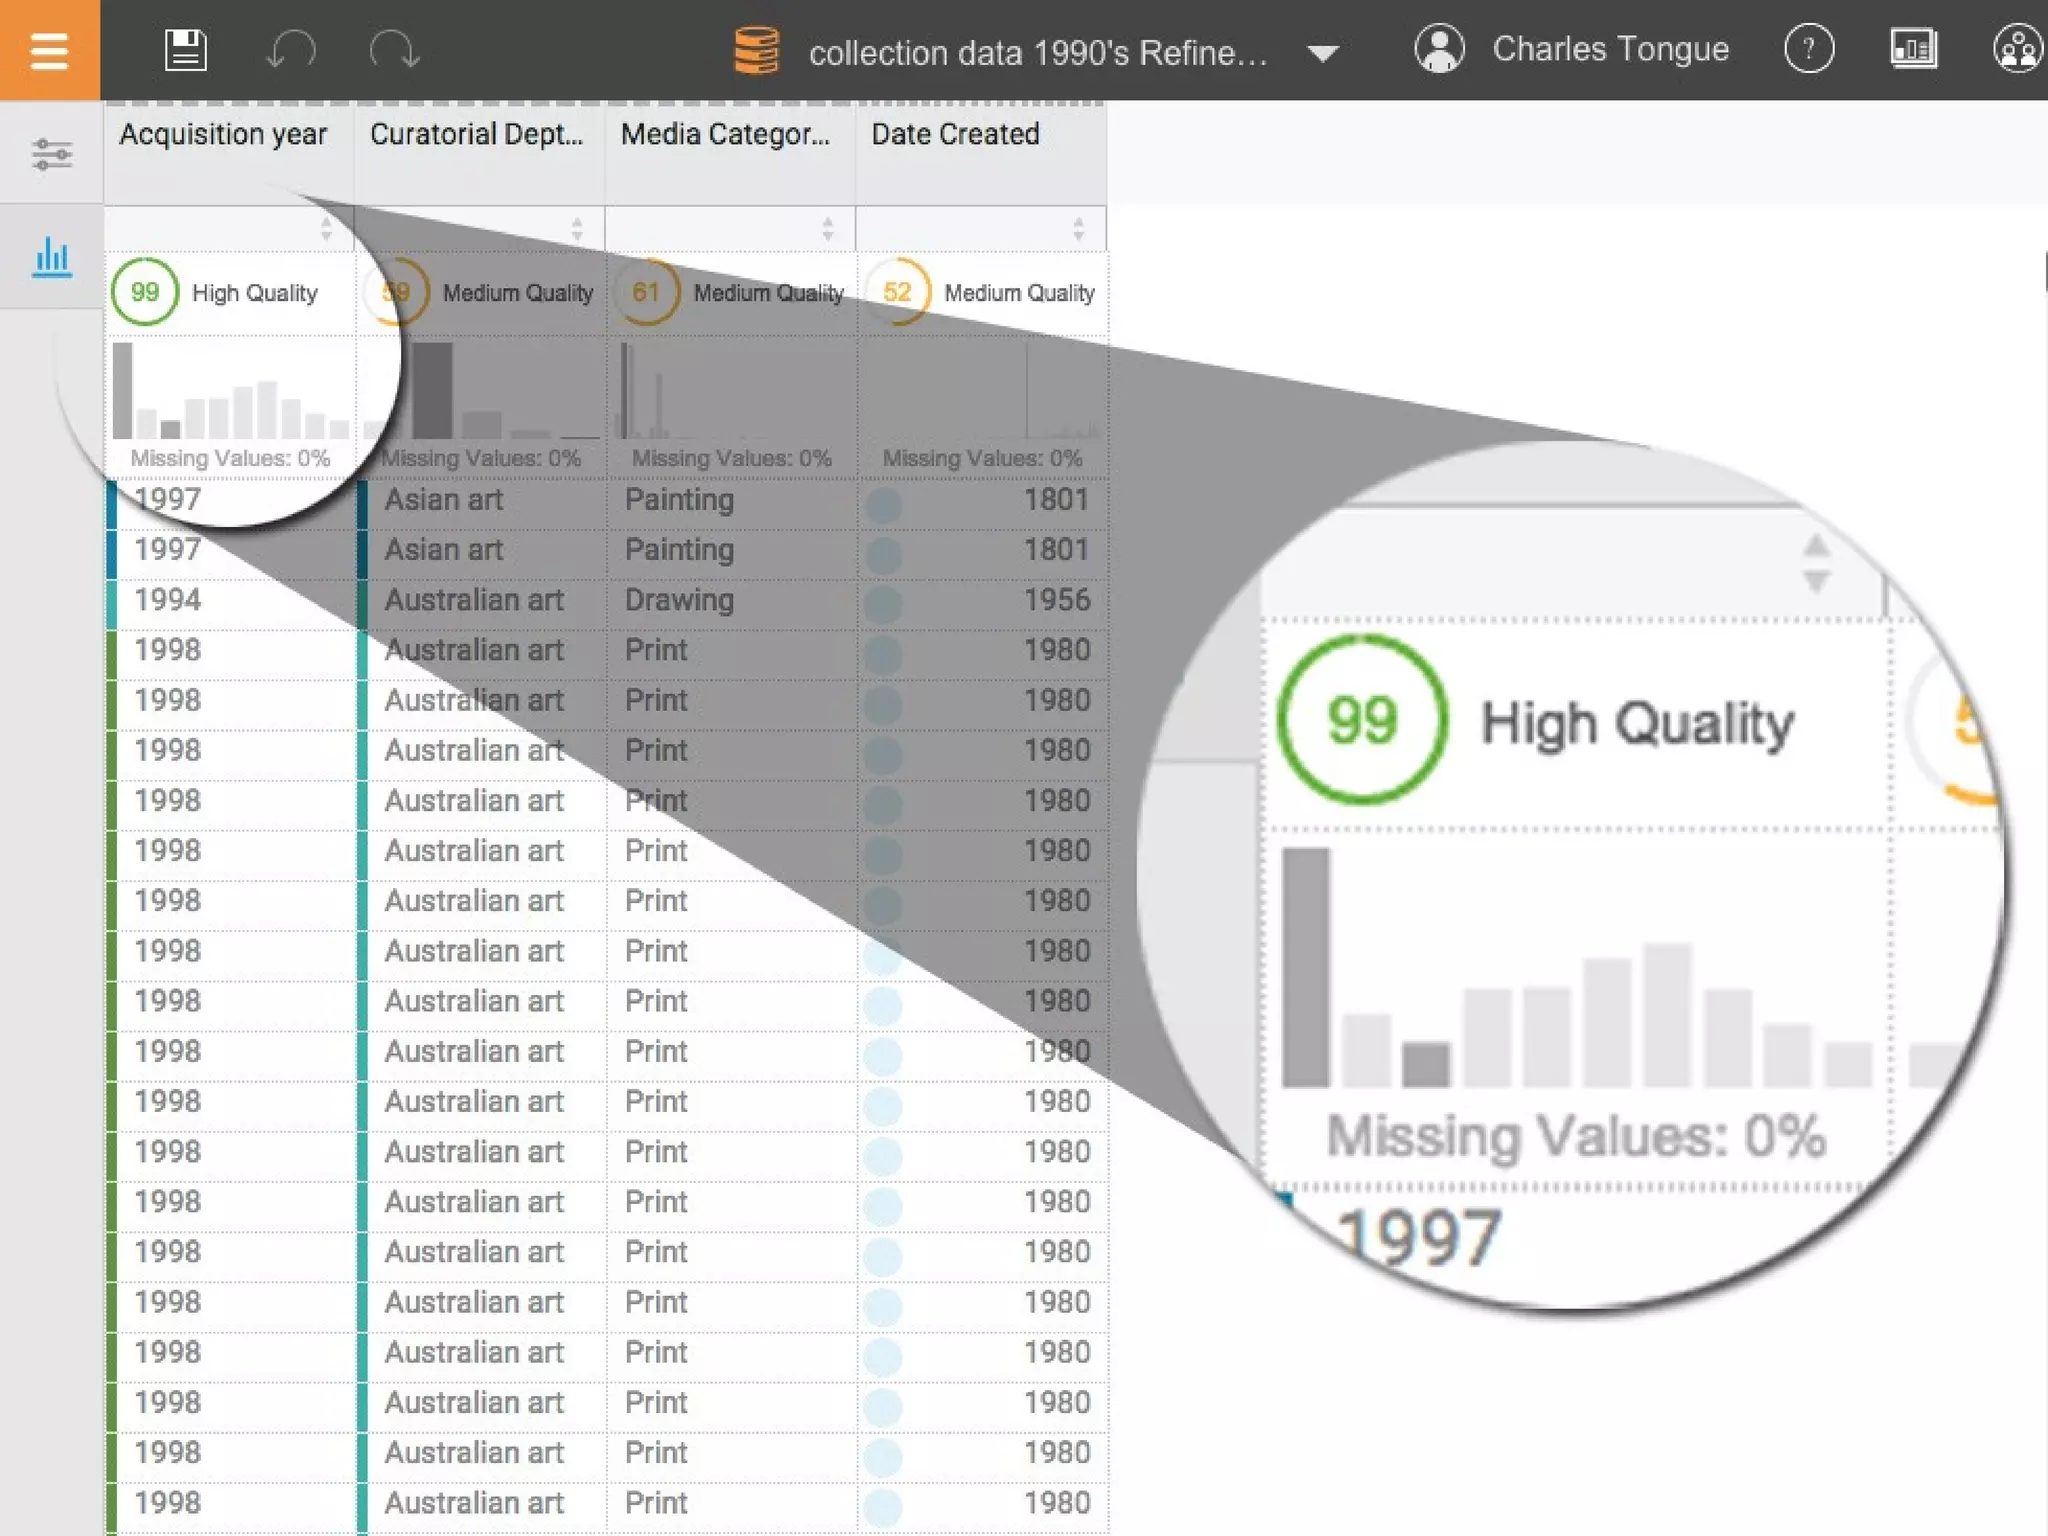
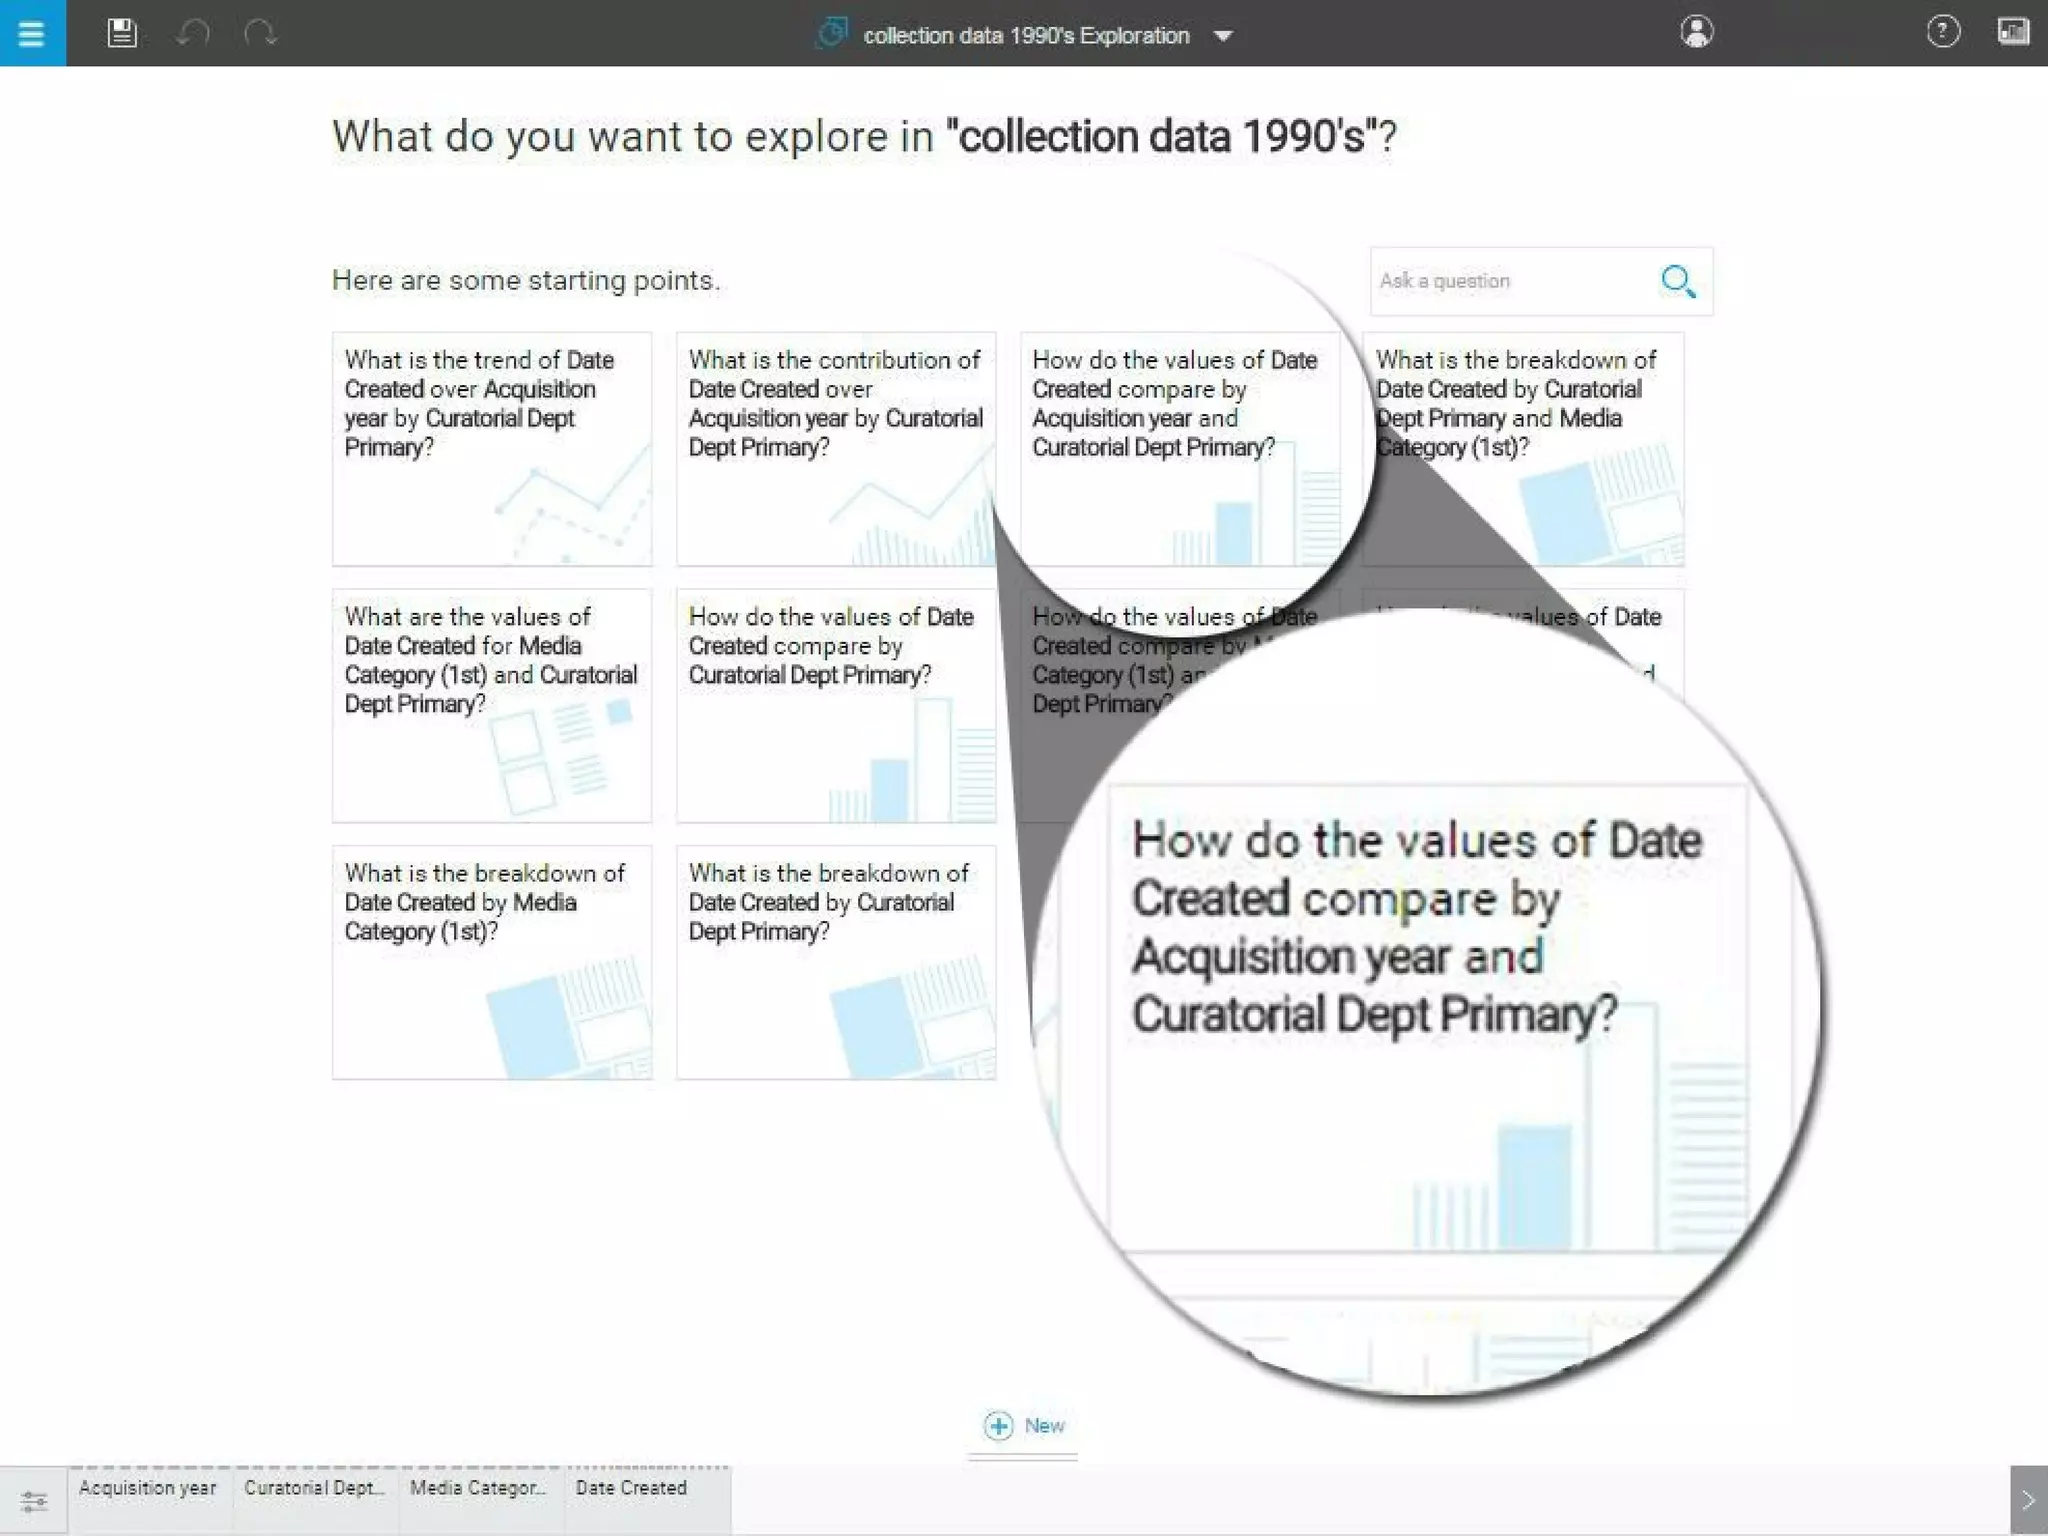
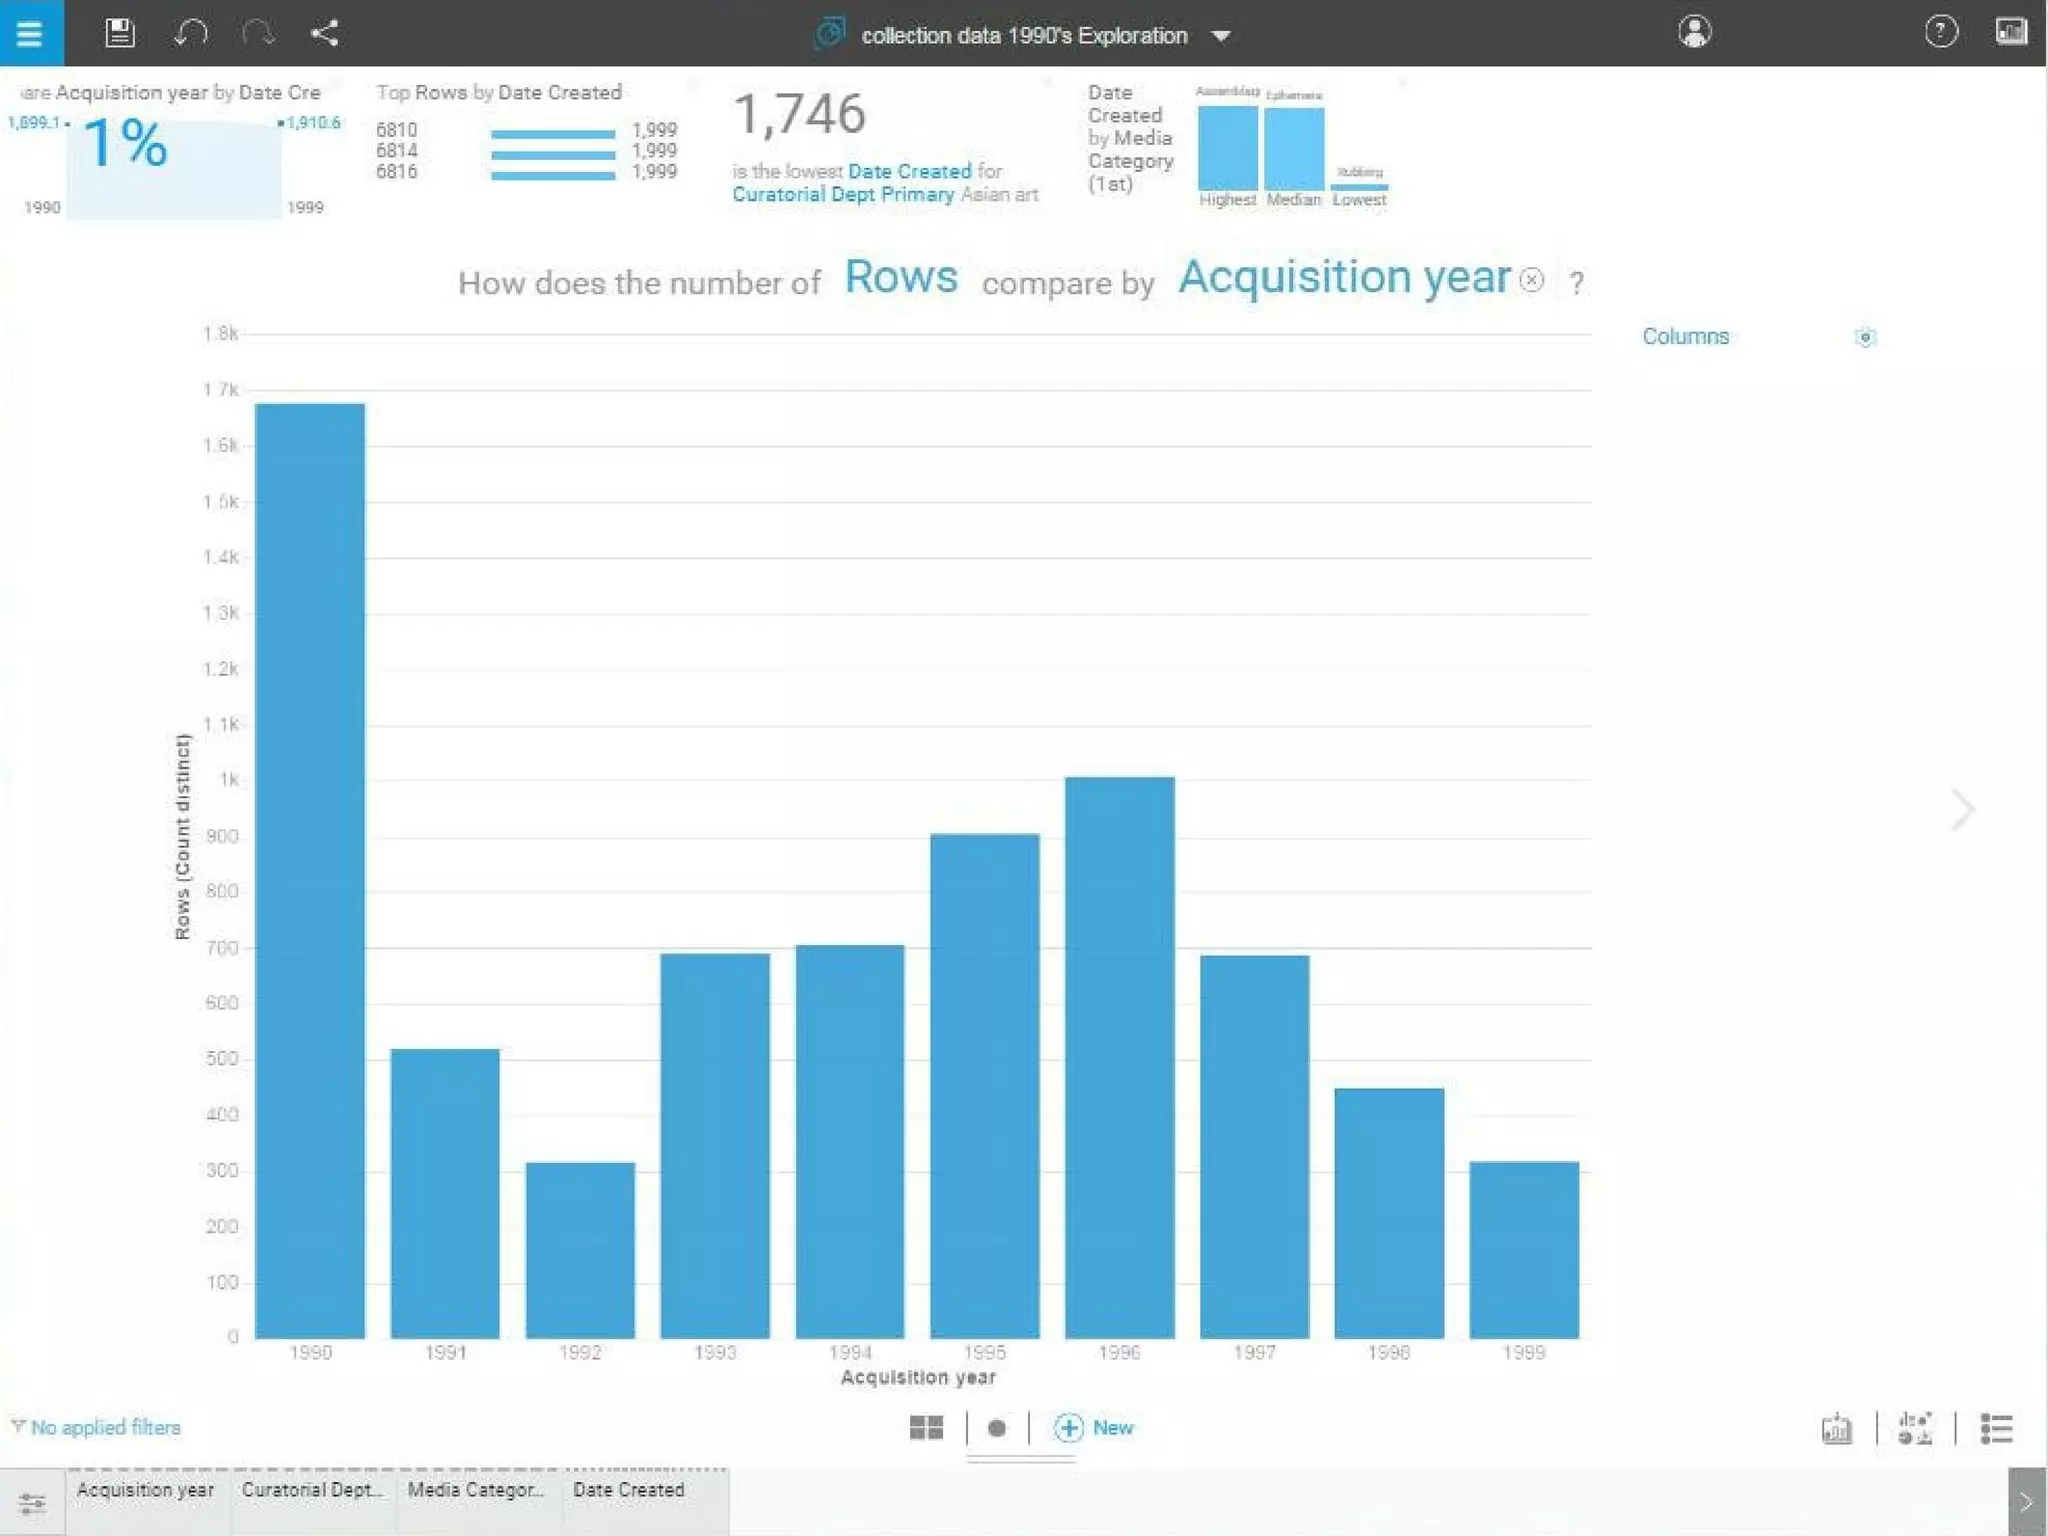
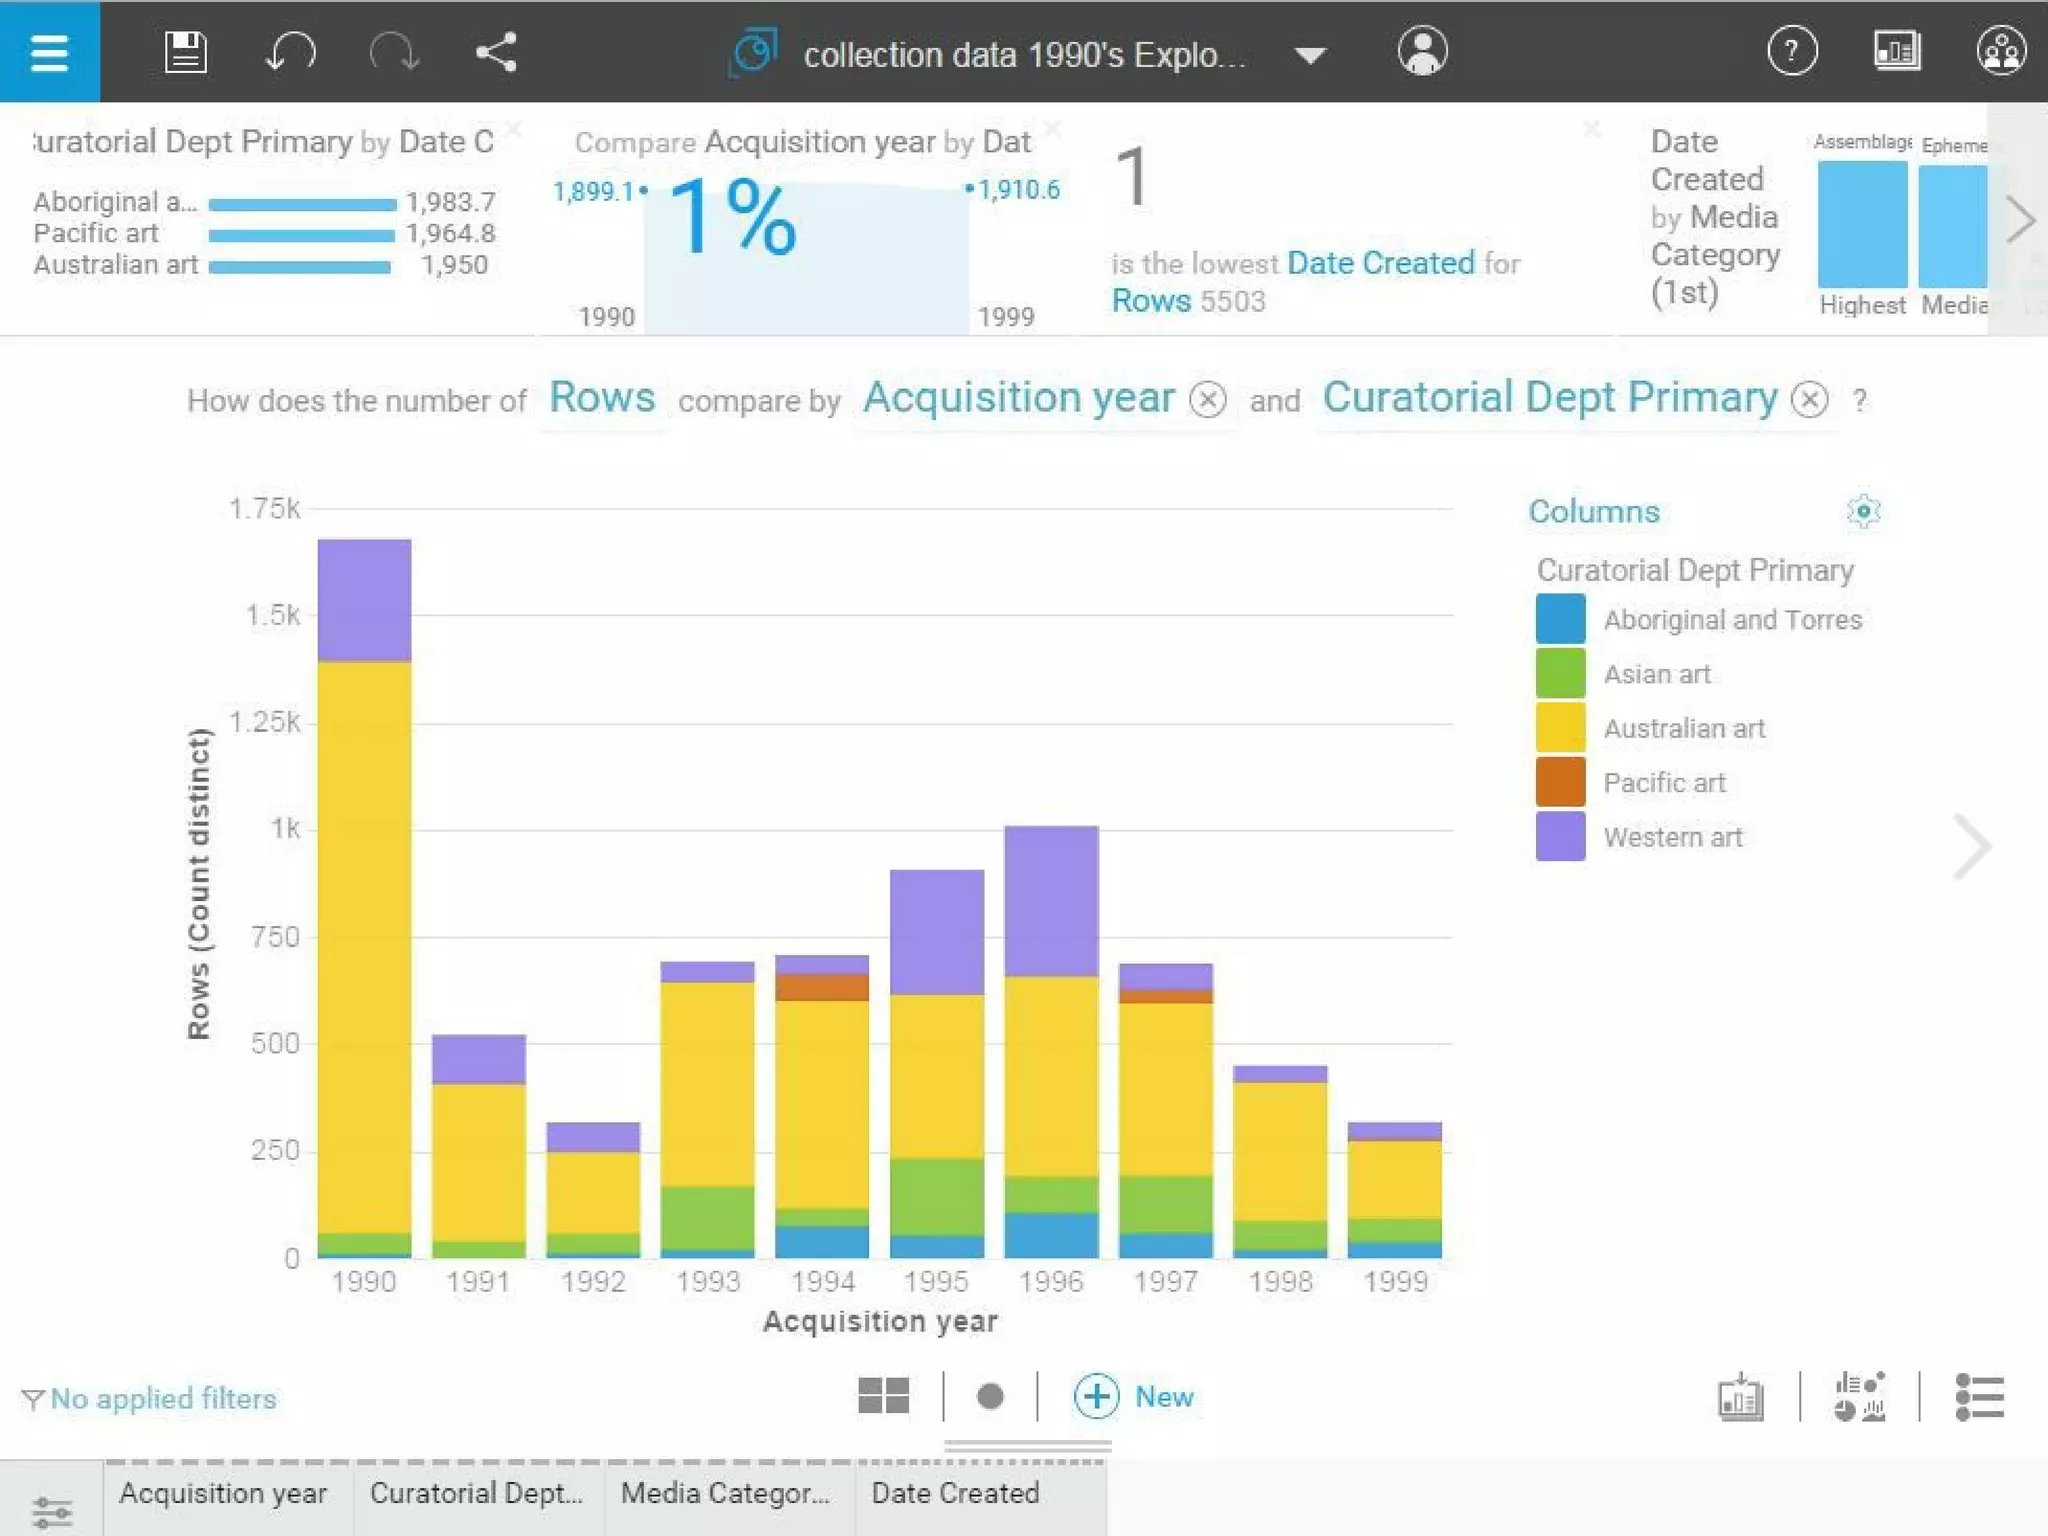
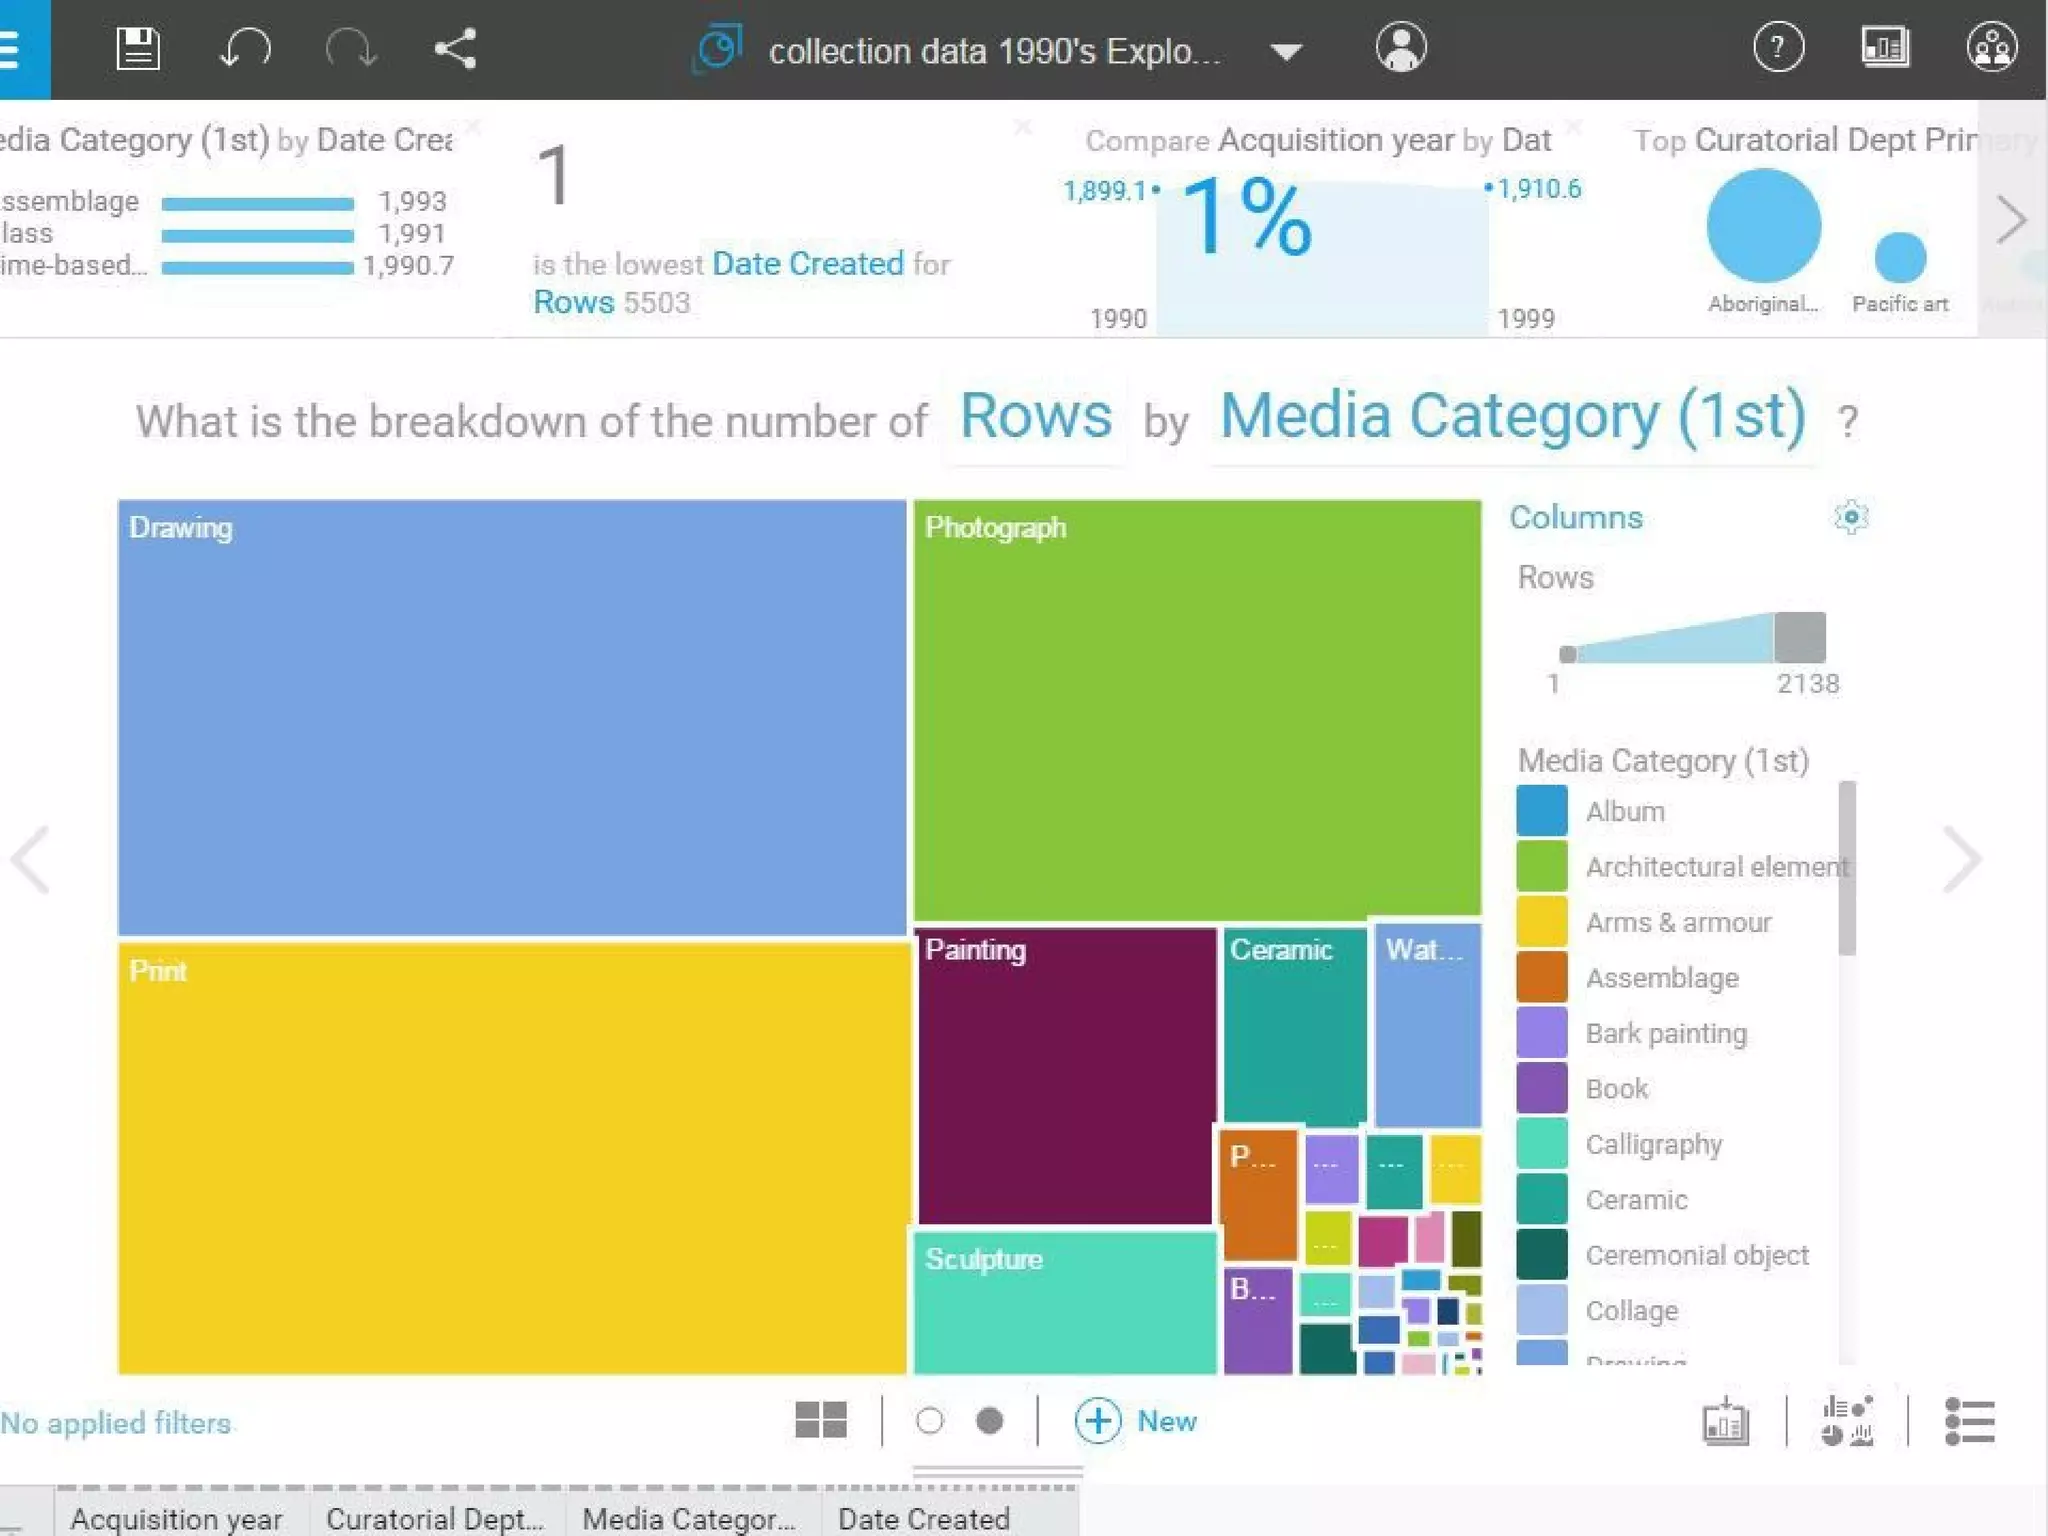
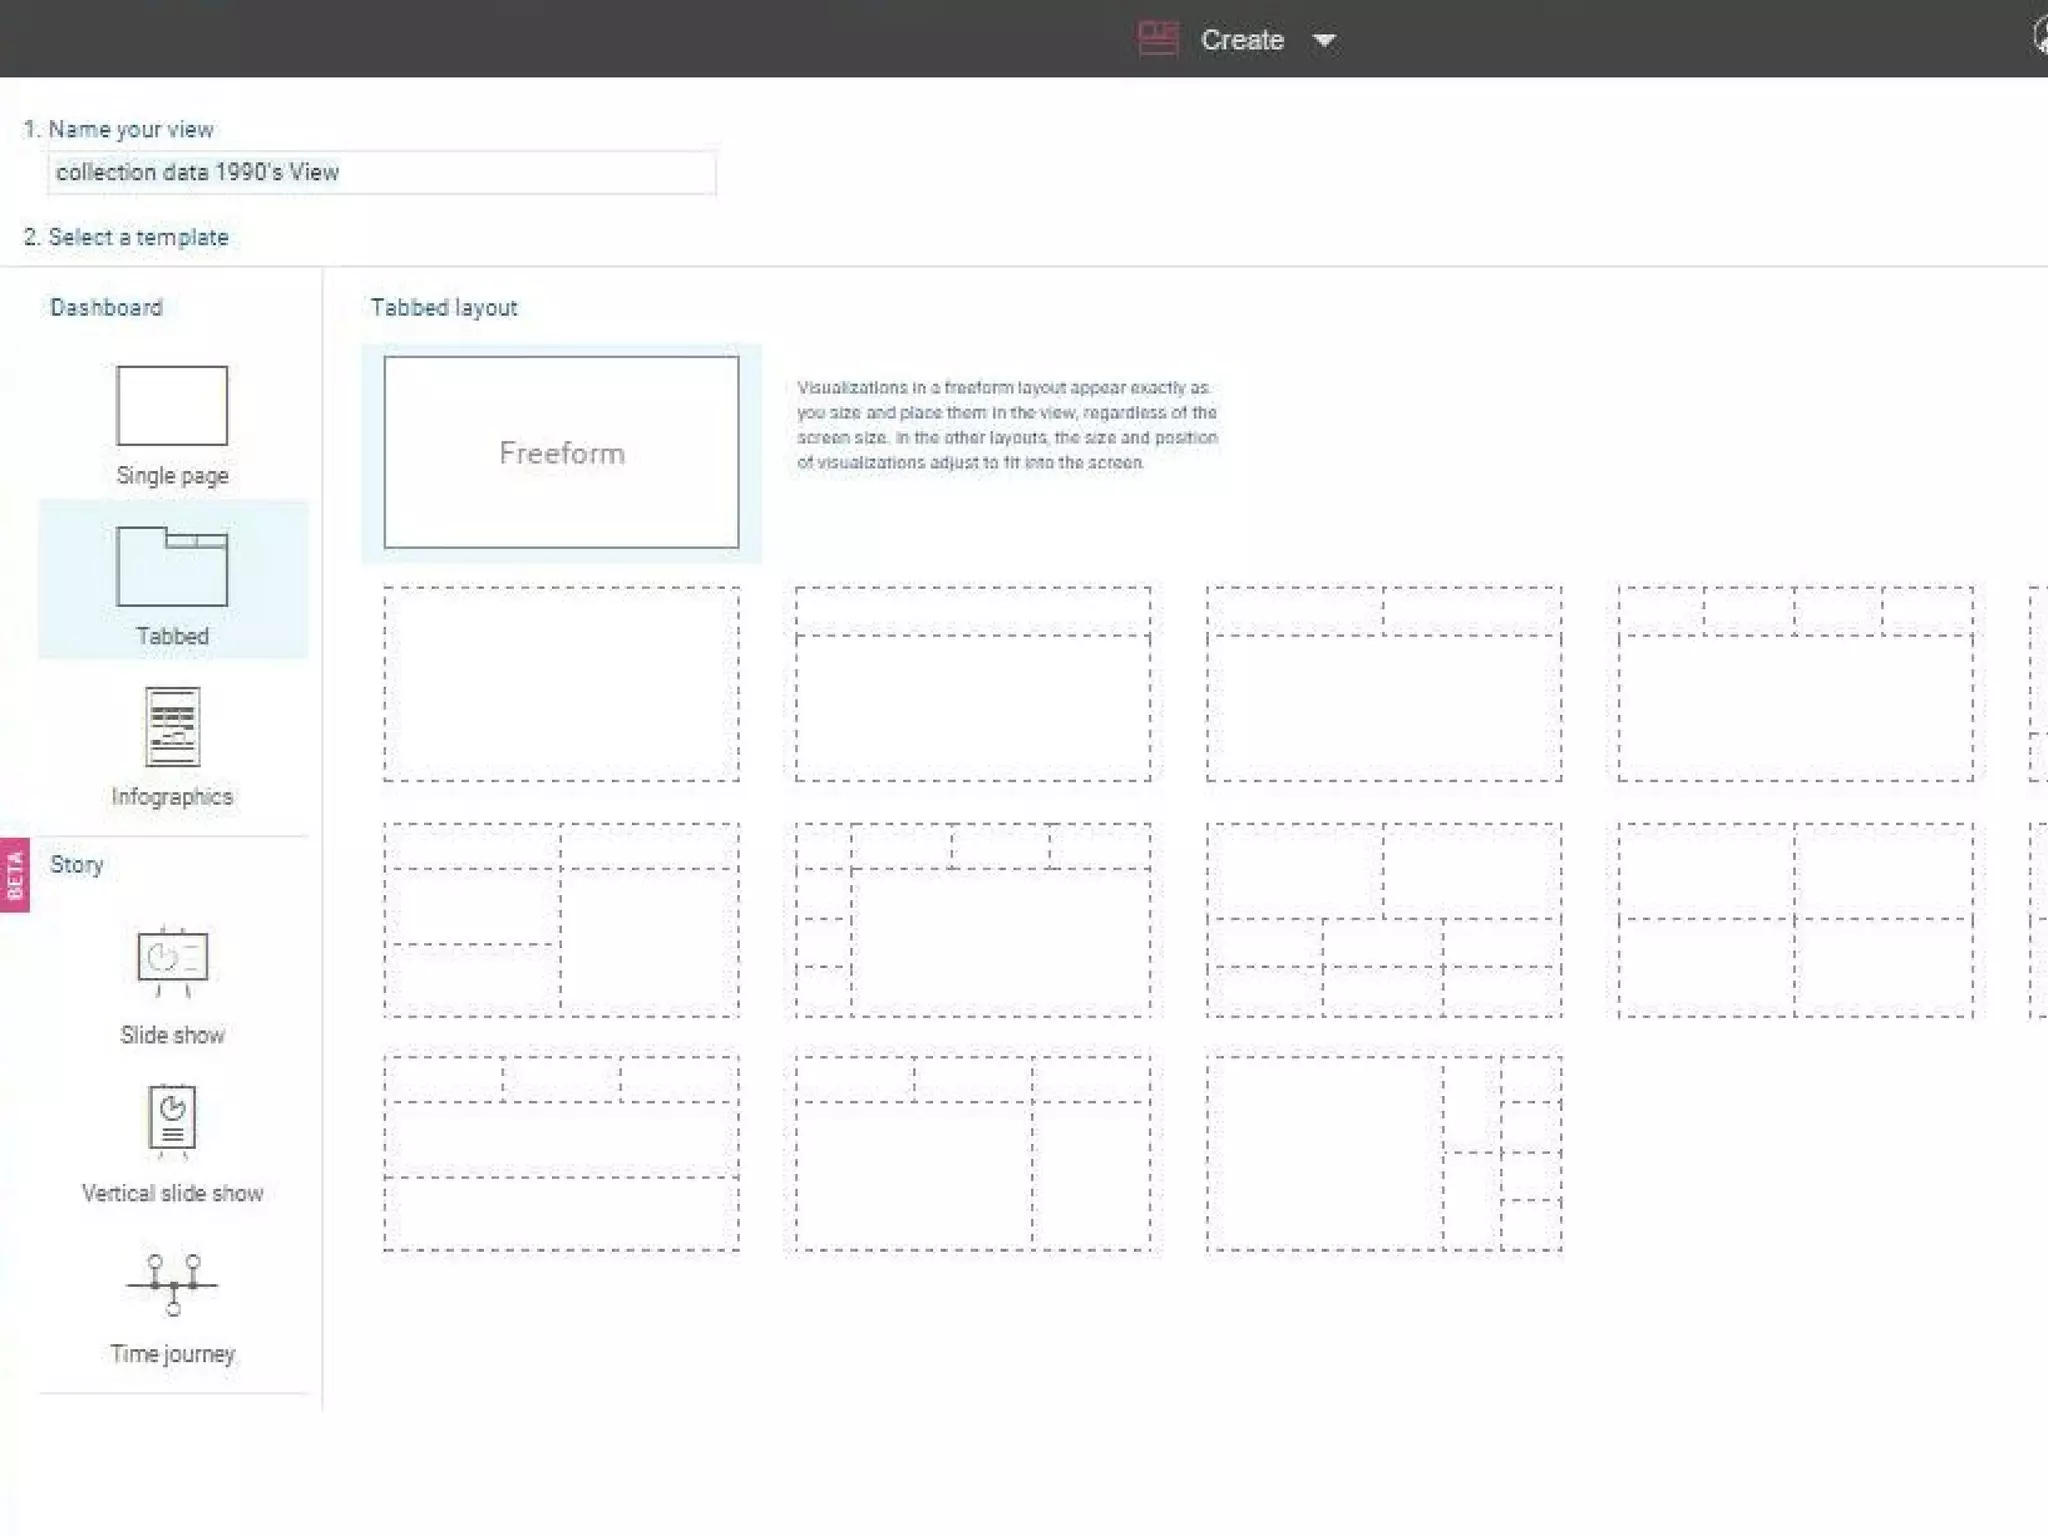
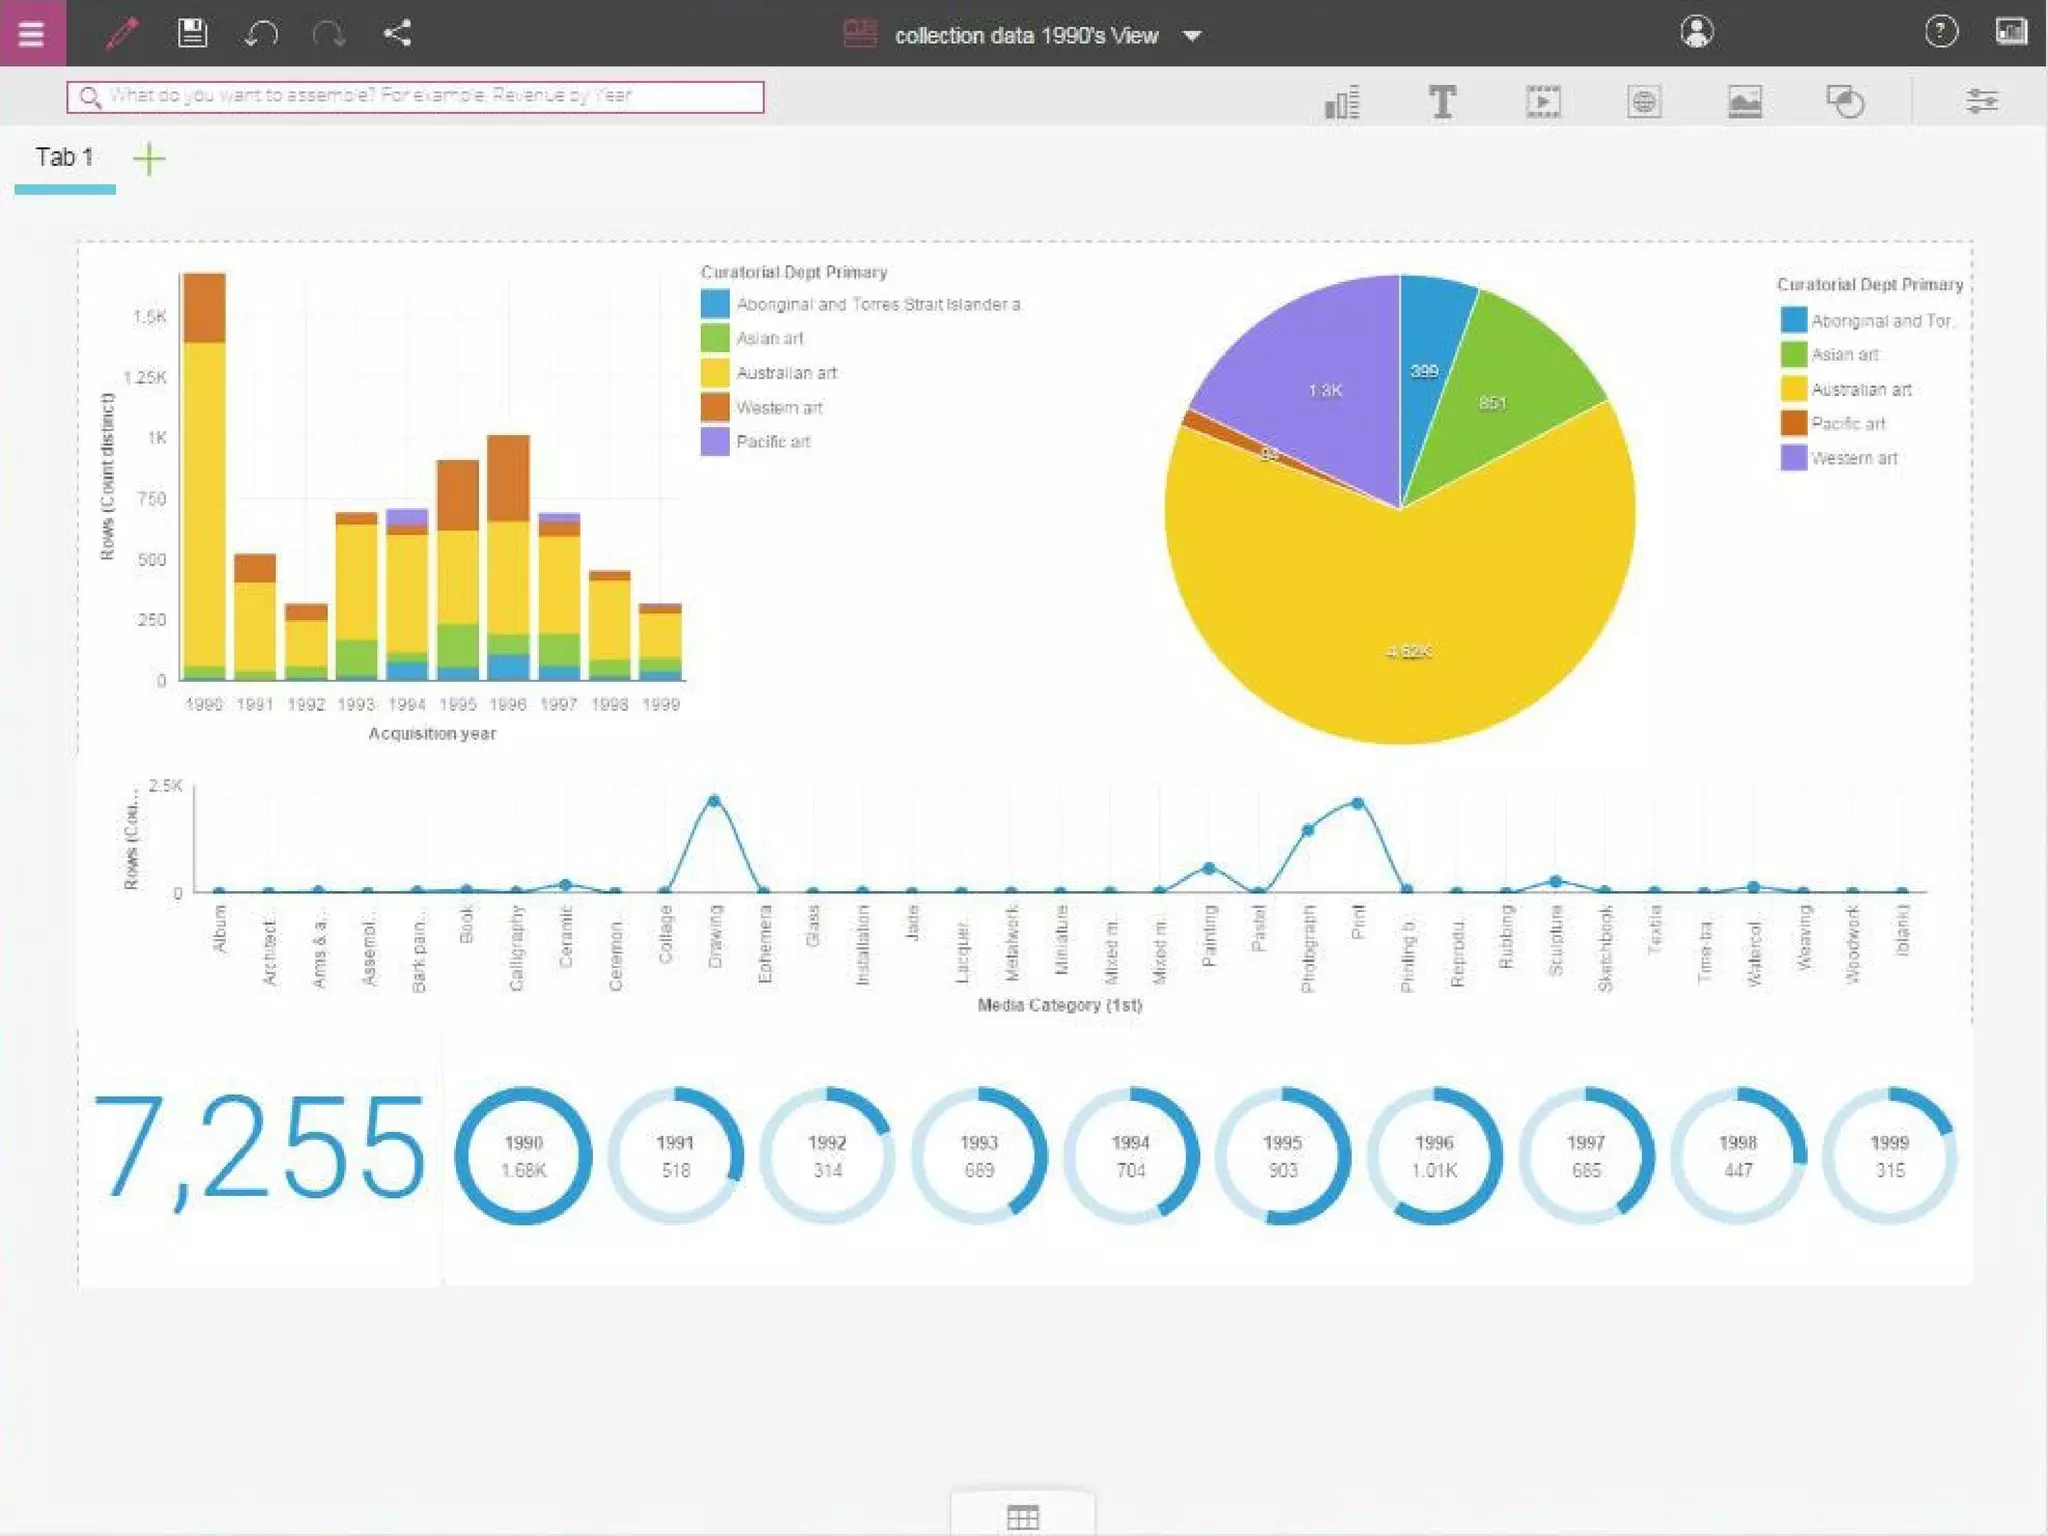
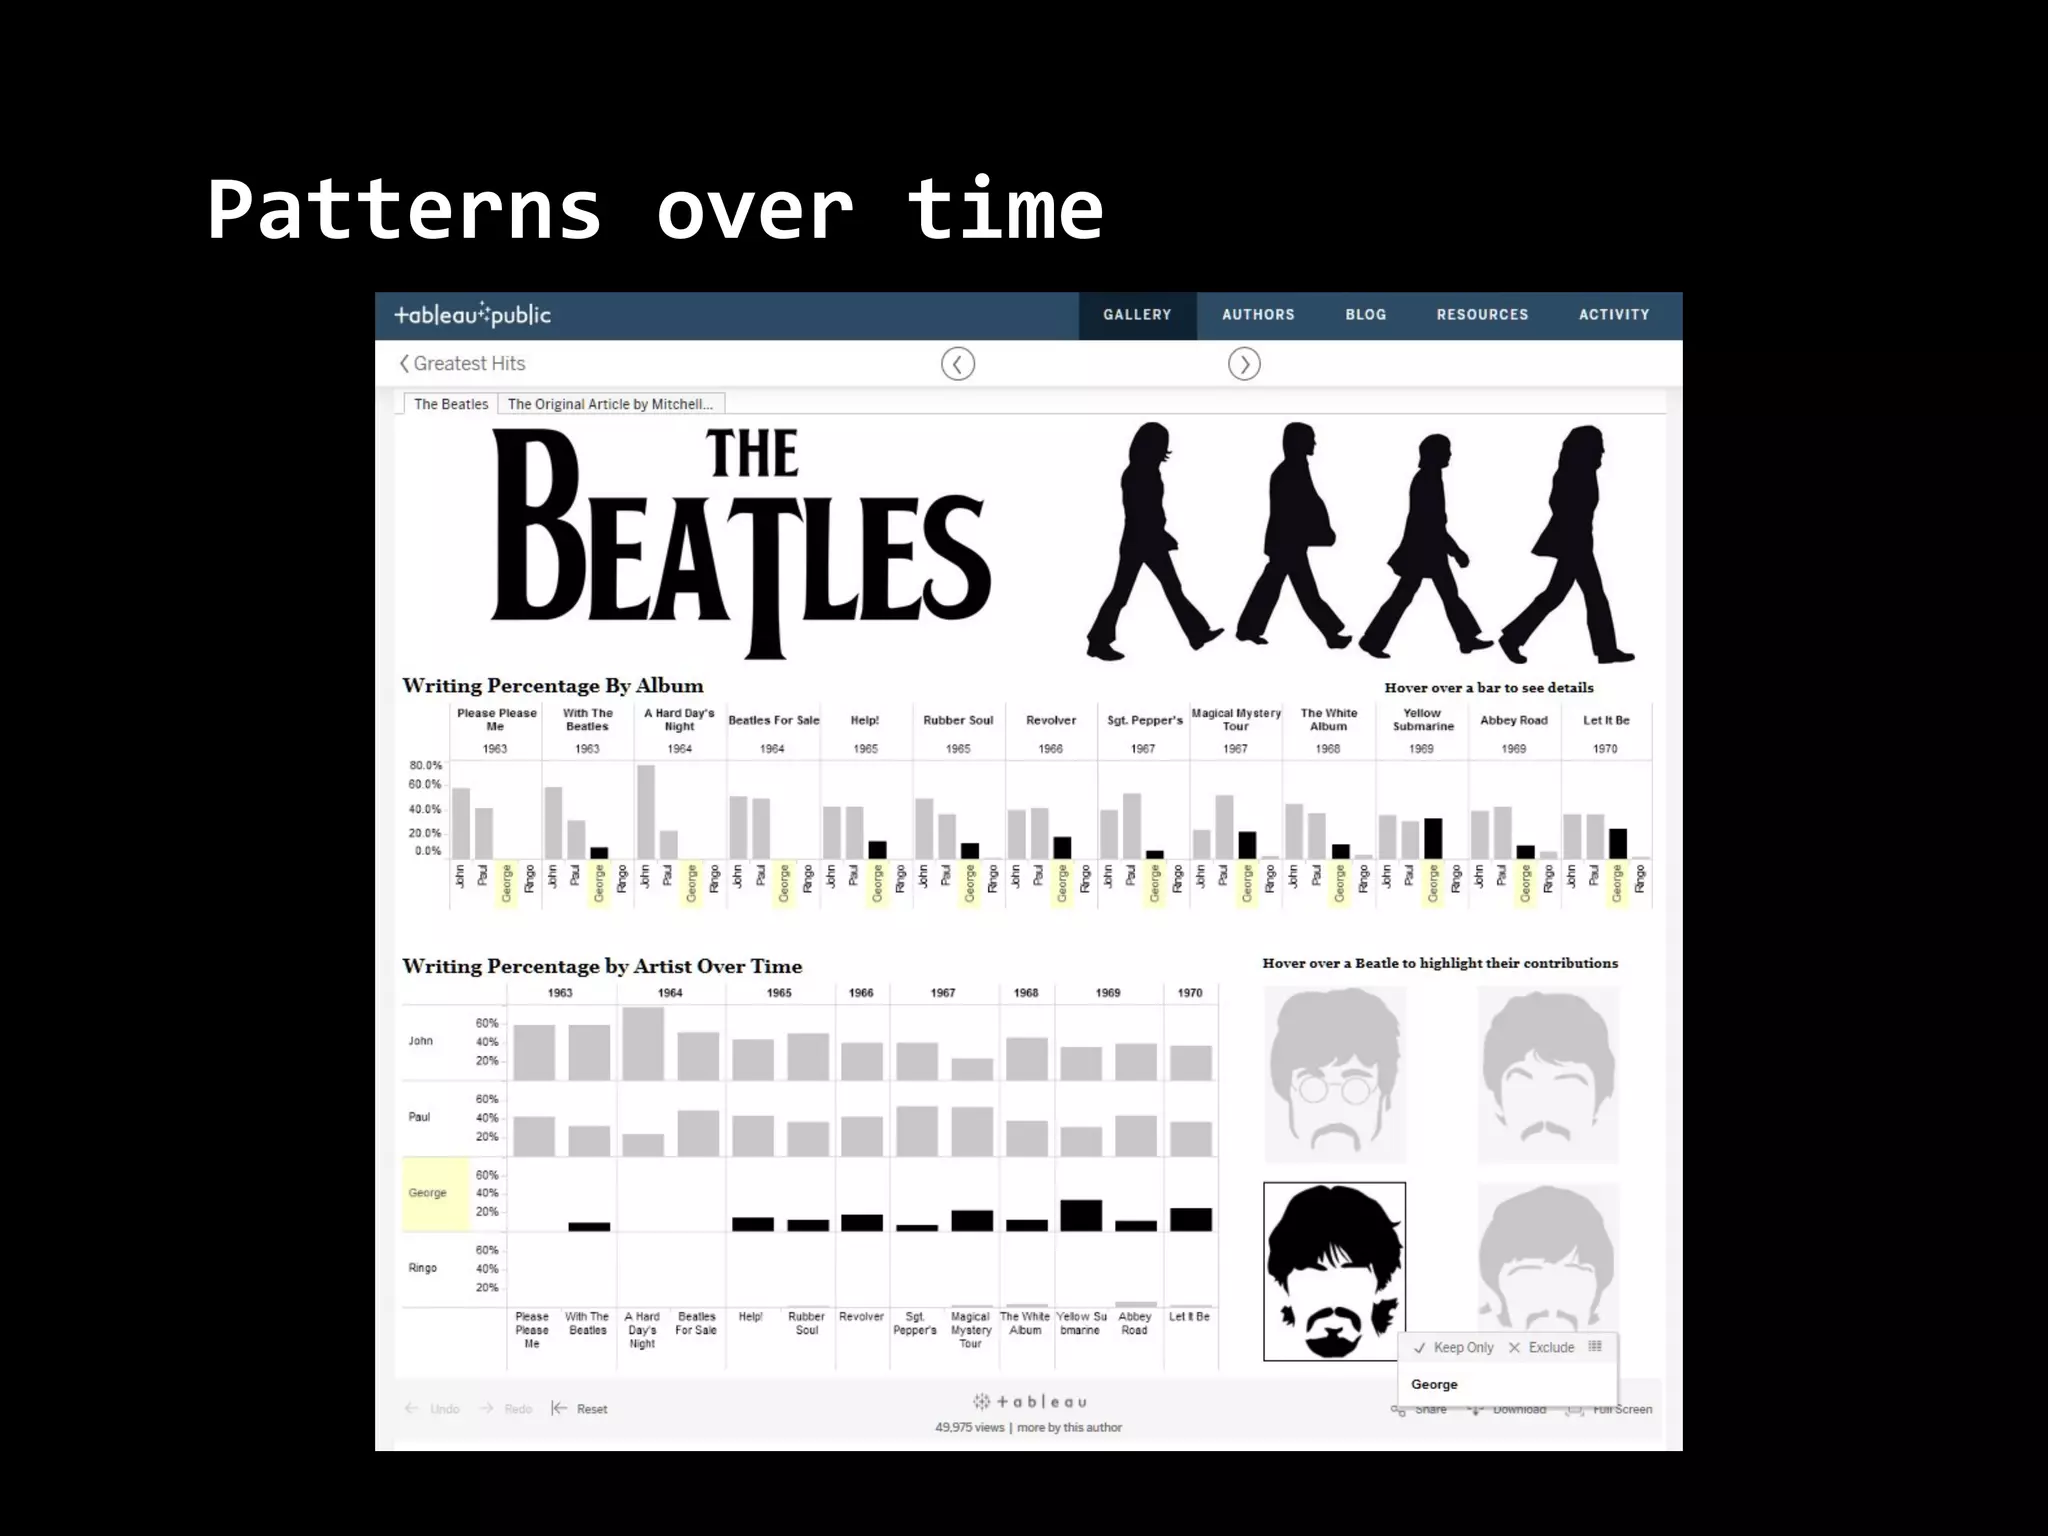
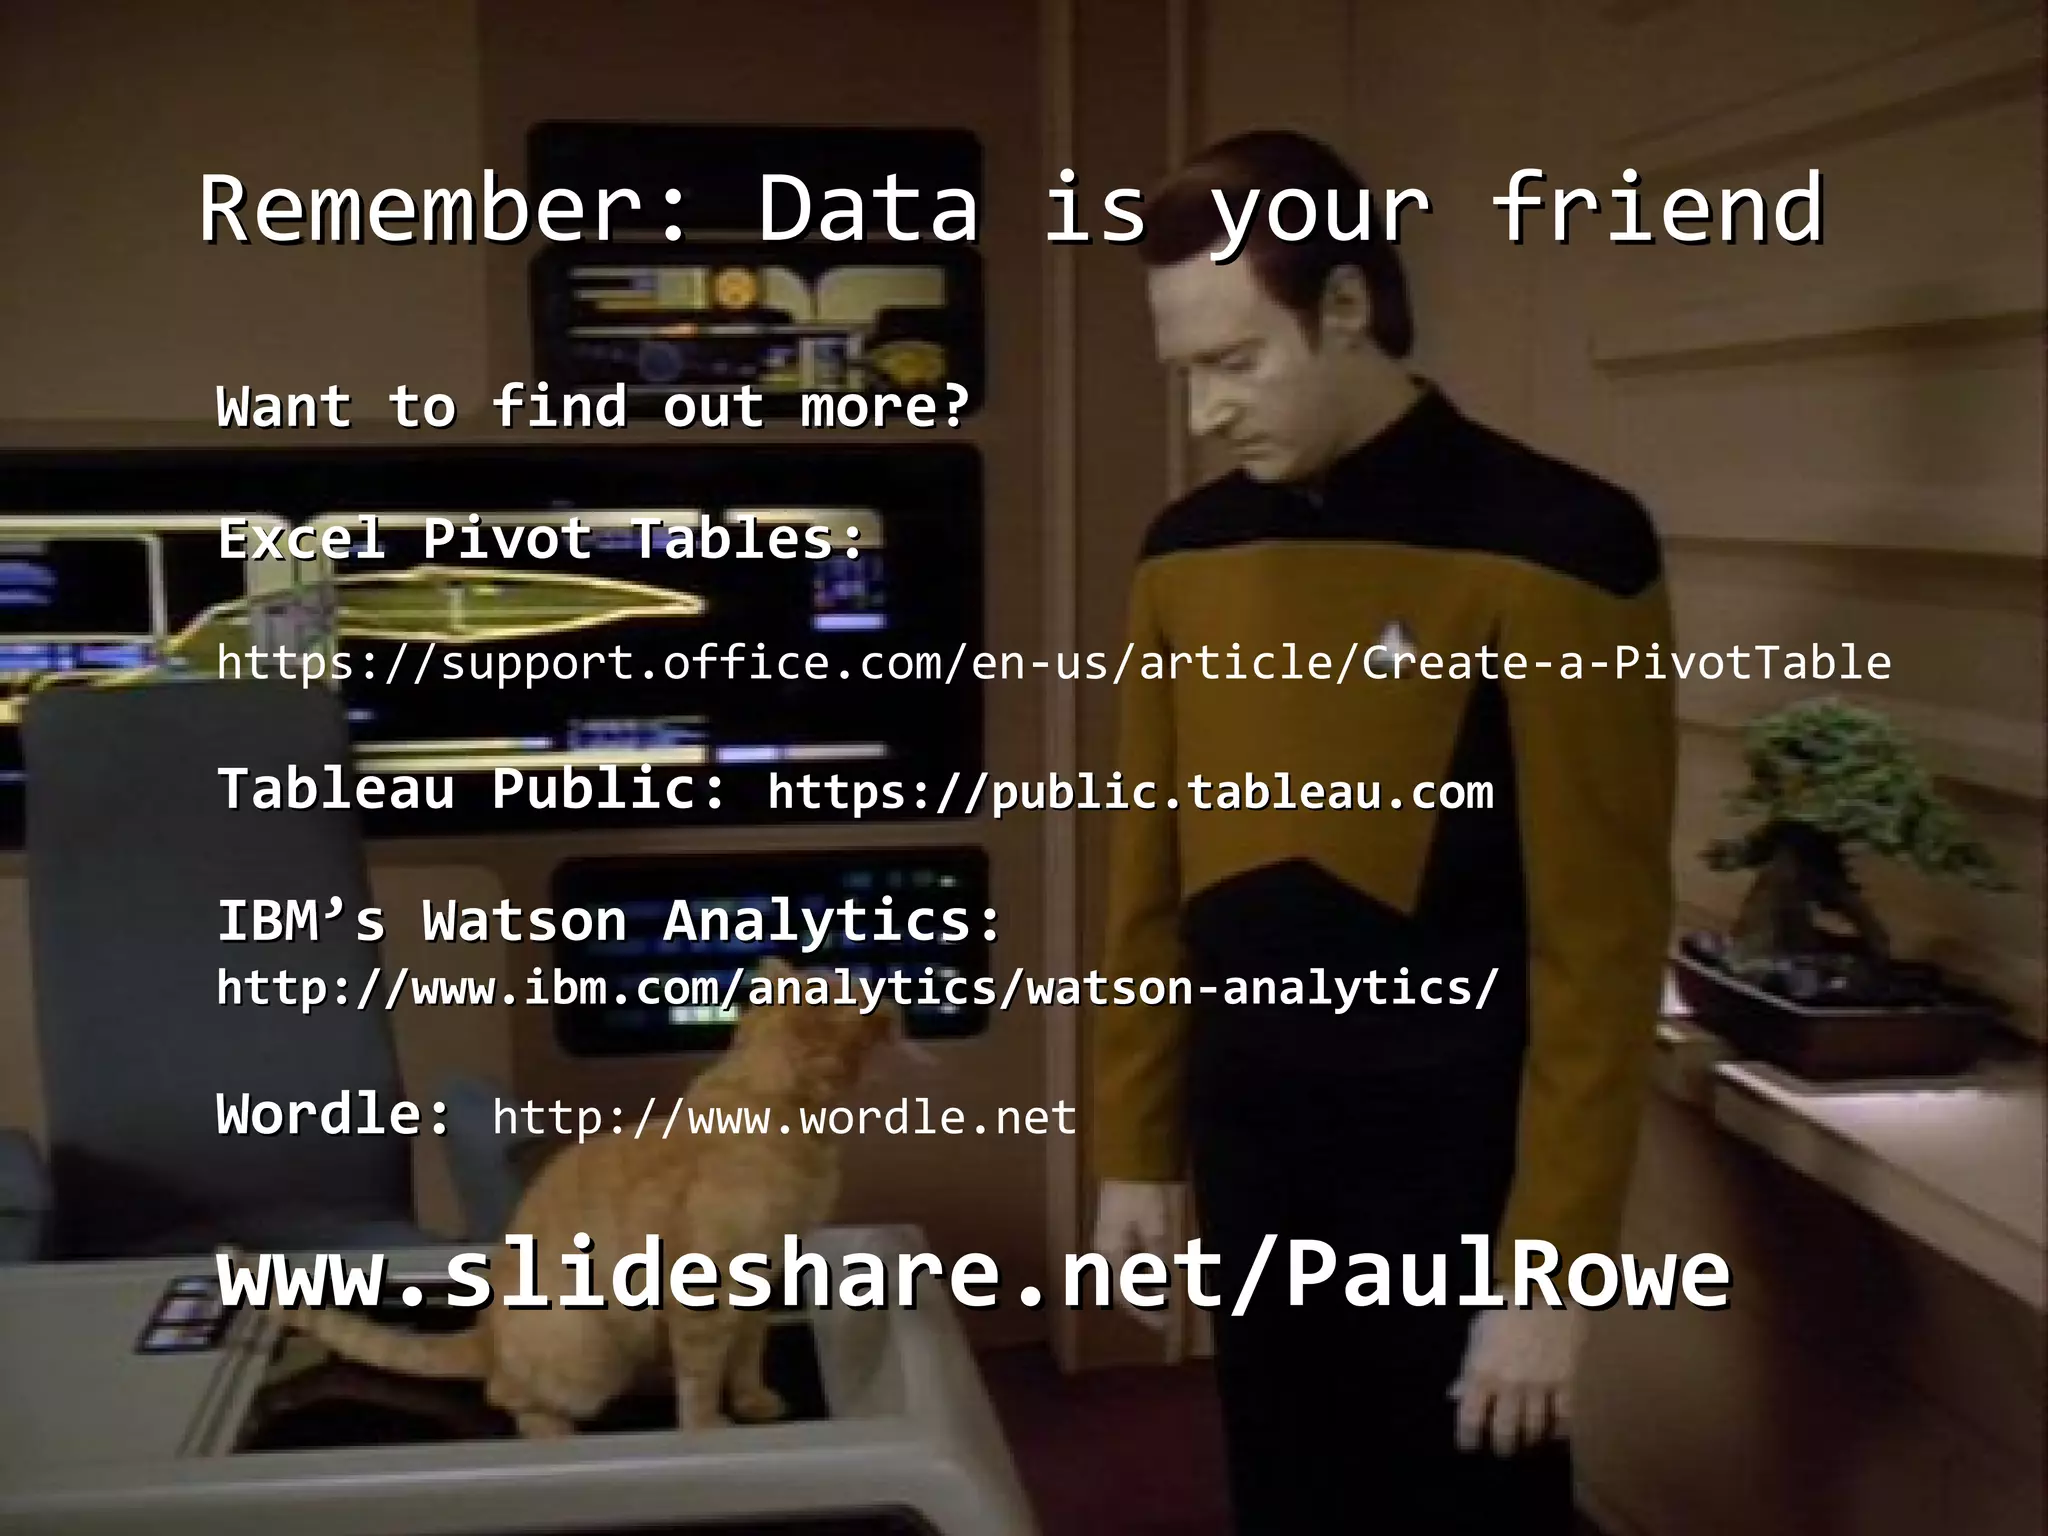

The document outlines the process of visualizing big data through three key steps: exporting data, cleaning it, and importing it into visualization tools. It mentions tools like Google's OpenRefine for data cleanup and various platforms for creating visualizations, such as Google Maps, Tableau Public, and IBM's Watson Analytics. The overall emphasis is on making data more accessible and visually engaging to identify patterns and trends.


