Investment patterns report february 2020
•
0 likes•71 views

Investment patterns report february 2020

Recommended
More Related Content
What's hot
What's hot (20)
Similar to Investment patterns report february 2020
Similar to Investment patterns report february 2020 (18)
More from ahli bank
More from ahli bank (20)
Recently uploaded
Recently uploaded (20)
Investment patterns report february 2020
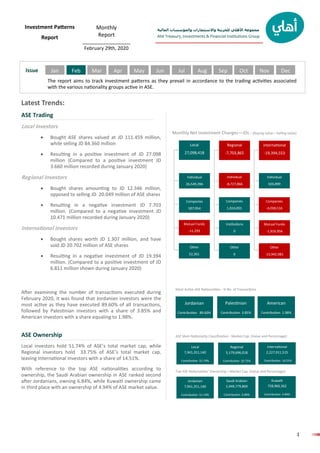
- 1. المالية والمؤسسات واالستثمارات للخزينة األهلي مجموعة Ahli Treasury, Investments & Financial Institutions Group 1 INVESTMENT استثمار Issue Investment Patterns Report Monthly Report __________________ February 29th, 2020 The report aims to track investment patterns as they prevail in accordance to the trading activities associated with the various nationality groups active in ASE. Latest Trends: ASE Trading Local investors • Bought ASE shares valued at JD 111.459 million, while selling JD 84.360 million • Resulting in a positive investment of JD 27.098 million (Compared to a positive investment JD 3.660 million recorded during January 2020) Regional Investors • Bought shares amounting to JD 12.346 million, opposed to selling JD 20.049 million of ASE shares • Resulting in a negative investment JD 7.703 million. (Compared to a negative investment JD 10.471 million recorded during January 2020) International investors • Bought shares worth JD 1.307 million, and have sold JD 20.702 million of ASE shares • Resulting in a negative investment of JD 19.394 million. (Compared to a positive investment of JD 6.811 million shown during January 2020) After examining the number of transactions executed during February 2020, it was found that Jordanian investors were the most active as they have executed 89.60% of all transactions, followed by Palestinian investors with a share of 3.85% and American investors with a share equaling to 1.98%. ASE Ownership Local investors hold 51.74% of ASE’s total market cap, while Regional investors hold 33.75% of ASE’s total market cap, leaving International investors with a share of 14.51%. With reference to the top ASE nationalities according to ownership, the Saudi Arabian ownership in ASE ranked second after Jordanians, owning 6.84%, while Kuwaiti ownership came in third place with an ownership of 4.94% of ASE market value. Jordanian Contribution 89.60% American Contribution 1.98% Palestinian Contribution 3.85% Most Active ASE Nationalities - % No. of Transactions Local 7,941,351,140 Contribution 51.74% Regional 5,179,696,018 Contribution 33.75% Kuwaiti 758,966,362 Contribution 4.94% ASE Main Nationality Classification - Market Cap. (Value and Percentage): Top ASE Nationalities’ Ownership—Market Cap. (Value and Percentage): Saudi Arabian 1,049,779,869 Contribution 6.84% Jordanian 7,941,351,140 Contribution 51.74% International 2,227,911,515 Contribution 14.51% Jan Local 27,098,418 International -19,394,553 Regional -7,703,865 Individual 26,549,396 Individual 503,899 Individual -8,727,866 Companies -4,038,516 Companies 1,024,001 Companies 507,954 Mutual Funds -11,293 Mutual Funds -1,916,956 Institutions 0 Other -13,942,981 Other 0 Other 52,361 Monthly Net Investment Changes—JDs : (Buying value—Selling value) Feb Mar Apr May Jun Jul Aug Sep Oct Nov Dec
- 2. المالية والمؤسسات واالستثمارات للخزينة األهلي مجموعة Ahli Treasury, Investments & Financial Institutions Group 2 INVESTMENT استثمار ASE Nationality Classification - By Sector Net Investment - JD Million BySector Nationality Sell Buy Net Investment JD (Market Value)Securities Market Value Securities Market Value Banking Sector Local 7,400,518 11,413,332 23,712,321 37,879,234 26,465,903 Regional 3,939,892 16,404,623 2,055,267 7,690,834 (8,713,789) International 14,708,619 18,794,847 281,441 1,042,733 (17,752,114) Total Banking 26,049,029 46,612,801 26,049,029 46,612,801 Insurance Sector Local 1,096,744 608,467 1,105,708 616,051 7,583 Regional 9,158 7,162 4,694 3,178 (3,983) International 4,500 3,600 - - (3,600) Total Insurance 1,110,402 619,229 1,110,402 619,229 Services Sector Local 64,919,682 50,968,696 65,506,476 51,514,632 545,935 Regional 4,918,354 2,512,094 6,676,244 3,130,146 618,052 International 2,571,160 1,239,325 226,476 75,337 (1,163,987) Total Services 72,409,196 54,720,115 72,409,196 54,720,115 Industry Sector Local 24,059,362 21,370,466 23,724,286 21,449,462 78,997 Regional 1,082,780 1,126,014 1,552,658 1,521,870 395,855 International 180,633 664,725 45,831 189,873 (474,852) Total Industry 25,322,775 23,161,205 25,322,775 23,161,205 All Sectors Local 97,476,306 84,360,961 114,048,791 111,459,379 27,098,418 Regional 9,950,184 20,049,893 10,288,863 12,346,028 (7,703,865) International 17,464,912 20,702,496 553,748 1,307,943 (19,394,553) Grand Total 124,891,402 125,113,350 124,891,402 125,113,350
- 3. المالية والمؤسسات واالستثمارات للخزينة األهلي مجموعة Ahli Treasury, Investments & Financial Institutions Group 3 INVESTMENT استثمار ASE Nationality Classification - By Investor Category Net Investment - JD Million ByInvestorCategory Nationality Investor Category Sell Buy Net Investment JD (Market Value)Securities Market Value Securities Market Value Local Individuals 84,202,439 69,162,155 101,490,720 95,711,550 26,549,396 Companies 12,699,433 14,892,906 12,429,085 15,400,860 507,954 Mutual Funds 526,819 274,078 121,073 262,786 (11,293) Institutions 38,210 18,921 3,570 71,445 52,524 Organizations 9,405 12,901 4,343 12,738 (163) Total 97,476,306 84,360,961 114,048,791 111,459,379 27,098,418 Regional Individuals 7,725,483 15,204,121 6,634,416 6,476,255 (8,727,866) Companies 2,224,701 4,845,772 3,654,447 5,869,773 1,024,001 Total 9,950,184 20,049,893 10,288,863 12,346,028 (7,703,865) International Individuals 132,075 282,635 201,059 786,534 503,899 Companies 1,513,686 4,235,073 262,495 196,557 (4,038,516) Mutual Funds 769,751 2,241,808 90,194 324,852 (1,916,956) Institutions 15,048,914 13,940,235 - - (13,940,235) Associations 486 2,746 - - (2,746) Total 17,464,912 20,702,496 553,748 1,307,943 (19,394,553) All Nationalities Individuals 92,059,997 84,648,910 108,326,195 102,974,339 18,325,429 Companies 16,437,820 23,973,751 16,346,027 21,467,190 (2,506,561) Mutual Funds 1,296,570 2,515,887 211,267 587,638 (1,928,249) Institutions 15,087,124 13,959,156 3,570 71,445 (13,887,711) Organizations 9,405 12,901 4,343 12,738 (163) Associations 486 2,746 - - (2,746) Grand Total 124,891,402 125,113,350 124,891,402 125,113,350 -
- 4. المالية والمؤسسات واالستثمارات للخزينة األهلي مجموعة Ahli Treasury, Investments & Financial Institutions Group 4 INVESTMENT استثمار ASE Ownership Classification OwnershipSectorTop10Nationalities Serial Nationality Shareholders Securities Total Value No. % No. % Amount in JOD % 1 Jordanian 589,189 93.52 4,876,065,330 65.5085 7,941,351,141 51.74 2 Saudi Arabian 2,487 0.39 404,153,816 5.4297 1,049,779,870 6.84 3 Kuwaiti 2,893 0.46 222,602,607 2.9906 758,966,362 4.94 4 Bahraini 126 0.02 350,527,292 4.7092 667,002,348 4.35 5 Qatari 385 0.06 184,867,422 2.4836 660,116,995 4.30 6 Caymanian 32 0.01 281,273,191 3.7788 659,594,484 4.30 7 Chinese 6 0.00 23,294,922 0.313 460,068,748 3.00 8 Libyan 97 0.02 139,668,741 1.8764 430,155,893 2.80 9 Palestinian 23,087 3.66 133,468,630 1.7931 359,717,438 2.34 10 Joint Arab 2 0.00 17,116,751 0.23 330,160,246 2.15 11 Other 10,446 1.66 545,440,495 7.33 1,478,197,733 9.63 Total 630,014 100 7,443,410,364 100 15,348,958,675 100 Sector No. of Regis- ters Nationality Shareholders No. % Securities No. % Total Value Amount in JD % Banking 16 Local 71,827 86.98 1,435,170,490 48.06 3,335,147,812 41.32 Regional 9,370 11.35 1,263,441,603 42.31 3,900,973,866 48.33 International 1,385 1.68 287,842,907 9.64 834,984,022 10.35 Total 82,582 100 2,986,455,000 100 8,071,105,700 100 Insurance 23 Local 13,703 95.15 179,452,876 67.1 226,868,546 69.16 Regional 609 4.23 68,410,857 25.6 64,892,766 19.78 International 90 0.63 19,459,119 7.3 36,260,411 11.05 Total 14,402 100 267,322,852 100 328,021,724 100 Services 144 Local 355,795 95.77 2,587,239,189 81.93 2,974,726,264 73.68 Regional 14,471 3.90 367,024,956 11.62 373,282,099 9.25 International 1,240 0.33 203,662,219 6.45 689,473,345 17.08 Total 371,506 100 3,157,926,364 100 4,037,481,707 100 Industry 56 Local 147,864 91.54 674,202,775 65.35 1,404,608,519 48.23 Regional 12,106 7.50 205,037,258 19.87 840,547,288 28.86 International 1,554 0.96 152,466,115 14.78 667,193,738 22.91 Total 161,524 100 1,031,706,148 100 2,912,349,544 100 All Sectors Local 589,189 93.5 4,876,065,330 65.51 7,941,351,141 51.74 239 Regional 36,556 5.8 1,903,914,674 25.58 5,179,696,019 33.75 International 4,269 0.7 663,430,360 8.91 2,227,911,515 14.52 Grand Total 630,014 100 7,443,410,364 100 15,348,958,675 100
- 5. المالية والمؤسسات واالستثمارات للخزينة األهلي مجموعة Ahli Treasury, Investments & Financial Institutions Group 5 INVESTMENT استثمار Disclaimer: The trading and financial related data contained in this report has been obtained from sources considered by Jordan Ahli Bank to be reliable in all material respects. However, the accuracy, fairness and completeness thereof are not guaranteed by Jordan Ahli Bank and its employees and its third-party suppliers shall have no liability for errors or omissions with respect to the service or its delivery, re- gardless of the cause or source of such error or omission. This is not an invitation to buy or sell stocks traded in Amman Stock Exchange. The Purpose of this report is to provide information and analysis related to Amman Stock Exchange and assists investors to obtain infor- mation to support their decisions. The reader should not make any investment decision solely based on the information contained in this report and he/she should consult with his/her investment advisor before investing. This report is a copyright of Jordan Ahli Bank and should not be reproduced or redistributed partially or fully in away shape or manner without the express written consent of the Jordan Ahli Bank. Information Sources • Amman Stock Exchange: www.exchange.jo • Securities Depository Center: www.sdc.com.jo Contact Us: Lina N. Bakhit Chief Business Officer—CBO E-mail: Lina.bakhit@ahlibank.com.jo Tel.: 520 6000 / Ext: 1800 Majed Hejab Senior Vice President—SVP Head of Treasury, Investments and Financial Institutions E-mail: Majed.Hejab@ahlibank.com.jo Tel.: 520 6000 / Ext: 1810 Research & Studies Department Rabe Al-Bataineh Head of Research and Studies E-mail: Research.dept@ahlibank.com.jo Tel.: 520 6000 / Ext: 1814