Auto monthly Nov-2011-R K Global
•
0 likes•302 views

Automakers in India reported strong double-digit sales growth in November 2011, with volumes increasing despite expectations of slowing demand from higher interest rates and prices. Two-wheeler sales grew 28% year-over-year to over 1.3 million units, led by Hero MotoCorp, Bajaj Auto and TVS Motors. Major automakers like Tata Motors, Hero and Ashok Leyland reported better-than-expected numbers. Passenger vehicle sales increased 17% to around 210,000 units, while commercial vehicles grew nearly 22%. Going forward, industry growth is expected to be driven by two-wheelers, though higher costs and interest rates could impact profitability if passed on to customers.

Recommended
More Related Content
What's hot
What's hot (9)
Viewers also liked
Viewers also liked (16)
Similar to Auto monthly Nov-2011-R K Global
Similar to Auto monthly Nov-2011-R K Global (20)
Recently uploaded
Recently uploaded (20)
Auto monthly Nov-2011-R K Global
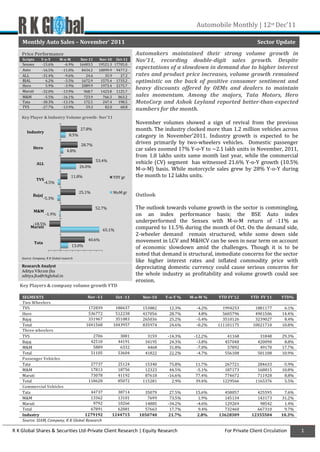
- 1. Automobile Monthly | 12st Dec’11 Monthly Auto Sales – November’ 2011 Sector Update Price Performance Automakers maintained their strong volume growth in Scripts Y-o-Y M-o-M Nov-11 Nov-10 Oct-11 Nov’11, recording double-digit sales growth. Despite Sensex -15.6% -6.9% 16483.5 19521.3 17705.0 Auto -16.5% -11.0% 8434.2 10099.9 9477.2 expectations of a slowdown in demand due to higher interest ALL -31.4% -9.6% 24.6 35.9 27.2 rates and product price increases, volume growth remained BJAL 6.2% -3.5% 1672.9 1575.4 1733.2 optimistic on the back of positive consumer sentiment and Hero 5.9% -3.9% 2089.9 1973.4 2175.7 Maruti -32.0% -13.9% 968.7 1423.8 1125.7 heavy discounts offered by OEMs and dealers to maintain M&M -5.5% -16.1% 723.9 766.3 863.2 sales momentum. Among the majors, Tata Motors, Hero Tata -30.3% -13.1% 172.5 247.4 198.5 MotoCorp and Ashok Leyland reported better-than-expected TVS -27.7% -13.9% 59.3 82.0 68.8 numbers for the month. Key Player & Industry Volume growth- Nov’11 November volumes showed a sign of revival from the previous Industry 27.8% month. The industry clocked more than 1.2 million vehicles across 8.5% category in November’2011. Industry growth is expected to be 28.7% driven primarily by two-wheelers vehicles. Domestic passenger Hero car sales zoomed 17% Y-o-Y to ~2.1 lakh units in November, 2011, 4.8% from 1.8 lakhs units same month last year, while the commercial 53.4% vehicle (CV) segment has witnessed 21.6% Y-o-Y growth (10.5% ALL 26.0% M-o-M) basis. While motorcycle sales grew by 28% Y-o-Y during 11.8% Y0Y gr the month to 12 lakhs units. TVS -4.5% 25.1% MoM gr Bajaj Outlook -5.3% 52.7% The outlook towards volume growth in the sector is commingling, M&M -1.9% on an index performance basis; the BSE Auto index -18.5% underperformed the Sensex with M-o-M return of -11% as Maruti 65.1% compared to 11.5% during the month of Oct. On the demand side, 2-wheeler demand remain structured, while some down side Tata 40.6% movement in LCV and M&HCV can be seen in near term on account 13.0% of economic slowdown amid the challenges. Though it is to be noted that demand is structural, immediate concerns for the sector Source: Company, R K Global research like higher interest rates and inflated commodity price with Research Analyst depreciating domestic currency could cause serious concerns for Aditya Vikram Jha aditya.jha@rkglobal.in the whole industry as profitability and volume growth could see erosion. Key Players & company volume growth YTD SEGMENTS Nov -11 Oct -11 Nov-10 Y-o-Y % M-o-M % YTD FY'12 YTD FY'11 YTD% Two Wheelers TVS 172839 180637 153882 12.3% -4.2% 1994253 1881177 6.1% Hero 536772 512238 417056 28.7% 4.8% 5605796 4901506 14.4% Bajaj 331967 351083 265036 25.2% -5.4% 3510126 3239027 8.4% Total 1041568 1043957 835974 24.6% -0.2% 111101175 10021710 10.8% Three wheelers TVS 2706 3081 3159 -14.3% -12.2% 41168 31848 29.3% Bajaj 42510 44191 34195 24.3% -3.8% 457048 420090 8.8% M&M 5889 6332 4468 31.8% -7.0% 57892 49170 17.7% Total 51105 53604 41822 22.2% -4.7% 556108 501108 10.9% Passenger Vehicles Tata 27737 25124 15340 75.8% 11.7% 267721 284633 -5.9% M&M 17813 18756 12323 44.5% -5.1% 187173 168815 10.8% Maruti 73078 41192 87618 -16.6% 77.4% 774672 711928 8.8% Total 118628 85072 115281 2.9% 39.4% 1229566 1165376 5.5% Commercial Vehicles Tata 44737 38714 35079 27.5% 15.6% 458057 425595 7.6% M&M 13362 13101 7699 73.5% 1.9% 145134 143173 31.2% Maruti 9792 10266 14885 -34.2% -4.6% 129269 98542 1.4% Total 67891 62081 57663 17.7% 9.4% 732460 667310 9.7% Industry 1279192 1244715 1050740 21.7% 2.8% 13628309 12355504 10.3% Source: SIAM, Company, R K Global Research R K Global Shares & Securities Ltd-Private Client Research | Equity Research For Private Client Circulation 1
- 2. Automobile Monthly Domestic Market Share in two-wheelers Two-wheeler Segment The two-wheeler reported robust sales for the month of Others 3.5 November 2011 by 28% on Y-o-Y basis at 1.3 million units. The two wheeler industry reports astral performance for the third TVS 15.6 consecutive month. On M-o-M basis the growth moderated by 1% to 15.72% Y-o-Y growth in Oct 2011. Nov-11 BJAL 33.3 HERO 47.7 % 0.0 10.0 20.0 30.0 40.0 50.0 TVS Motors TVS Motors sales continued to move in line with the industry TVS Motors: Sales Volume trend on stronger two-wheeler sales in comparison to the overall Scooter Motorcycle Y-o-Y gr industry. Overall sales were clocked at 175535 units, an increase 150 54 of 11.8%Y-o-Y (-4.5% M-o-M) growth. Motorcycle volumes stood at ~62608 units, a decline of 1% Y-o-Y (-17% M-o-M). Scooter 130 44 sales witnessed a growth of 22.3% Y-o-Y (decline 5% M-o-M) to 34 '000 Units 110 44 thousand units. The export segment continued to do well with 24 % 90 68.2% Y-o-Y (11.6% M-o-M) growth clocking 24271 units. 14 Cumulative figures during the period April to November, 2011, 70 4 grew by 12% to 15 lakh units as against 13.4 lakh units sold in the 50 -6 same period last year. Nov-10 Feb-11 May-11 Aug-11 Nov-11 Bajaj Auto: Net sales & export volume Bajaj Auto Commercial Motorcycle Y-o-Y gr Bajaj Auto posted healthy volume numbers with exports 30 400 providing strong support (up 25.1% Y-o-Y). Total volumes for the 25 month were at 3.7 lakh units reflecting a decent 25.1% Y-o-Y, '000 Units 350 while on M-o-M basis the company just missed the market 20 expectations to decline at 5.3%. In the two-wheeler segment, % 300 15 Pulsar and Discover brands (accounting for ~68% of total sales to 2.2 lakh units) continued to be the volume driver. The motorcycle 250 10 sales volume rose 25.3% Y-o-Y (decline -5.4% M-o-M) to 3.3 lakh units, While export rose 42% Y-o-Y (decline 2.1% M-o-M) in 200 5 November 2011. The three-wheeler segment for Bajaj Auto Nov-10 Feb-11 May-11 Aug-11 Nov-11 continued its growth of 24.3% Y-o-Y (decline -3.8% M-o-M) to 42510 units. Hero MotoCorp: Sales Volume Volume Y-o-Y gr 550 43 Hero MotoCorp 500 38 Hero MotoCorp (HMC), the market leader in the two-wheeler 33 segment, keeps up the momentum of consistent five lakh-plus 450 28 unit sales every month. The company registered volumes of 5.3 '000 Units 400 23 lakhs unit a growth of 28.7% Y-o-Y (4.8% M-o-M). Cumulative % 350 18 Apr-Nov’11 sales volume grew 10.1% Y-o-Y to 41.5 lakhs units. 300 13 250 8 200 3 Nov-10 Feb-11 May-11 Aug-11 Nov-11 Source: SIAM, Company, R K Global research R K Global Shares & Securities Ltd-Private Client Research | Equity Research For Private Client Circulation 2
- 3. Automobile Monthly Domestic Market Share in Four-wheelers Four-wheeler Segment Domestic passenger car sales registered a stirring performance with a GM 3.7 growth of ~18%Y-o-Y to ~2.1 lakhs units sales volume in November across industry, While the commercial vehicle (CV) segment grows at M&M 7.7 21.6% on Y-o-Y (10.5% M-o-M). However, this segment would Nov-11 continue to face challenges on the interest rate front and could receive Others 11.3 a boost by the end of FY12. Tata 12.5 Hundai 24.8 Maruti 39.9 % 0 10 20 30 40 Maruti Suzuki India Maruti Suzuki: Domestic Sales & export Maruti Suzuki India (MSIL) gets relived from its consecutive drop in volume monthly sales, the company’s total sales increased 65.1% M-o-M (decline 18.5% Y-o-Y). Passenger vehicles were the main driver for the Export Commercial company, it increased 77% M-o-M (decline 16.6% Y-o-Y) to 73078 Passenger Y-o-Y gr 130 40 units. A1 and A3 segment increased by 108% & 104% M-o-M to 10403 120 30 and 38921 units respectively. While the SX4 model gets the 110 20 100 10 momentum supported by strong order book, though sales volume '000 Units 90 0 stood 1433 units (down 87% Y-o-Y). The commercial vehicles segment % 80 -10 continue to be under pressure, its sales volume decline by 34.2% Y-o-Y 70 -20 60 -30 (down 4.6% M-o-M). 50 -40 40 -50 30 -60 Nov-10 Mar-11 Jul-11 Nov-11 Tata Motors: Domestic Sales & export volume Tata Motors Domestic sales of the company have increased by 41% Y-o-Y (13% M- Export Commercial o-M) to 76823 units; despite the good performance in domestic Passenger Y-o-Y gr 90 70 segment, the company's exports in the period under review increased 80 60 only by 3.5% at 4349 units. Passenger vehicles were the main 70 50 contributor which increased 75.8% Y-o-Y (11.7% M-o-M) to 28774 40 60 units, while makeover of Nano boosts sales by 65% M-o-M to 6401 '000 Units 30 50 units. The Indica range reported sales volume of 10926 units, up 91% 20 % 40 10 Y-o-Y, while the Indigo segment recorded sales volume of 6213 units, a 30 0 increase of 2.4% Y-o-Y (decrease of 0.9% M-o-M) in comparison to the 20 -10 same month last year. Sales of Sumo, Safari, Aria and Venture segment 10 -20 grew 35% Y-o-Y (0.5% M-o-M) to 4179 units. Commercial vehicle rose Nov-10 Mar-11 Jul-11 Nov-11 27.5% Y-o-Y, where LCV segment was the main contributor which increased 40.7% Y-o-Y (31% M-o-M) to 28673 units. M&HCV sales Source: SIAM, Company, R K Global research stand at 16064 units up both by 9.3% Y-o-Y (decline 4.5% M-o-M). R K Global Shares & Securities Ltd-Private Client Research | Equity Research For Private Client Circulation 3
- 4. Automobile Monthly Mahindra & Mahindra: Sales Volume (excl. tractors) Mahindra and Mahindra Passenger Vehicles Commercial Vehicles Sales volume Y-o-Y gr M&M reported strong 30.5% Y-o-Y growth in total volume to 85 65 75 58249 units, The automotive sale stood 40722 units during 55 65 Nov’11, a increase of 52.7% Y-o-Y, while in FES segment total sales 45 volume accounted to 17527 units, a decline of -2.6% Y-o-Y (-44.5% '000 Units 55 45 35 M-o-M). In the tractor space, domestic sales beg off 4.7% Y-o-Y 35 25 (decline 47% M-o-M), while export showed a striking growth of 25 15 32.8% Y-o-Y (2.5% M-o-M). In automotive segment, LCV & M&HCV 15 5 5 sales volume grew by 46.8% Y-o-Y, where as four- wheeler pick up Nov-10 Feb-11 May-11 Aug-11 Nov-11 segment continued a strong growth of 73.6% Y-o-Y. Automotive % export showed astral performance of 71% Y-o-Y (19% M-o-M), to 2563 units during November 2011. Tractor Sales Tractor Sales Y-o-Y gr 35 60 30 40 20 '000 Units 25 0 20 -20 15 -40 10 -60 % Nov-10 Feb-11 May-11 Aug-11 Nov-11 Ashok Leyland: Sales & export volume Ashok Leyland Ashok Leyland (ALL), the Hinduja group company sales volume Export Volume Y-o-Y gr 15 60 witnessed astral performance of 53.4% Y-o-Y (26.1% M-o-M), to 13 50 7878 units in Nov’11. Domestic sales scaled up by 66.7% Y-o-Y 40 (11.0% M-o-M) to 6477 units. While exports which were on the 11 30 higher side for many months now, continued its uptrend 11.9% Y- '000 Units 20 o-Y to 1401 units. The company’s Apr-Nov’11 sales volume 9 10 showed muted performance grew 0.3% Y-o-Y to 57035 units. 7 0 While domestic sales fell 1.5% Y-o-Y to 49478 units, exports -10 5 surged 14.2% to 7588 units. However, this year there has been a -20 3 -30 sharp slowdown, especially as the RBI has hiked interest rates several times, which in turn has increased the cost of truck Nov-10 Feb-11 May-11 Aug-11 Nov-11 % financing. Source: SIAM, Company, R K Global research R K Global Shares & Securities Ltd-Private Client Research | Equity Research For Private Client Circulation 4
- 5. Automobile Monthly For Suggestions, clarifications & your valuable feedback write back to us at: R K Global Research R K Global Institutional Sales R K Global Shares & Securities Ltd: R K Global Shares & Securities Ltd: Flat No.: B12, Park Tower, 503 & 504 Adamji Building, 67B Ballygunge Circular Road, Narsi Natha Street, Masjid Bunder (West) Kolkata – 700 019 Mumbai- 400 009 Board: +91 (33) 4017 4999 Board: +91 (22) 4360 2222 E-Mail: research@rkglobal.in E-Mail: inst.desk@rkglobal.in Locate Us… City Address Contact 501, Wall Street, near Gujarat College, Ahmedabad +91 (79) 4002 0999 Ahmedabad-380 006 Suite 5, Sagar Apartment, 6 Tilak Marg, Delhi +91 (11) 4310 0999 New Delhi-110 001 248, Ganpati Plaza, 2nd Floor, M I Road, Jaipur +91 (141) 404 0999 Jaipur-302 001 2 Saklat Place, Suite 9, Kolkata +91 (33) 4014 1999 Kolkata- 700 072 308, 3rd Floor Morya Estate, Opposite Infiniti Mall, New Link Road, Mumbai +91 (22) 4210 5555 Andheri West, Mumbai-400 053 163/2, Kutcherry Road, Mylapore Chennai +91 (44) 4593 9999 Chennai- 600 004 Rating Criteria BUY Stock to generate return above 15% from CMP over the next 12 months period HOLD Stock to generate return between 0-15% from CMP over the next 12 months period SELL Stock to generate less than 0% from CMP over the next 12 months period Coverage Terminology IC = Initiating Coverage RU = Result Update EU = Event Update NC = Not Covered www.rkglobal.net Disclaimer: This document is not for public distribution and has been furnished to you solely for your information and must not be reproduced or redistributed to any other person. Persons into whose possession this document may come are required to observe these restrictions. Opinion expressed is our current opinion as of the date appearing on this material only. While we endeavor to update on a reasonable basis the information discussed in this material, there may be regulatory, compliance, or other reasons that prevent us from doing so. Prospective investors and others are cautioned that any forward-looking statements are not predictions and may be subject to change without notice. Our proprietary trading and investment businesses may make investment decisions that are inconsistent with the recommendations expressed herein. The information in this document has been printed on the basis of publicly available information, internal data and other reliable sources believed to be true and are for general guidance only. While every effort is made to ensure the accuracy and completeness of information contained, the company takes no guarantee a nd assumes no liability for any errors or omissions of the information. No one can use the information as the basis for any claim, demand or cause of action. Recipients of this material should rely on their own investigations and take their own professional advice. Each recipient of this document should make such investigations as it deems necessary to arrive at an independent evaluation of an investment in the securities of companies referred to in this document (including the merits and risks involved), and should consult their own advisors to determine the merits and risks of such an investment. R K Global, its directors, analysts or employees do not take any responsibility, financial or otherwise, of the losses or the damages sustained due to the investments made or any action taken on basis of this report. R K Global Shares & Securities Ltd-Private Client Research | Equity Research For Private Client Circulation 5