SlideShare a Scribd company logo
1 of 6
Download to read offline
Mahindra & Mahindra
Automobile
Q3 FY16 RESULT ANALYSIS
Buy
Relative Capital Market Strength
Mahindra & Mahindra Ltd. (M&M) reported Rs807.9 cr net profit for Q3FY16,
registering a decline of 14.2% YoY and 12.5% QoQ. Operating income increased
by 16.8% YoY and 19.9% QoQ to Rs11,008.3 cr in line with our estimate of
Rs10,823.2 cr. Healthy growth in revenue was mainly driven by strong 23.9%
YoY growth in automotive segment, while farm equipment segment continued
to witness sluggish growth at 4.4% YoY. Volumes in the automotive segment
were higher by 11.0% YoY while farm equipment segment volumes witnessed
an increase of 4.9% YoY. Realisation/unit for automotive segment improved by
9% YoY, however it declined 2% YoY for farm equipment segment as the
company did not increase the prices of tractors so far this fiscal. Expenses front,
M&M highlighted Rs1000 mn one-off costs related to employee bonus for
earlier quarters, forex and others. Despite this, EBIDTA grew by 25% YoY and
21% QoQ to Rs1,242 cr. Further, various cost control measures and prevailing
soften commodity prices also helped EBIDTA margin to improve to 11.3% in the
reported quarter from 10.5% in Q3FY15 and 11.1% in Q2FY16. Overall, M&M’s
net profit declined 14.2% YoY, however this can be partly attributed to Rs299.3
cr exceptional gain in the same quarter of previous fiscal. While adjusted for
exceptional items, net profit grew by 15.9% during Q3FY16. Its (M&M+MVML)
revenues, EBIDTA, PAT increased 15%,31%,-15% YoY and 19%,21.6%,-16% QoQ
in Q3FY16.
New model launches performance: As announced, M&M has completed all the 9
products launches over the past 15 months namely, KUV100, TUV300, Jeeto,
refreshed XUV500, Thar, Subro, Imperio etc. The latest launched model in
compact utility vehicle category include KUV100 and TUV 300 have been doing
well. Management indicated that the company is getting new orders to the tune
of 350 vehicles per day for KUV100 and current order book has stood at around
18,000 vehicles. TUV300 is currently clocking a monthly volume of around 4000
units, in line with company’s expectations.
• After a series of new launches, we expect a pick up in the utility vehicles (UV)
sales volume as well as M&M’s market share which was declined to below 40%
in 2015 from 47.9% in Q3FY13 owing to the lack of new launches.
• Tractors sales volume is continued to be impacted by sluggish demand from
agriculture sector on account of second successive below normal monsoon. As
the rabi crop sowing has been lower by about 3%, recovery in tractor volume is
not likely to happen in Q4FY16. We expect recovery in tractor volume in
current year amidst expectation of normal monsoon this year after two
consecutive droughts.
• With the improvement in industrial and infrastructure activity, the growth
scenario for commercial vehicles segment (light + medium + heavy) is likely to
revive.
1
Feb 18, 2016
Rating Matrix
CMP Rs1,202
Rating Buy
Target Price Rs1,411
Target Period 12 Months
Upside Potential 17.4%
52 week H/L Rs1,442/1,095
Face value Rs5
Sector Automobile
Category Large Cap
© CHOICE INSTITUTIONAL RESEARCH Satish Kumar Sharma | Desk Phone: 022 - 6707 9913 | satish.kumar@choiceindia.com
Particulars (Rs cr) Q3FY16 Actual Our Estimates Var.(%)
Operating
Revenue
11,008.2 10,825.2 1.7%
EBIDTA 1,242.4 1,247.2 -0.3%
Net Profit 807.9 879.6 -8.2%
Shareholding Pattern as on Dec 2015
Particulars Dec'15 Sep'15 Jun'15 Mar'15
Promoters 27.1% 25.6% 25.6% 25.7%
FPIs 39.3% 35.6% 33.0% 37.6%
DIIs 19.8% 19.4% 22.7% 18.5%
Non Insti. 13.7% 13.8% 13.1% 12.9%
Others - 5.6% 5.6% 5.4%
0.75
0.8
0.85
0.9
0.95
1
1.05
1.1
1.15
1.2
1.25
1.3
12-Feb-15
12-Mar-15
12-Apr-15
12-May-15
12-Jun-15
12-Jul-15
12-Aug-15
12-Sep-15
12-Oct-15
12-Nov-15
12-Dec-15
12-Jan-16
12-Feb-16
Sensex M&M
Valuation and View: We expect pick up in UV segment sales volume on the back
of new launches (KUV 100, TUV 3OO) and gradual recovery in tractor volume on
the expectation of good monsoon. Besides, company’s sustained focus on R&D
and cost control measures and agility to respond quickly to regulatory hurdles
are the other key positive for M&M. Core business is valued at
EV/EBIDTA(11.5)xFY17E stands at Rs1,024 and subsidiaries at a 20% discount to
CMP at Rs387. On the basis of SOTP Valuation, we arrive at a target price of
Rs1,411, which implies 17.4% upside potential to CMP. We kept earning
estimates intact, however, downward revision in the price target was due to the
sharp decline in the CMP of subsidiaries.
2
Source: Choice Broking, Company data
Key Financials (M&M Standalone)
© CHOICE INSTITUTIONAL RESEARCH
Mahindra & Mahindra
Automobile
Particulars (Rs cr) Q3FY16 Q3FY15 YoY Q2FY16 QoQ
Operating Income 11,008.3 9,427.3 16.8% 9,245.6 19.1%
Operating Expenditure 9,765.9 8,433.0 15.8% 8,219.2 18.8%
EBIDTA 1,242.4 994.3 25.0% 1,026.4 21.0%
EBIDTA Margin 11.3% 10.5% 11.1%
Depreciation/Amortisation 295.9 234.4 26.2% 250.0 18.4%
Other Income 10,061.8 8,667.4 16.1% 8,469.2 18.8%
Finance Costs 88.6 84.3 5.1% 485.4 -81.7%
Tax 39.7 43.5 -8.7% 38.1 4.1%
Minority Interest 250.2 157.9 58.5% 300.0 -16.6%
Exceptional Items 62.8 299.3 - -
Net Profit 807.9 942.1 -14.2% 923.7 -12.5%
NPM 7.3% 10.0% 10.0%
EPS Diluted 13.0 15.2 -14.2% 13.7 -5.0%
Segment Wise Revenue
Particulars (Rs cr) Q3FY16 Q3FY15 YoY Q2FY16 QoQ
Automotive Segment 7,428.0 5,995.9 23.9% 6,404.0 16.0%
Farm Equipment Segment 3,583.3 3,431.6 4.4% 2,844.2 26.0%
Segmental details Q3FY15 Q4FY15 Q1FY16 Q2FY16 Q3FY16
Farm Equipment
Tractor (Units) 59,714 38,604 62,358 45,246 62,666
Net Sales (Rs cr) 3,472 2,535 3,572 2,844 3,583
Realisation/unit 581,472 656,694 572,854 628,608 571,809
Automotive
Volume (units) 113,400 123,175 109,567 113,132 125,918
Net Sales (Rs cr) 6,111 7,023 6,260 6,404 7,428
Realisation/unit 538,877 570,134 571,334 566,064 589,908
1.5%
6.9%
-9.2%
-13.1%
-3.4%
-1.80%
16.8%
-15.0%
-10.0%
-5.0%
0.0%
5.0%
10.0%
15.0%
20.0%
0.0
2,000.0
4,000.0
6,000.0
8,000.0
10,000.0
12,000.0
Rscr
Operating Income Trend
Operating Income Growth (YoY)
0
50,000
100,000
150,000
200,000
Volume Turnover
Tractor (Units) Auto Volume (units)
3
Source: Choice Broking, Company data
© CHOICE INSTITUTIONAL RESEARCH
Automobile
Mahindra & Mahindra
Purchase of
Finished
Goods, 24.7%
Cost of
Services & Raw
Materials,
42.7%
Operating &
Manf. Exp. ,
10.5%
Employee
Cost, 5.8%
Operating Expenditure/Sales (Q3FY16)
Purchase of
Finished Goods
17.6%
Cost of
Services & Raw
Materials
49.9%
Operating &
Manf. Exp.
10%
Employee
Cost
6.5%
Operating Expenditure/Sales (Q3FY15)
12.5%
10.6% 10.5%
9.4%
12.7%
11.1% 11.3%
0.0%
3.0%
6.0%
9.0%
12.0%
15.0%
0.0
1,000.0
2,000.0
Rscr
EBIDTA Margins improves in Q3FY16
EBIDTA EBIDTA Margin
881.8
946.6 942.1
550.6
852.2
923.7
807.9
8.7%
9.9% 10.0%
5.8%
8.7%
10%
7.3%
0.0%
2.0%
4.0%
6.0%
8.0%
10.0%
12.0%
0.0
200.0
400.0
600.0
800.0
1000.0
Rscr
Q3FY16 PAT stands at Rs807.9 cr
PAT NPM
Conference Call – Key Takeaways:
 The company has completed all the 9 product launches in the current year, as announced earlier. The
full impact of the new launches would be reflected in the financials of FY17.
 The new launches,TUV300 and KUV100 – have done well. TUV300 is currently clocking a monthly
volume of around 4000, in line with company’s expectations.
 KUV100 has current order book of around 18000 vehicles. The company has been receiving new orders
to the tune of 350 vehicles per day. The company would be continuing with the current capacity level
of 5000 per month till August 2016; thereafter, the capacity could be increased to 7500 per month.
 Currently 45% of KUV100 sold is of petrol version.
 The company has effected an increase of 1.7% in selling price YTD.
 The Minimum Import Price on steel is not expected to have much impact on company’s cost structure.
 There has been no increase in selling price of tractors during the current year.
 The company has maintained its leadership position in Pick-up segment (2 to 3.5T) with 70% market share.
4
Source: Choice Broking, Company data
© CHOICE INSTITUTIONAL RESEARCH
Automobile
Improving Demand Scenario of Automobile Industry
The demand scenario of Indian Automobile Industry is gradually reviving after witnessing slowdown over the past two
fiscals driven by improving economic scenario. Improvement in industrial and infrastructure activity is gaining
momentum on the back of key initiatives taken by the new government, while the low inflation has driven RBI to cut
interest rate by 125 basis points since January 2015. Prevailing low commodity prices coupled with a decline in fuel
prices has augured well for the Indian automobile industry. We expect a strong recovery in industry demand in near
future driven by thrust of government given for infrastructure development, easing interest rate in the economy and
increase in income levels and lifestyle aspirations.
We expect pick up in UV segment sales volume on the back of new launches (KUV 100, TUV 3OO) and gradual recovery in
tractor volume on the expectation of good monsoon. Besides, company’s sustained focus on R&D and cost control
measures and agility to respond quickly to regulatory hurdles are the other key positive for M&M. Core business is
valued at EV/EBIDTA(11.5)x of FY17E stands at Rs1,024 and subsidiaries at a 20% discount to CMP at Rs387. On the basis
of SOTP Valuation, we arrive at target price of Rs1,411, which implies 17.4% upside potential to CMP. We kept earning
estimates intact, however, downward revision in the price target was due to the sharp decline in the CMP of subsidiaries.
SOTP Valuation Value/ share (Rs)
Value for core business (M&M+MVML) EV/EBIDTA(11.5)x of FY17E 1,024
Total subsidiaries’ value after 20% discount to CMP 387
Target Price (Rs) 1,411
Mahindra & Mahindra
Relative Valuation
Companies (Rs) CMP 6M R(%) 12M R(%)
M. Cap
Rs mn
EPS BVPS
EBIDTA
Margin (%)
NPM (%)
Atul Auto Ltd. 482 15.8% -15.1% 10,796.8 20.2 53.9 14.2% 8.7%
Escorts Ltd. 120 -24.1% -2.8% 14,278.2 7.2 147.6 4.1% 2.5%
Force Motors Ltd. 2,349 -15.2% 78.8% 30,950.9 115.3 999.2 8.0% 5.4%
Mahindra & Mahindra Ltd. 1,204 -12.5% -0.3% 712,938.0 53.0 323.3 11.3% 8.0%
Maruti Suzuki India Ltd. 3,706 -19.1% 3.7% 1,119,538.7 156.3 784.7 16.1% 8.6%
Tata Motors Ltd. 301 -15.3% -47.0% 1,022,165.9 22.3 165.6 13.0% 2.9%
Average 1,360.3 -11.7% 2.9% 485,111.4 62.4 412.4 11.1% 6.0%
Companies (Rs mn) P/E (x) P/Bv (x) P/Sales(x)
EV/EBIDTA
(x)
D/E
PAT
(TTM)
EBIDTA
(TTM)
Sales (TTM)
Atul Auto Ltd. 23.9 8.9 2.1 14.2 0.0 451.7 738.8 5,206.8
Escorts Ltd. 16.7 0.8 0.4 11.7 0.3 857.2 1,432.1 34,665.0
Force Motors Ltd. 20.4 2.4 1.1 12.4 0.0 1,519.6 2,261.6 28,244.0
Mahindra & Mahindra Ltd. 22.7 3.7 1.8 16.5 0.2 31,343.1 44,217.7 391,417.5
Maruti Suzuki India Ltd. 23.7 4.7 2.0 12.8 0.0 47,220.2 87,928.5 546,933.8
Tata Motors Ltd. 13.5 1.8 0.4 4.3 1.3 75,631.9 338,073.6 2,600,177.1
Average 20.1 3.7 1.3 12.0 0.3 26,170.6 79,108.7 601,107.4
5
Source: Choice Broking, Company data
© CHOICE INSTITUTIONAL RESEARCH
Automobile
Profit And Loss Statement Balance Sheet
Particulars (Rs cr) FY14 FY15 FY16E FY17E
Net Sales 40,508.5 38,945.4 41,598.3 47,286.7
% Growth 0.2% -3.9% 6.8% 13.7%
Total Revenue 41,226.5 39,794.3 42,412.8 48,279.8
% Growth 0.5% -3.5% 6.6% 13.8%
Staff Costs 2,163.7 2,317.0 2,037.7 2,225.1
% of Net Sales 5.3% 5.9% 4.9% 4.7%
Other Manufacturing/Operating
costs 32,033.4 31,155.1 33,434.7 38,014.0
% of Net Sales 79.1% 80.0% 80.4% 80.4%
Other Expenses 1,590.1 1,300.0 1,333.3 1,499.3
% of Net Sales 3.9% 3.3% 3.2% 3.2%
Total Operating Expenditures 35,787.3 34,772.1 36,805.7 41,738.4
% of Net Sales 88.3% 89.3% 88.5% 88.3%
EBITDA 4,721.2 4,173.3 4,792.5 5,548.4
EBITDA Margin % 11.7% 10.7% 11.5% 11.7%
Growth % 0.6% -11.6% 14.8% 15.8%
Depreciation & Amortisation 863.3 974.9 984.5 1,090.4
EBIT 3,857.9 3,198.4 3,808.0 4,458.0
Financial Charges 259.2 214.3 289.6 299.6
Other Income 718.0 848.9 814.6 993.1
Exceptional Income / Expenses 52.8 335.7 0.0 0.0
PBT 4,369.4 4,168.8 4,333.0 5,151.4
Pre-tax Margin % 10.8% 10.7% 10.4% 10.9%
Tax 611.1 847.8 953.3 1,133.3
Effective Tax Rate % 14.0% 20.3% 22.0% 22.0%
Reported PAT 3,758.4 3,321.0 3,379.8 4,018.1
Net Profit Margin % 9.3% 8.5% 8.1% 8.5%
Growth in Reported PAT % 12.1% -11.6% 1.8% 18.9%
Extrodinary Income 0.0 0.0 0.0 0.0
Adjusted PAT 3,758.4 3,321.0 3,379.8 4,018.1
Shares In Issue 59.0 59.1 59.2 59.2
Adjusted EPS (Basic) 63.7 56.2 57.1 67.9
Growth % 12.1% -11.8% 1.7% 18.8%
Dividend paid* 862.3 879.9 867.3 983.2
Dividend pay out ratio 22.9% 26.5% 25.7% 24.5%
Net profit transferred to Reserves
Acccount 2,896.1 2,441.1 2,512.4 3,034.9
Adjusted PAT incl MVML 3,905.0 3,423.0 3,559.8 4,268.1
Particulars (Rs cr) FY14 FY15 FY16E FY17E
Gross Asset 10,796.1 12,354.8 13,739.5 15,796.8
Accumulated Depriciation 4,919.2 5,894.1 6,878.6 7,969.0
Capital WIP 1,228.4 1,647.4 1,722.2 1,957.7
Net Fixed Asset 7,105.4 8,108.1 8,583.1 9,785.5
Investments & Deposits 11,379.8 13,241.6 15,743.0 17,935.0
Current Asset 12,803.4 11,594.8 11,998.3 13,641.0
Cash 2,950.4 2,064.8 2,170.7 2,767.6
Inventories 2,803.6 2,437.6 2,938.6 3,290.6
Trade Debtors 2,509.8 2,558.0 2,462.3 2,861.4
Loans and Advances 4,539.6 4,534.4 4,426.7 4,721.3
Current Liabilities & Provisions 8,766.1 8,868.2 9,434.9 10,567.9
Net Current Asset Excluding Cash 1,087.0 661.8 392.7 305.5
Capital Deployed 22,522.6 24,076.3 26,889.5 30,793.6
Long-term Liabilities and Provisions 5,731.4 4,821.8 5,121.8 5,991.0
Total Non Current Liabilities 5,731.4 4,821.8 5,121.8 5,991.0
Share Capital 295.2 295.7 295.9 295.9
Reserve and Surplus 16,496.0 18,959.4 21,471.8 24,506.7
Total Stock Holder's Equity 16,791.2 19,255.1 21,767.7 24,802.6
Capital Employed 22,522.6 24,076.9 26,889.5 30,793.6
DIFF 0.0 -0.6 0.0 0.0
Mahindra & Mahindra
Particulars (Rs cr) FY14 FY15 FY16E FY17E
Profit before tax 4369.4 4168.8 4333.0 5151.4
Depreciation 871.3 974.9 984.5 1090.4
Interest Expense 259.2 214.3 289.6 299.6
Operating Profit Before WC Changes 5499.9 5358.0 5607.1 6541.4
Changes In WC -1518.7 425.2 269.1 87.3
Gross cash generated from Operations 3981.2 5783.1 5876.2 6628.7
Direct taxes paid 611.1 847.8 953.3 1133.3
Cash Flow from Operations 3370.1 4935.4 4922.9 5495.4
Capital Expenditure (CAPEX) (2155.3) (1977.6) (1459.5) (2292.8)
Investments 453.7 (1861.8) (2501.4) (2192.0)
Net Cash Used In Investing Activities (1701.6) (3839.4) (3960.9) (4484.8)
Change in Debt 1385.8 (909.7) 300.0 869.2
Change in Equity 0.0 0.5 0.2 0.0
Dividends Paid (862.3) (879.9) (867.3) (983.2)
Interest Paid (259.2) (214.3) (289.6) (299.6)
Others (763.8) 22.3 0.0 0.0
Net Cash used in Financing Activities (499.5) (1981.0) (856.7) (413.6)
Net Increase in Cash and Cash Equivalents 1169.0 (885.1) 105.3 597.0
Cash and cash equivalents At the
beginning 1781.4 2950.4 2064.8 2170.7
Net Increase in Cash and Cash Equivalents 1169.0 -885.1 105.3 597.0
Cash and cash equivalents At the end 2950.4 2065.3 2170.1 2767.7
Cash balance as per balance sheet 2950.4 2064.8 2170.7 2767.6
difference 0.0 0.5 -0.6 0.1
Particulars (Rs cr) FY14 FY15 FY16E FY17E
Profitability Ratios
Return on Assets (ROA) 12.0% 10.1% 9.3% 9.7%
Return on Equity (ROE) 22.4% 17.2% 15.5% 16.2%
Return on Capital Employed (ROCE) 17.1% 13.3% 14.2% 14.5%
Dupont Analysis-ROE Decomposition
PAT/PBT (Tax Efficiency) 0.9 0.8 0.8 0.8
PBT/EBIT (Interest Burden) 1.1 1.3 1.1 1.2
EBIT/Sales (OPM) 0.1 0.1 0.1 0.1
Sales/Total Assets (Asset Turnover) 1.3 1.2 1.1 1.1
TA/NW (Financial Leverage) 1.9 1.7 1.7 1.7
ROE 22.4 17.2 15.5 16.2
Liquidity Ratios
Current Ratio 1.5 1.3 1.3 1.3
Acid Test Ratio 1.1 1.0 1.0 1.0
Debt-Equity Ratio 0.3 0.3 0.2 0.2
Efficiency Ratios
Assets Turnover Ratio 1.3 1.2 1.1 1.1
Working Capital Turnover Ratio 10.0 14.3 16.2 15.4
F.A. Turnover Ratio 5.7 4.8 4.8 4.8
C.A. Turnover Ratio 3.2 3.4 3.5 3.5
Debtors Velocity 22.6 24.0 21.6 22.1
Margin Ratios (%)
EBITDA Margin 11.7% 10.7% 11.5% 11.7%
Pre-Tax Margin 10.8% 10.7% 10.4% 10.9%
Net Profit Margin 9.3% 8.5% 8.1% 8.5%
Growth Ratios YoY (%)
Net Sales 0.2% -3.9% 6.8% 13.7%
EBITDA 0.6% -11.6% 14.8% 15.8%
Adj.PAT 12.1% -11.6% 1.8% 18.9%
Adj.EPS 12.1% -11.8% 1.7% 18.8%
Working Ratios (Days)
Inventory 25.3 22.8 25.8 25.4
Debtors 22.6 24.0 21.6 22.1
Net Working Capital Excluding Cash 1087.0 661.8 392.7 305.5
Per Share (Rs.)
Adj.EPS 63.7 56.2 54.4 64.7
CEPS 78.3 72.6 70.3 82.3
DPS 14.6 14.9 14.0 15.8
BVPS 284.5 325.6 350.5 399.4
Cash Per Share 50.0 34.9 35.0 44.6
Valuation Parameters
P/E 14.3 22.3 22.1 18.6
P/CEPS 11.6 17.2 17.1 14.6
P/BV 3.2 3.8 3.4 3.0
EV/EBIDTA 12.0 18.4 16.2 14.0
6
Disclaimer
This is solely for information of clients of Choice Broking and does not construe to be an investment advice. It is also not intended as an offer or solicitation
for the purchase and sale of any financial instruments. Any action taken by you on the basis of the information contained herein is your responsibility alone
and Choice Broking its subsidiaries or its employees or associates will not be liable in any manner for the consequences of such action taken by you. We have
exercised due diligence in checking the correctness and authenticity of the information contained in this recommendation, but Choice Broking or any of its
subsidiaries or associates or employees shall not be in any way responsible for any loss or damage that may arise to any person from any inadvertent error in
the information contained in this recommendation or any action taken on basis of this information. This report is based on the fundamental analysis with a
view to forecast future price. The Research analysts for this report certifies that all of the views expressed in this report accurately reflect his or her personal
views about the subject company or companies and its or their securities, and no part of his or her compensation was, is or will be, directly or indirectly
related to specific recommendations or views expressed in this report. Choice Broking has based this document on information obtained from sources it
believes to be reliable but which it has not independently verified; Choice Broking makes no guarantee, representation or warranty and accepts no
responsibility or liability as to its accuracy or completeness. The opinions contained within the report are based upon publicly available information at the
time of publication and are subject to change without notice. The information and any disclosures provided herein are in summary form and have been
prepared for informational purposes. The recommendations and suggested price levels are intended purely for stock market investment purposes. The
recommendations are valid for the day of the report and will remain valid till the target period. The information and any disclosures provided herein may be
considered confidential. Any use, distribution, modification, copying, forwarding or disclosure by any person is strictly prohibited. The information and any
disclosures provided herein do not constitute a solicitation or offer to purchase or sell any security or other financial product or instrument. The current
performance may be unaudited. Past performance does not guarantee future returns. There can be no assurance that investments will achieve any targeted
rates of return, and there is no guarantee against the loss of your entire investment.
POTENTIAL CONFLICT OF INTEREST DISCLOSURE (as on date of report) Disclosure of interest statement – • Analyst interest of the stock /Instrument(s): - No. •
Firm interest of the stock / Instrument (s): - No.
Choice Equity Broking Pvt. Ltd.
Choice House, Shree Shakambhari Corporate Park, Plt No: -156-158,
J.B. Nagar, Andheri (East), Mumbai - 400 099.
+91-022-6707 9999
+91-022-6707 9959
www.choiceindia.com
Choice’s Rating Rationale
The price target for a large cap stock represents the value the analyst expects the stock to reach over next 12 months. For a
stock to be classified as Outperform, the expected return must exceed the local risk free return by at least 5% over the next
12 months. For a stock to be classified as Underperform, the stock return must be below the local risk free return by at least
5% over the next 12 months. Stocks between these bands are classified as Neutral.
BUY Absolute Return >15%
Accumulate Absolute Return Between 10-15%
Hold Absolute Return Between 0-10%
Reduce Absolute Return 0 To Negative 10%
Sell Absolute Return > Negative 10%
Coverage History
Date Recommendation CMP (Rs) Target Price (Rs)
18-Feb-16 Buy 1,202 1,411
07-Nov-15 Buy 1,248 1,437
12-Aug-15 Hold 1,339 1,441
03-Jun-15 Buy 1,202 1,375
06-Apr-15 Buy 1,200 1,419
Institutional Equity Team
Name Designation Email id Contact No.
Ajay Kejriwal President ajay@choiceindia.com 022- 6707 9850
Sumeet Bagadia Head of Research sumeet.bagadia@choiceindia.com 022 - 6707 9830
Amit Singh VP - Institutional Sales amit.singh@choiceindia.com 022 - 6707 9852
Devendra Gaikwad Sr. Manager - Institutional Sales devendra.gaikwad@choiceindia.com 022 - 6707 9877
Rajnath Yadav Research Analyst rajnath.yadav@choiceindia.com 022 - 6707 9912
Satish Kumar Research Analyst satish.kumar@choiceindia.com 022 - 6707 9913
Kunal Parmar Research Associate kunal.parmar@choiceindia.com 022 - 6707 9982
Amit Pathania Research Associate amit.pathania@choiceindia.com 022 - 6707 9979
Vikas Chaudhari Research Associate vikas.chaudhari@choiceindia.com 022 - 6707 9988
Trirashmi Ghoderao Research Advisor trirashmi.ghoderao@choiceindia.com 022 - 6707 9972
Neeraj Yadav Research Advisor Neeraj.yadav@choiceindia.com 022 - 6707 9988
Satish Kumar
Digitally signed by Satish Kumar
DN: cn=Satish Kumar, o=Choice Equity
Broking Pvt. Ltd., ou=Research Analyst,
email=satish.kumar@choiceindia.com, c=US
Date: 2016.02.18 11:02:08 +05'30'

More Related Content

What's hot

Dony 1020311
Dony   1020311Dony   1020311
Dony 1020311donyjo
 
Choice Broking Research-Mahindra & Mahindra
Choice Broking Research-Mahindra & MahindraChoice Broking Research-Mahindra & Mahindra
Choice Broking Research-Mahindra & Mahindrachoice broking
 
Bharti airtel ventura_090213
Bharti airtel ventura_090213Bharti airtel ventura_090213
Bharti airtel ventura_090213prasoonster
 
Revival of Automotive Business
Revival of Automotive BusinessRevival of Automotive Business
Revival of Automotive BusinessSonu Sankhyan
 
2015 China Auto Marketing and Communication Review
2015 China Auto Marketing and Communication Review2015 China Auto Marketing and Communication Review
2015 China Auto Marketing and Communication ReviewHavas
 
Fce tvs motors_28_jul15
Fce tvs motors_28_jul15Fce tvs motors_28_jul15
Fce tvs motors_28_jul15IndiaNotes.com
 

What's hot (20)

Auto Components Sector Report November 2017
Auto Components Sector Report November 2017Auto Components Sector Report November 2017
Auto Components Sector Report November 2017
 
Auto Components Sector Report July 2017
Auto Components Sector Report July 2017Auto Components Sector Report July 2017
Auto Components Sector Report July 2017
 
Auto Components Sector Report January 2018
Auto Components Sector Report January 2018Auto Components Sector Report January 2018
Auto Components Sector Report January 2018
 
Dony 1020311
Dony   1020311Dony   1020311
Dony 1020311
 
Auto Components Sector Report - October 2018
Auto Components Sector Report - October 2018Auto Components Sector Report - October 2018
Auto Components Sector Report - October 2018
 
Auto Component Sector Report October 2017
Auto Component Sector Report October 2017Auto Component Sector Report October 2017
Auto Component Sector Report October 2017
 
Msil
MsilMsil
Msil
 
India Auto Sales Data July 2019
India Auto Sales Data July 2019India Auto Sales Data July 2019
India Auto Sales Data July 2019
 
Choice Broking Research-Mahindra & Mahindra
Choice Broking Research-Mahindra & MahindraChoice Broking Research-Mahindra & Mahindra
Choice Broking Research-Mahindra & Mahindra
 
Auto components Sector Report May 2018
Auto components Sector Report May 2018Auto components Sector Report May 2018
Auto components Sector Report May 2018
 
Auto Components Sector Report - September 2018
Auto Components Sector Report - September 2018Auto Components Sector Report - September 2018
Auto Components Sector Report - September 2018
 
Auto Components Sector Report - November 2018
Auto Components Sector Report - November 2018Auto Components Sector Report - November 2018
Auto Components Sector Report - November 2018
 
Auto Components Sector Report - December 2018
Auto Components Sector Report - December 2018Auto Components Sector Report - December 2018
Auto Components Sector Report - December 2018
 
Bharti airtel ventura_090213
Bharti airtel ventura_090213Bharti airtel ventura_090213
Bharti airtel ventura_090213
 
Johan cloete
Johan cloeteJohan cloete
Johan cloete
 
Auto Components Sector Report December 2017
Auto Components Sector Report December 2017Auto Components Sector Report December 2017
Auto Components Sector Report December 2017
 
Stocks
StocksStocks
Stocks
 
Revival of Automotive Business
Revival of Automotive BusinessRevival of Automotive Business
Revival of Automotive Business
 
2015 China Auto Marketing and Communication Review
2015 China Auto Marketing and Communication Review2015 China Auto Marketing and Communication Review
2015 China Auto Marketing and Communication Review
 
Fce tvs motors_28_jul15
Fce tvs motors_28_jul15Fce tvs motors_28_jul15
Fce tvs motors_28_jul15
 

Viewers also liked

Akzo Nobel India- Result Analysis Q2FY16
Akzo Nobel India- Result Analysis Q2FY16Akzo Nobel India- Result Analysis Q2FY16
Akzo Nobel India- Result Analysis Q2FY16choice broking
 
Coal India Ltd. Q2 FY16 Result Update
Coal India Ltd. Q2 FY16 Result UpdateCoal India Ltd. Q2 FY16 Result Update
Coal India Ltd. Q2 FY16 Result Updatechoice broking
 
Morning tea 02 12-2015
Morning tea 02 12-2015Morning tea 02 12-2015
Morning tea 02 12-2015choice broking
 
Morning tea 20 10-2015
Morning tea 20 10-2015Morning tea 20 10-2015
Morning tea 20 10-2015choice broking
 
Morning Tea 07/09/2015
Morning Tea 07/09/2015Morning Tea 07/09/2015
Morning Tea 07/09/2015choice broking
 
Morning tea 13-11-2015
Morning tea 13-11-2015Morning tea 13-11-2015
Morning tea 13-11-2015choice broking
 
NTPC Ltd.Q2FY Result Update
NTPC Ltd.Q2FY Result UpdateNTPC Ltd.Q2FY Result Update
NTPC Ltd.Q2FY Result Updatechoice broking
 

Viewers also liked (18)

Akzo Nobel India- Result Analysis Q2FY16
Akzo Nobel India- Result Analysis Q2FY16Akzo Nobel India- Result Analysis Q2FY16
Akzo Nobel India- Result Analysis Q2FY16
 
Choice - Morning Tea
Choice - Morning TeaChoice - Morning Tea
Choice - Morning Tea
 
Coal India Ltd. Q2 FY16 Result Update
Coal India Ltd. Q2 FY16 Result UpdateCoal India Ltd. Q2 FY16 Result Update
Coal India Ltd. Q2 FY16 Result Update
 
Choice - Morning Tea
Choice - Morning TeaChoice - Morning Tea
Choice - Morning Tea
 
Morning Tea 11-09-15
Morning Tea 11-09-15Morning Tea 11-09-15
Morning Tea 11-09-15
 
Morning Tea 28.08.15
Morning Tea 28.08.15Morning Tea 28.08.15
Morning Tea 28.08.15
 
Choice - Morning Tea
Choice - Morning TeaChoice - Morning Tea
Choice - Morning Tea
 
Morning tea 02 12-2015
Morning tea 02 12-2015Morning tea 02 12-2015
Morning tea 02 12-2015
 
Morning tea 20 10-2015
Morning tea 20 10-2015Morning tea 20 10-2015
Morning tea 20 10-2015
 
Morning Tea 07/09/2015
Morning Tea 07/09/2015Morning Tea 07/09/2015
Morning Tea 07/09/2015
 
Morning Tea
Morning TeaMorning Tea
Morning Tea
 
Choice - Morning Tea
Choice - Morning TeaChoice - Morning Tea
Choice - Morning Tea
 
Morning tea 13-11-2015
Morning tea 13-11-2015Morning tea 13-11-2015
Morning tea 13-11-2015
 
Choice - Morning Tea
Choice - Morning TeaChoice - Morning Tea
Choice - Morning Tea
 
NTPC Ltd.Q2FY Result Update
NTPC Ltd.Q2FY Result UpdateNTPC Ltd.Q2FY Result Update
NTPC Ltd.Q2FY Result Update
 
Eqr210820150828321
Eqr210820150828321Eqr210820150828321
Eqr210820150828321
 
Choice - Morning Tea
Choice - Morning TeaChoice - Morning Tea
Choice - Morning Tea
 
Choice Morning-Tea
Choice Morning-TeaChoice Morning-Tea
Choice Morning-Tea
 

Similar to M&M- Q3FY16 Result Update

M&m ru2 qfy2011-291010
M&m ru2 qfy2011-291010M&m ru2 qfy2011-291010
M&m ru2 qfy2011-291010Angel Broking
 
Strategic Analysis of TATA Motors with emphasison JLR acquisition
Strategic Analysis of TATA Motors with emphasison JLR acquisitionStrategic Analysis of TATA Motors with emphasison JLR acquisition
Strategic Analysis of TATA Motors with emphasison JLR acquisitionSIBASIS MOHAPATRA
 
Choice Broking Research-UltraTech Cement.
 Choice Broking Research-UltraTech Cement. Choice Broking Research-UltraTech Cement.
Choice Broking Research-UltraTech Cement.choice broking
 
Hdfc securities wipro_29_oct_2014
Hdfc securities wipro_29_oct_2014Hdfc securities wipro_29_oct_2014
Hdfc securities wipro_29_oct_2014IndiaNotes.com
 
Automobile sector preview: Likely to post 2.9% revenue growth on weak volumes
Automobile sector preview: Likely to post 2.9% revenue growth on weak volumesAutomobile sector preview: Likely to post 2.9% revenue growth on weak volumes
Automobile sector preview: Likely to post 2.9% revenue growth on weak volumesIndiaNotes.com
 
MAHINDRA AND MAHINDRA FINANCIAL MANAGEMENT REPORT
MAHINDRA AND MAHINDRA FINANCIAL MANAGEMENT REPORTMAHINDRA AND MAHINDRA FINANCIAL MANAGEMENT REPORT
MAHINDRA AND MAHINDRA FINANCIAL MANAGEMENT REPORTSagarDuttPhuloria
 
Bajaj Auto: Margins disappoint as discover woes continue
Bajaj Auto: Margins disappoint as discover woes continueBajaj Auto: Margins disappoint as discover woes continue
Bajaj Auto: Margins disappoint as discover woes continueIndiaNotes.com
 
Mahindra Finance (Analysing the Historical Financial Statement)
Mahindra Finance (Analysing the Historical Financial Statement)Mahindra Finance (Analysing the Historical Financial Statement)
Mahindra Finance (Analysing the Historical Financial Statement)Sumit Kumar Singh
 
Ashok leyland valuation
Ashok leyland valuationAshok leyland valuation
Ashok leyland valuationR S Raghav
 
Grasim Industries reports improved performance in Q1FY16
Grasim Industries reports improved performance in Q1FY16Grasim Industries reports improved performance in Q1FY16
Grasim Industries reports improved performance in Q1FY16IndiaNotes.com
 
Analysis of indian two wheeler industry 2014
Analysis of indian two wheeler industry 2014Analysis of indian two wheeler industry 2014
Analysis of indian two wheeler industry 2014Prateek Dixit
 
Commodity price of Gold, Sliver, Copper, doller/Rs and many more. Narnolia Se...
Commodity price of Gold, Sliver, Copper, doller/Rs and many more. Narnolia Se...Commodity price of Gold, Sliver, Copper, doller/Rs and many more. Narnolia Se...
Commodity price of Gold, Sliver, Copper, doller/Rs and many more. Narnolia Se...NARNOLIA SECURITIES LIMITED
 
19ReviewofAutomotiveMissionPlan2006-2016
19ReviewofAutomotiveMissionPlan2006-201619ReviewofAutomotiveMissionPlan2006-2016
19ReviewofAutomotiveMissionPlan2006-2016Hemal Thakkar
 
concor research report
concor research reportconcor research report
concor research reportSWAROOP PANDAO
 
Ashok Leyland Fundamental Report by swastika Investmart
Ashok Leyland Fundamental Report by swastika InvestmartAshok Leyland Fundamental Report by swastika Investmart
Ashok Leyland Fundamental Report by swastika InvestmartSwastika Investmart
 
Ashok Leyland Fundamental Report by swastika Investmart
Ashok Leyland Fundamental Report by swastika InvestmartAshok Leyland Fundamental Report by swastika Investmart
Ashok Leyland Fundamental Report by swastika Investmartkailash soni
 
Tata-Motors-Investor-presentation-Q2-FY24-1.pdf
Tata-Motors-Investor-presentation-Q2-FY24-1.pdfTata-Motors-Investor-presentation-Q2-FY24-1.pdf
Tata-Motors-Investor-presentation-Q2-FY24-1.pdfYASHBANGADKAR
 
tata-motors-group-investor-day-presentation (1).pdf
tata-motors-group-investor-day-presentation (1).pdftata-motors-group-investor-day-presentation (1).pdf
tata-motors-group-investor-day-presentation (1).pdfRAJEEVSHABOTRA
 
tata-motors-group-investor-day-presentation (1).pdf
tata-motors-group-investor-day-presentation (1).pdftata-motors-group-investor-day-presentation (1).pdf
tata-motors-group-investor-day-presentation (1).pdfRAJEEVSHABOTRA
 

Similar to M&M- Q3FY16 Result Update (20)

M&m ru2 qfy2011-291010
M&m ru2 qfy2011-291010M&m ru2 qfy2011-291010
M&m ru2 qfy2011-291010
 
Strategic Analysis of TATA Motors with emphasison JLR acquisition
Strategic Analysis of TATA Motors with emphasison JLR acquisitionStrategic Analysis of TATA Motors with emphasison JLR acquisition
Strategic Analysis of TATA Motors with emphasison JLR acquisition
 
Choice Broking Research-UltraTech Cement.
 Choice Broking Research-UltraTech Cement. Choice Broking Research-UltraTech Cement.
Choice Broking Research-UltraTech Cement.
 
Hdfc securities wipro_29_oct_2014
Hdfc securities wipro_29_oct_2014Hdfc securities wipro_29_oct_2014
Hdfc securities wipro_29_oct_2014
 
Automobile sector preview: Likely to post 2.9% revenue growth on weak volumes
Automobile sector preview: Likely to post 2.9% revenue growth on weak volumesAutomobile sector preview: Likely to post 2.9% revenue growth on weak volumes
Automobile sector preview: Likely to post 2.9% revenue growth on weak volumes
 
MAHINDRA AND MAHINDRA FINANCIAL MANAGEMENT REPORT
MAHINDRA AND MAHINDRA FINANCIAL MANAGEMENT REPORTMAHINDRA AND MAHINDRA FINANCIAL MANAGEMENT REPORT
MAHINDRA AND MAHINDRA FINANCIAL MANAGEMENT REPORT
 
Bajaj Auto: Margins disappoint as discover woes continue
Bajaj Auto: Margins disappoint as discover woes continueBajaj Auto: Margins disappoint as discover woes continue
Bajaj Auto: Margins disappoint as discover woes continue
 
Mahindra Finance (Analysing the Historical Financial Statement)
Mahindra Finance (Analysing the Historical Financial Statement)Mahindra Finance (Analysing the Historical Financial Statement)
Mahindra Finance (Analysing the Historical Financial Statement)
 
Ashok leyland valuation
Ashok leyland valuationAshok leyland valuation
Ashok leyland valuation
 
Grasim Industries reports improved performance in Q1FY16
Grasim Industries reports improved performance in Q1FY16Grasim Industries reports improved performance in Q1FY16
Grasim Industries reports improved performance in Q1FY16
 
Analysis of indian two wheeler industry 2014
Analysis of indian two wheeler industry 2014Analysis of indian two wheeler industry 2014
Analysis of indian two wheeler industry 2014
 
Commodity price of Gold, Sliver, Copper, doller/Rs and many more. Narnolia Se...
Commodity price of Gold, Sliver, Copper, doller/Rs and many more. Narnolia Se...Commodity price of Gold, Sliver, Copper, doller/Rs and many more. Narnolia Se...
Commodity price of Gold, Sliver, Copper, doller/Rs and many more. Narnolia Se...
 
19ReviewofAutomotiveMissionPlan2006-2016
19ReviewofAutomotiveMissionPlan2006-201619ReviewofAutomotiveMissionPlan2006-2016
19ReviewofAutomotiveMissionPlan2006-2016
 
concor research report
concor research reportconcor research report
concor research report
 
Ashok Leyland Fundamental Report by swastika Investmart
Ashok Leyland Fundamental Report by swastika InvestmartAshok Leyland Fundamental Report by swastika Investmart
Ashok Leyland Fundamental Report by swastika Investmart
 
Ashok Leyland Fundamental Report by swastika Investmart
Ashok Leyland Fundamental Report by swastika InvestmartAshok Leyland Fundamental Report by swastika Investmart
Ashok Leyland Fundamental Report by swastika Investmart
 
Tata-Motors-Investor-presentation-Q2-FY24-1.pdf
Tata-Motors-Investor-presentation-Q2-FY24-1.pdfTata-Motors-Investor-presentation-Q2-FY24-1.pdf
Tata-Motors-Investor-presentation-Q2-FY24-1.pdf
 
tata-motors-group-investor-day-presentation (1).pdf
tata-motors-group-investor-day-presentation (1).pdftata-motors-group-investor-day-presentation (1).pdf
tata-motors-group-investor-day-presentation (1).pdf
 
tata-motors-group-investor-day-presentation (1).pdf
tata-motors-group-investor-day-presentation (1).pdftata-motors-group-investor-day-presentation (1).pdf
tata-motors-group-investor-day-presentation (1).pdf
 
India Auto Sector
India Auto SectorIndia Auto Sector
India Auto Sector
 

Recently uploaded

VIP Call Girls Service Begumpet Hyderabad Call +91-8250192130
VIP Call Girls Service Begumpet Hyderabad Call +91-8250192130VIP Call Girls Service Begumpet Hyderabad Call +91-8250192130
VIP Call Girls Service Begumpet Hyderabad Call +91-8250192130Suhani Kapoor
 
SBP-Market-Operations and market managment
SBP-Market-Operations and market managmentSBP-Market-Operations and market managment
SBP-Market-Operations and market managmentfactical
 
Log your LOA pain with Pension Lab's brilliant campaign
Log your LOA pain with Pension Lab's brilliant campaignLog your LOA pain with Pension Lab's brilliant campaign
Log your LOA pain with Pension Lab's brilliant campaignHenry Tapper
 
Financial institutions facilitate financing, economic transactions, issue fun...
Financial institutions facilitate financing, economic transactions, issue fun...Financial institutions facilitate financing, economic transactions, issue fun...
Financial institutions facilitate financing, economic transactions, issue fun...Avanish Goel
 
High Class Call Girls Nashik Maya 7001305949 Independent Escort Service Nashik
High Class Call Girls Nashik Maya 7001305949 Independent Escort Service NashikHigh Class Call Girls Nashik Maya 7001305949 Independent Escort Service Nashik
High Class Call Girls Nashik Maya 7001305949 Independent Escort Service NashikCall Girls in Nagpur High Profile
 
Independent Lucknow Call Girls 8923113531WhatsApp Lucknow Call Girls make you...
Independent Lucknow Call Girls 8923113531WhatsApp Lucknow Call Girls make you...Independent Lucknow Call Girls 8923113531WhatsApp Lucknow Call Girls make you...
Independent Lucknow Call Girls 8923113531WhatsApp Lucknow Call Girls make you...makika9823
 
letter-from-the-chair-to-the-fca-relating-to-british-steel-pensions-scheme-15...
letter-from-the-chair-to-the-fca-relating-to-british-steel-pensions-scheme-15...letter-from-the-chair-to-the-fca-relating-to-british-steel-pensions-scheme-15...
letter-from-the-chair-to-the-fca-relating-to-british-steel-pensions-scheme-15...Henry Tapper
 
High Class Call Girls Nagpur Grishma Call 7001035870 Meet With Nagpur Escorts
High Class Call Girls Nagpur Grishma Call 7001035870 Meet With Nagpur EscortsHigh Class Call Girls Nagpur Grishma Call 7001035870 Meet With Nagpur Escorts
High Class Call Girls Nagpur Grishma Call 7001035870 Meet With Nagpur Escortsranjana rawat
 
How Automation is Driving Efficiency Through the Last Mile of Reporting
How Automation is Driving Efficiency Through the Last Mile of ReportingHow Automation is Driving Efficiency Through the Last Mile of Reporting
How Automation is Driving Efficiency Through the Last Mile of ReportingAggregage
 
Vip B Aizawl Call Girls #9907093804 Contact Number Escorts Service Aizawl
Vip B Aizawl Call Girls #9907093804 Contact Number Escorts Service AizawlVip B Aizawl Call Girls #9907093804 Contact Number Escorts Service Aizawl
Vip B Aizawl Call Girls #9907093804 Contact Number Escorts Service Aizawlmakika9823
 
VIP Call Girls LB Nagar ( Hyderabad ) Phone 8250192130 | ₹5k To 25k With Room...
VIP Call Girls LB Nagar ( Hyderabad ) Phone 8250192130 | ₹5k To 25k With Room...VIP Call Girls LB Nagar ( Hyderabad ) Phone 8250192130 | ₹5k To 25k With Room...
VIP Call Girls LB Nagar ( Hyderabad ) Phone 8250192130 | ₹5k To 25k With Room...Suhani Kapoor
 
20240417-Calibre-April-2024-Investor-Presentation.pdf
20240417-Calibre-April-2024-Investor-Presentation.pdf20240417-Calibre-April-2024-Investor-Presentation.pdf
20240417-Calibre-April-2024-Investor-Presentation.pdfAdnet Communications
 
(办理学位证)加拿大萨省大学毕业证成绩单原版一比一
(办理学位证)加拿大萨省大学毕业证成绩单原版一比一(办理学位证)加拿大萨省大学毕业证成绩单原版一比一
(办理学位证)加拿大萨省大学毕业证成绩单原版一比一S SDS
 
(DIYA) Bhumkar Chowk Call Girls Just Call 7001035870 [ Cash on Delivery ] Pun...
(DIYA) Bhumkar Chowk Call Girls Just Call 7001035870 [ Cash on Delivery ] Pun...(DIYA) Bhumkar Chowk Call Girls Just Call 7001035870 [ Cash on Delivery ] Pun...
(DIYA) Bhumkar Chowk Call Girls Just Call 7001035870 [ Cash on Delivery ] Pun...ranjana rawat
 
VIP High Class Call Girls Saharanpur Anushka 8250192130 Independent Escort Se...
VIP High Class Call Girls Saharanpur Anushka 8250192130 Independent Escort Se...VIP High Class Call Girls Saharanpur Anushka 8250192130 Independent Escort Se...
VIP High Class Call Girls Saharanpur Anushka 8250192130 Independent Escort Se...Suhani Kapoor
 
Attachment Of Assets......................
Attachment Of Assets......................Attachment Of Assets......................
Attachment Of Assets......................AmanBajaj36
 
Chapter 2.ppt of macroeconomics by mankiw 9th edition
Chapter 2.ppt of macroeconomics by mankiw 9th editionChapter 2.ppt of macroeconomics by mankiw 9th edition
Chapter 2.ppt of macroeconomics by mankiw 9th editionMuhammadHusnain82237
 
Quantitative Analysis of Retail Sector Companies
Quantitative Analysis of Retail Sector CompaniesQuantitative Analysis of Retail Sector Companies
Quantitative Analysis of Retail Sector Companiesprashantbhati354
 

Recently uploaded (20)

VIP Call Girls Service Begumpet Hyderabad Call +91-8250192130
VIP Call Girls Service Begumpet Hyderabad Call +91-8250192130VIP Call Girls Service Begumpet Hyderabad Call +91-8250192130
VIP Call Girls Service Begumpet Hyderabad Call +91-8250192130
 
SBP-Market-Operations and market managment
SBP-Market-Operations and market managmentSBP-Market-Operations and market managment
SBP-Market-Operations and market managment
 
Log your LOA pain with Pension Lab's brilliant campaign
Log your LOA pain with Pension Lab's brilliant campaignLog your LOA pain with Pension Lab's brilliant campaign
Log your LOA pain with Pension Lab's brilliant campaign
 
Financial institutions facilitate financing, economic transactions, issue fun...
Financial institutions facilitate financing, economic transactions, issue fun...Financial institutions facilitate financing, economic transactions, issue fun...
Financial institutions facilitate financing, economic transactions, issue fun...
 
High Class Call Girls Nashik Maya 7001305949 Independent Escort Service Nashik
High Class Call Girls Nashik Maya 7001305949 Independent Escort Service NashikHigh Class Call Girls Nashik Maya 7001305949 Independent Escort Service Nashik
High Class Call Girls Nashik Maya 7001305949 Independent Escort Service Nashik
 
Independent Lucknow Call Girls 8923113531WhatsApp Lucknow Call Girls make you...
Independent Lucknow Call Girls 8923113531WhatsApp Lucknow Call Girls make you...Independent Lucknow Call Girls 8923113531WhatsApp Lucknow Call Girls make you...
Independent Lucknow Call Girls 8923113531WhatsApp Lucknow Call Girls make you...
 
letter-from-the-chair-to-the-fca-relating-to-british-steel-pensions-scheme-15...
letter-from-the-chair-to-the-fca-relating-to-british-steel-pensions-scheme-15...letter-from-the-chair-to-the-fca-relating-to-british-steel-pensions-scheme-15...
letter-from-the-chair-to-the-fca-relating-to-british-steel-pensions-scheme-15...
 
High Class Call Girls Nagpur Grishma Call 7001035870 Meet With Nagpur Escorts
High Class Call Girls Nagpur Grishma Call 7001035870 Meet With Nagpur EscortsHigh Class Call Girls Nagpur Grishma Call 7001035870 Meet With Nagpur Escorts
High Class Call Girls Nagpur Grishma Call 7001035870 Meet With Nagpur Escorts
 
How Automation is Driving Efficiency Through the Last Mile of Reporting
How Automation is Driving Efficiency Through the Last Mile of ReportingHow Automation is Driving Efficiency Through the Last Mile of Reporting
How Automation is Driving Efficiency Through the Last Mile of Reporting
 
Vip B Aizawl Call Girls #9907093804 Contact Number Escorts Service Aizawl
Vip B Aizawl Call Girls #9907093804 Contact Number Escorts Service AizawlVip B Aizawl Call Girls #9907093804 Contact Number Escorts Service Aizawl
Vip B Aizawl Call Girls #9907093804 Contact Number Escorts Service Aizawl
 
VIP Call Girls LB Nagar ( Hyderabad ) Phone 8250192130 | ₹5k To 25k With Room...
VIP Call Girls LB Nagar ( Hyderabad ) Phone 8250192130 | ₹5k To 25k With Room...VIP Call Girls LB Nagar ( Hyderabad ) Phone 8250192130 | ₹5k To 25k With Room...
VIP Call Girls LB Nagar ( Hyderabad ) Phone 8250192130 | ₹5k To 25k With Room...
 
20240417-Calibre-April-2024-Investor-Presentation.pdf
20240417-Calibre-April-2024-Investor-Presentation.pdf20240417-Calibre-April-2024-Investor-Presentation.pdf
20240417-Calibre-April-2024-Investor-Presentation.pdf
 
(办理学位证)加拿大萨省大学毕业证成绩单原版一比一
(办理学位证)加拿大萨省大学毕业证成绩单原版一比一(办理学位证)加拿大萨省大学毕业证成绩单原版一比一
(办理学位证)加拿大萨省大学毕业证成绩单原版一比一
 
(DIYA) Bhumkar Chowk Call Girls Just Call 7001035870 [ Cash on Delivery ] Pun...
(DIYA) Bhumkar Chowk Call Girls Just Call 7001035870 [ Cash on Delivery ] Pun...(DIYA) Bhumkar Chowk Call Girls Just Call 7001035870 [ Cash on Delivery ] Pun...
(DIYA) Bhumkar Chowk Call Girls Just Call 7001035870 [ Cash on Delivery ] Pun...
 
VIP High Class Call Girls Saharanpur Anushka 8250192130 Independent Escort Se...
VIP High Class Call Girls Saharanpur Anushka 8250192130 Independent Escort Se...VIP High Class Call Girls Saharanpur Anushka 8250192130 Independent Escort Se...
VIP High Class Call Girls Saharanpur Anushka 8250192130 Independent Escort Se...
 
Attachment Of Assets......................
Attachment Of Assets......................Attachment Of Assets......................
Attachment Of Assets......................
 
Chapter 2.ppt of macroeconomics by mankiw 9th edition
Chapter 2.ppt of macroeconomics by mankiw 9th editionChapter 2.ppt of macroeconomics by mankiw 9th edition
Chapter 2.ppt of macroeconomics by mankiw 9th edition
 
🔝+919953056974 🔝young Delhi Escort service Pusa Road
🔝+919953056974 🔝young Delhi Escort service Pusa Road🔝+919953056974 🔝young Delhi Escort service Pusa Road
🔝+919953056974 🔝young Delhi Escort service Pusa Road
 
Quantitative Analysis of Retail Sector Companies
Quantitative Analysis of Retail Sector CompaniesQuantitative Analysis of Retail Sector Companies
Quantitative Analysis of Retail Sector Companies
 
🔝9953056974 🔝Call Girls In Dwarka Escort Service Delhi NCR
🔝9953056974 🔝Call Girls In Dwarka Escort Service Delhi NCR🔝9953056974 🔝Call Girls In Dwarka Escort Service Delhi NCR
🔝9953056974 🔝Call Girls In Dwarka Escort Service Delhi NCR
 

M&M- Q3FY16 Result Update

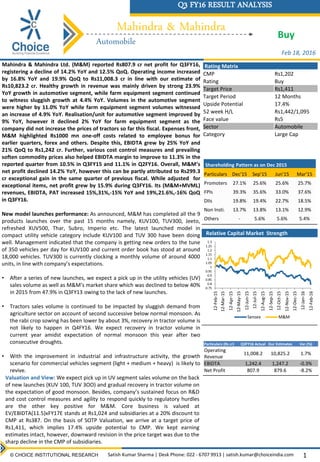
  • 1. Mahindra & Mahindra Automobile Q3 FY16 RESULT ANALYSIS Buy Relative Capital Market Strength Mahindra & Mahindra Ltd. (M&M) reported Rs807.9 cr net profit for Q3FY16, registering a decline of 14.2% YoY and 12.5% QoQ. Operating income increased by 16.8% YoY and 19.9% QoQ to Rs11,008.3 cr in line with our estimate of Rs10,823.2 cr. Healthy growth in revenue was mainly driven by strong 23.9% YoY growth in automotive segment, while farm equipment segment continued to witness sluggish growth at 4.4% YoY. Volumes in the automotive segment were higher by 11.0% YoY while farm equipment segment volumes witnessed an increase of 4.9% YoY. Realisation/unit for automotive segment improved by 9% YoY, however it declined 2% YoY for farm equipment segment as the company did not increase the prices of tractors so far this fiscal. Expenses front, M&M highlighted Rs1000 mn one-off costs related to employee bonus for earlier quarters, forex and others. Despite this, EBIDTA grew by 25% YoY and 21% QoQ to Rs1,242 cr. Further, various cost control measures and prevailing soften commodity prices also helped EBIDTA margin to improve to 11.3% in the reported quarter from 10.5% in Q3FY15 and 11.1% in Q2FY16. Overall, M&M’s net profit declined 14.2% YoY, however this can be partly attributed to Rs299.3 cr exceptional gain in the same quarter of previous fiscal. While adjusted for exceptional items, net profit grew by 15.9% during Q3FY16. Its (M&M+MVML) revenues, EBIDTA, PAT increased 15%,31%,-15% YoY and 19%,21.6%,-16% QoQ in Q3FY16. New model launches performance: As announced, M&M has completed all the 9 products launches over the past 15 months namely, KUV100, TUV300, Jeeto, refreshed XUV500, Thar, Subro, Imperio etc. The latest launched model in compact utility vehicle category include KUV100 and TUV 300 have been doing well. Management indicated that the company is getting new orders to the tune of 350 vehicles per day for KUV100 and current order book has stood at around 18,000 vehicles. TUV300 is currently clocking a monthly volume of around 4000 units, in line with company’s expectations. • After a series of new launches, we expect a pick up in the utility vehicles (UV) sales volume as well as M&M’s market share which was declined to below 40% in 2015 from 47.9% in Q3FY13 owing to the lack of new launches. • Tractors sales volume is continued to be impacted by sluggish demand from agriculture sector on account of second successive below normal monsoon. As the rabi crop sowing has been lower by about 3%, recovery in tractor volume is not likely to happen in Q4FY16. We expect recovery in tractor volume in current year amidst expectation of normal monsoon this year after two consecutive droughts. • With the improvement in industrial and infrastructure activity, the growth scenario for commercial vehicles segment (light + medium + heavy) is likely to revive. 1 Feb 18, 2016 Rating Matrix CMP Rs1,202 Rating Buy Target Price Rs1,411 Target Period 12 Months Upside Potential 17.4% 52 week H/L Rs1,442/1,095 Face value Rs5 Sector Automobile Category Large Cap © CHOICE INSTITUTIONAL RESEARCH Satish Kumar Sharma | Desk Phone: 022 - 6707 9913 | satish.kumar@choiceindia.com Particulars (Rs cr) Q3FY16 Actual Our Estimates Var.(%) Operating Revenue 11,008.2 10,825.2 1.7% EBIDTA 1,242.4 1,247.2 -0.3% Net Profit 807.9 879.6 -8.2% Shareholding Pattern as on Dec 2015 Particulars Dec'15 Sep'15 Jun'15 Mar'15 Promoters 27.1% 25.6% 25.6% 25.7% FPIs 39.3% 35.6% 33.0% 37.6% DIIs 19.8% 19.4% 22.7% 18.5% Non Insti. 13.7% 13.8% 13.1% 12.9% Others - 5.6% 5.6% 5.4% 0.75 0.8 0.85 0.9 0.95 1 1.05 1.1 1.15 1.2 1.25 1.3 12-Feb-15 12-Mar-15 12-Apr-15 12-May-15 12-Jun-15 12-Jul-15 12-Aug-15 12-Sep-15 12-Oct-15 12-Nov-15 12-Dec-15 12-Jan-16 12-Feb-16 Sensex M&M Valuation and View: We expect pick up in UV segment sales volume on the back of new launches (KUV 100, TUV 3OO) and gradual recovery in tractor volume on the expectation of good monsoon. Besides, company’s sustained focus on R&D and cost control measures and agility to respond quickly to regulatory hurdles are the other key positive for M&M. Core business is valued at EV/EBIDTA(11.5)xFY17E stands at Rs1,024 and subsidiaries at a 20% discount to CMP at Rs387. On the basis of SOTP Valuation, we arrive at a target price of Rs1,411, which implies 17.4% upside potential to CMP. We kept earning estimates intact, however, downward revision in the price target was due to the sharp decline in the CMP of subsidiaries.
  • 2. 2 Source: Choice Broking, Company data Key Financials (M&M Standalone) © CHOICE INSTITUTIONAL RESEARCH Mahindra & Mahindra Automobile Particulars (Rs cr) Q3FY16 Q3FY15 YoY Q2FY16 QoQ Operating Income 11,008.3 9,427.3 16.8% 9,245.6 19.1% Operating Expenditure 9,765.9 8,433.0 15.8% 8,219.2 18.8% EBIDTA 1,242.4 994.3 25.0% 1,026.4 21.0% EBIDTA Margin 11.3% 10.5% 11.1% Depreciation/Amortisation 295.9 234.4 26.2% 250.0 18.4% Other Income 10,061.8 8,667.4 16.1% 8,469.2 18.8% Finance Costs 88.6 84.3 5.1% 485.4 -81.7% Tax 39.7 43.5 -8.7% 38.1 4.1% Minority Interest 250.2 157.9 58.5% 300.0 -16.6% Exceptional Items 62.8 299.3 - - Net Profit 807.9 942.1 -14.2% 923.7 -12.5% NPM 7.3% 10.0% 10.0% EPS Diluted 13.0 15.2 -14.2% 13.7 -5.0% Segment Wise Revenue Particulars (Rs cr) Q3FY16 Q3FY15 YoY Q2FY16 QoQ Automotive Segment 7,428.0 5,995.9 23.9% 6,404.0 16.0% Farm Equipment Segment 3,583.3 3,431.6 4.4% 2,844.2 26.0% Segmental details Q3FY15 Q4FY15 Q1FY16 Q2FY16 Q3FY16 Farm Equipment Tractor (Units) 59,714 38,604 62,358 45,246 62,666 Net Sales (Rs cr) 3,472 2,535 3,572 2,844 3,583 Realisation/unit 581,472 656,694 572,854 628,608 571,809 Automotive Volume (units) 113,400 123,175 109,567 113,132 125,918 Net Sales (Rs cr) 6,111 7,023 6,260 6,404 7,428 Realisation/unit 538,877 570,134 571,334 566,064 589,908 1.5% 6.9% -9.2% -13.1% -3.4% -1.80% 16.8% -15.0% -10.0% -5.0% 0.0% 5.0% 10.0% 15.0% 20.0% 0.0 2,000.0 4,000.0 6,000.0 8,000.0 10,000.0 12,000.0 Rscr Operating Income Trend Operating Income Growth (YoY) 0 50,000 100,000 150,000 200,000 Volume Turnover Tractor (Units) Auto Volume (units)
  • 3. 3 Source: Choice Broking, Company data © CHOICE INSTITUTIONAL RESEARCH Automobile Mahindra & Mahindra Purchase of Finished Goods, 24.7% Cost of Services & Raw Materials, 42.7% Operating & Manf. Exp. , 10.5% Employee Cost, 5.8% Operating Expenditure/Sales (Q3FY16) Purchase of Finished Goods 17.6% Cost of Services & Raw Materials 49.9% Operating & Manf. Exp. 10% Employee Cost 6.5% Operating Expenditure/Sales (Q3FY15) 12.5% 10.6% 10.5% 9.4% 12.7% 11.1% 11.3% 0.0% 3.0% 6.0% 9.0% 12.0% 15.0% 0.0 1,000.0 2,000.0 Rscr EBIDTA Margins improves in Q3FY16 EBIDTA EBIDTA Margin 881.8 946.6 942.1 550.6 852.2 923.7 807.9 8.7% 9.9% 10.0% 5.8% 8.7% 10% 7.3% 0.0% 2.0% 4.0% 6.0% 8.0% 10.0% 12.0% 0.0 200.0 400.0 600.0 800.0 1000.0 Rscr Q3FY16 PAT stands at Rs807.9 cr PAT NPM Conference Call – Key Takeaways:  The company has completed all the 9 product launches in the current year, as announced earlier. The full impact of the new launches would be reflected in the financials of FY17.  The new launches,TUV300 and KUV100 – have done well. TUV300 is currently clocking a monthly volume of around 4000, in line with company’s expectations.  KUV100 has current order book of around 18000 vehicles. The company has been receiving new orders to the tune of 350 vehicles per day. The company would be continuing with the current capacity level of 5000 per month till August 2016; thereafter, the capacity could be increased to 7500 per month.  Currently 45% of KUV100 sold is of petrol version.  The company has effected an increase of 1.7% in selling price YTD.  The Minimum Import Price on steel is not expected to have much impact on company’s cost structure.  There has been no increase in selling price of tractors during the current year.  The company has maintained its leadership position in Pick-up segment (2 to 3.5T) with 70% market share.
  • 4. 4 Source: Choice Broking, Company data © CHOICE INSTITUTIONAL RESEARCH Automobile Improving Demand Scenario of Automobile Industry The demand scenario of Indian Automobile Industry is gradually reviving after witnessing slowdown over the past two fiscals driven by improving economic scenario. Improvement in industrial and infrastructure activity is gaining momentum on the back of key initiatives taken by the new government, while the low inflation has driven RBI to cut interest rate by 125 basis points since January 2015. Prevailing low commodity prices coupled with a decline in fuel prices has augured well for the Indian automobile industry. We expect a strong recovery in industry demand in near future driven by thrust of government given for infrastructure development, easing interest rate in the economy and increase in income levels and lifestyle aspirations. We expect pick up in UV segment sales volume on the back of new launches (KUV 100, TUV 3OO) and gradual recovery in tractor volume on the expectation of good monsoon. Besides, company’s sustained focus on R&D and cost control measures and agility to respond quickly to regulatory hurdles are the other key positive for M&M. Core business is valued at EV/EBIDTA(11.5)x of FY17E stands at Rs1,024 and subsidiaries at a 20% discount to CMP at Rs387. On the basis of SOTP Valuation, we arrive at target price of Rs1,411, which implies 17.4% upside potential to CMP. We kept earning estimates intact, however, downward revision in the price target was due to the sharp decline in the CMP of subsidiaries. SOTP Valuation Value/ share (Rs) Value for core business (M&M+MVML) EV/EBIDTA(11.5)x of FY17E 1,024 Total subsidiaries’ value after 20% discount to CMP 387 Target Price (Rs) 1,411 Mahindra & Mahindra Relative Valuation Companies (Rs) CMP 6M R(%) 12M R(%) M. Cap Rs mn EPS BVPS EBIDTA Margin (%) NPM (%) Atul Auto Ltd. 482 15.8% -15.1% 10,796.8 20.2 53.9 14.2% 8.7% Escorts Ltd. 120 -24.1% -2.8% 14,278.2 7.2 147.6 4.1% 2.5% Force Motors Ltd. 2,349 -15.2% 78.8% 30,950.9 115.3 999.2 8.0% 5.4% Mahindra & Mahindra Ltd. 1,204 -12.5% -0.3% 712,938.0 53.0 323.3 11.3% 8.0% Maruti Suzuki India Ltd. 3,706 -19.1% 3.7% 1,119,538.7 156.3 784.7 16.1% 8.6% Tata Motors Ltd. 301 -15.3% -47.0% 1,022,165.9 22.3 165.6 13.0% 2.9% Average 1,360.3 -11.7% 2.9% 485,111.4 62.4 412.4 11.1% 6.0% Companies (Rs mn) P/E (x) P/Bv (x) P/Sales(x) EV/EBIDTA (x) D/E PAT (TTM) EBIDTA (TTM) Sales (TTM) Atul Auto Ltd. 23.9 8.9 2.1 14.2 0.0 451.7 738.8 5,206.8 Escorts Ltd. 16.7 0.8 0.4 11.7 0.3 857.2 1,432.1 34,665.0 Force Motors Ltd. 20.4 2.4 1.1 12.4 0.0 1,519.6 2,261.6 28,244.0 Mahindra & Mahindra Ltd. 22.7 3.7 1.8 16.5 0.2 31,343.1 44,217.7 391,417.5 Maruti Suzuki India Ltd. 23.7 4.7 2.0 12.8 0.0 47,220.2 87,928.5 546,933.8 Tata Motors Ltd. 13.5 1.8 0.4 4.3 1.3 75,631.9 338,073.6 2,600,177.1 Average 20.1 3.7 1.3 12.0 0.3 26,170.6 79,108.7 601,107.4
  • 5. 5 Source: Choice Broking, Company data © CHOICE INSTITUTIONAL RESEARCH Automobile Profit And Loss Statement Balance Sheet Particulars (Rs cr) FY14 FY15 FY16E FY17E Net Sales 40,508.5 38,945.4 41,598.3 47,286.7 % Growth 0.2% -3.9% 6.8% 13.7% Total Revenue 41,226.5 39,794.3 42,412.8 48,279.8 % Growth 0.5% -3.5% 6.6% 13.8% Staff Costs 2,163.7 2,317.0 2,037.7 2,225.1 % of Net Sales 5.3% 5.9% 4.9% 4.7% Other Manufacturing/Operating costs 32,033.4 31,155.1 33,434.7 38,014.0 % of Net Sales 79.1% 80.0% 80.4% 80.4% Other Expenses 1,590.1 1,300.0 1,333.3 1,499.3 % of Net Sales 3.9% 3.3% 3.2% 3.2% Total Operating Expenditures 35,787.3 34,772.1 36,805.7 41,738.4 % of Net Sales 88.3% 89.3% 88.5% 88.3% EBITDA 4,721.2 4,173.3 4,792.5 5,548.4 EBITDA Margin % 11.7% 10.7% 11.5% 11.7% Growth % 0.6% -11.6% 14.8% 15.8% Depreciation & Amortisation 863.3 974.9 984.5 1,090.4 EBIT 3,857.9 3,198.4 3,808.0 4,458.0 Financial Charges 259.2 214.3 289.6 299.6 Other Income 718.0 848.9 814.6 993.1 Exceptional Income / Expenses 52.8 335.7 0.0 0.0 PBT 4,369.4 4,168.8 4,333.0 5,151.4 Pre-tax Margin % 10.8% 10.7% 10.4% 10.9% Tax 611.1 847.8 953.3 1,133.3 Effective Tax Rate % 14.0% 20.3% 22.0% 22.0% Reported PAT 3,758.4 3,321.0 3,379.8 4,018.1 Net Profit Margin % 9.3% 8.5% 8.1% 8.5% Growth in Reported PAT % 12.1% -11.6% 1.8% 18.9% Extrodinary Income 0.0 0.0 0.0 0.0 Adjusted PAT 3,758.4 3,321.0 3,379.8 4,018.1 Shares In Issue 59.0 59.1 59.2 59.2 Adjusted EPS (Basic) 63.7 56.2 57.1 67.9 Growth % 12.1% -11.8% 1.7% 18.8% Dividend paid* 862.3 879.9 867.3 983.2 Dividend pay out ratio 22.9% 26.5% 25.7% 24.5% Net profit transferred to Reserves Acccount 2,896.1 2,441.1 2,512.4 3,034.9 Adjusted PAT incl MVML 3,905.0 3,423.0 3,559.8 4,268.1 Particulars (Rs cr) FY14 FY15 FY16E FY17E Gross Asset 10,796.1 12,354.8 13,739.5 15,796.8 Accumulated Depriciation 4,919.2 5,894.1 6,878.6 7,969.0 Capital WIP 1,228.4 1,647.4 1,722.2 1,957.7 Net Fixed Asset 7,105.4 8,108.1 8,583.1 9,785.5 Investments & Deposits 11,379.8 13,241.6 15,743.0 17,935.0 Current Asset 12,803.4 11,594.8 11,998.3 13,641.0 Cash 2,950.4 2,064.8 2,170.7 2,767.6 Inventories 2,803.6 2,437.6 2,938.6 3,290.6 Trade Debtors 2,509.8 2,558.0 2,462.3 2,861.4 Loans and Advances 4,539.6 4,534.4 4,426.7 4,721.3 Current Liabilities & Provisions 8,766.1 8,868.2 9,434.9 10,567.9 Net Current Asset Excluding Cash 1,087.0 661.8 392.7 305.5 Capital Deployed 22,522.6 24,076.3 26,889.5 30,793.6 Long-term Liabilities and Provisions 5,731.4 4,821.8 5,121.8 5,991.0 Total Non Current Liabilities 5,731.4 4,821.8 5,121.8 5,991.0 Share Capital 295.2 295.7 295.9 295.9 Reserve and Surplus 16,496.0 18,959.4 21,471.8 24,506.7 Total Stock Holder's Equity 16,791.2 19,255.1 21,767.7 24,802.6 Capital Employed 22,522.6 24,076.9 26,889.5 30,793.6 DIFF 0.0 -0.6 0.0 0.0 Mahindra & Mahindra Particulars (Rs cr) FY14 FY15 FY16E FY17E Profit before tax 4369.4 4168.8 4333.0 5151.4 Depreciation 871.3 974.9 984.5 1090.4 Interest Expense 259.2 214.3 289.6 299.6 Operating Profit Before WC Changes 5499.9 5358.0 5607.1 6541.4 Changes In WC -1518.7 425.2 269.1 87.3 Gross cash generated from Operations 3981.2 5783.1 5876.2 6628.7 Direct taxes paid 611.1 847.8 953.3 1133.3 Cash Flow from Operations 3370.1 4935.4 4922.9 5495.4 Capital Expenditure (CAPEX) (2155.3) (1977.6) (1459.5) (2292.8) Investments 453.7 (1861.8) (2501.4) (2192.0) Net Cash Used In Investing Activities (1701.6) (3839.4) (3960.9) (4484.8) Change in Debt 1385.8 (909.7) 300.0 869.2 Change in Equity 0.0 0.5 0.2 0.0 Dividends Paid (862.3) (879.9) (867.3) (983.2) Interest Paid (259.2) (214.3) (289.6) (299.6) Others (763.8) 22.3 0.0 0.0 Net Cash used in Financing Activities (499.5) (1981.0) (856.7) (413.6) Net Increase in Cash and Cash Equivalents 1169.0 (885.1) 105.3 597.0 Cash and cash equivalents At the beginning 1781.4 2950.4 2064.8 2170.7 Net Increase in Cash and Cash Equivalents 1169.0 -885.1 105.3 597.0 Cash and cash equivalents At the end 2950.4 2065.3 2170.1 2767.7 Cash balance as per balance sheet 2950.4 2064.8 2170.7 2767.6 difference 0.0 0.5 -0.6 0.1 Particulars (Rs cr) FY14 FY15 FY16E FY17E Profitability Ratios Return on Assets (ROA) 12.0% 10.1% 9.3% 9.7% Return on Equity (ROE) 22.4% 17.2% 15.5% 16.2% Return on Capital Employed (ROCE) 17.1% 13.3% 14.2% 14.5% Dupont Analysis-ROE Decomposition PAT/PBT (Tax Efficiency) 0.9 0.8 0.8 0.8 PBT/EBIT (Interest Burden) 1.1 1.3 1.1 1.2 EBIT/Sales (OPM) 0.1 0.1 0.1 0.1 Sales/Total Assets (Asset Turnover) 1.3 1.2 1.1 1.1 TA/NW (Financial Leverage) 1.9 1.7 1.7 1.7 ROE 22.4 17.2 15.5 16.2 Liquidity Ratios Current Ratio 1.5 1.3 1.3 1.3 Acid Test Ratio 1.1 1.0 1.0 1.0 Debt-Equity Ratio 0.3 0.3 0.2 0.2 Efficiency Ratios Assets Turnover Ratio 1.3 1.2 1.1 1.1 Working Capital Turnover Ratio 10.0 14.3 16.2 15.4 F.A. Turnover Ratio 5.7 4.8 4.8 4.8 C.A. Turnover Ratio 3.2 3.4 3.5 3.5 Debtors Velocity 22.6 24.0 21.6 22.1 Margin Ratios (%) EBITDA Margin 11.7% 10.7% 11.5% 11.7% Pre-Tax Margin 10.8% 10.7% 10.4% 10.9% Net Profit Margin 9.3% 8.5% 8.1% 8.5% Growth Ratios YoY (%) Net Sales 0.2% -3.9% 6.8% 13.7% EBITDA 0.6% -11.6% 14.8% 15.8% Adj.PAT 12.1% -11.6% 1.8% 18.9% Adj.EPS 12.1% -11.8% 1.7% 18.8% Working Ratios (Days) Inventory 25.3 22.8 25.8 25.4 Debtors 22.6 24.0 21.6 22.1 Net Working Capital Excluding Cash 1087.0 661.8 392.7 305.5 Per Share (Rs.) Adj.EPS 63.7 56.2 54.4 64.7 CEPS 78.3 72.6 70.3 82.3 DPS 14.6 14.9 14.0 15.8 BVPS 284.5 325.6 350.5 399.4 Cash Per Share 50.0 34.9 35.0 44.6 Valuation Parameters P/E 14.3 22.3 22.1 18.6 P/CEPS 11.6 17.2 17.1 14.6 P/BV 3.2 3.8 3.4 3.0 EV/EBIDTA 12.0 18.4 16.2 14.0
  • 6. 6 Disclaimer This is solely for information of clients of Choice Broking and does not construe to be an investment advice. It is also not intended as an offer or solicitation for the purchase and sale of any financial instruments. Any action taken by you on the basis of the information contained herein is your responsibility alone and Choice Broking its subsidiaries or its employees or associates will not be liable in any manner for the consequences of such action taken by you. We have exercised due diligence in checking the correctness and authenticity of the information contained in this recommendation, but Choice Broking or any of its subsidiaries or associates or employees shall not be in any way responsible for any loss or damage that may arise to any person from any inadvertent error in the information contained in this recommendation or any action taken on basis of this information. This report is based on the fundamental analysis with a view to forecast future price. The Research analysts for this report certifies that all of the views expressed in this report accurately reflect his or her personal views about the subject company or companies and its or their securities, and no part of his or her compensation was, is or will be, directly or indirectly related to specific recommendations or views expressed in this report. Choice Broking has based this document on information obtained from sources it believes to be reliable but which it has not independently verified; Choice Broking makes no guarantee, representation or warranty and accepts no responsibility or liability as to its accuracy or completeness. The opinions contained within the report are based upon publicly available information at the time of publication and are subject to change without notice. The information and any disclosures provided herein are in summary form and have been prepared for informational purposes. The recommendations and suggested price levels are intended purely for stock market investment purposes. The recommendations are valid for the day of the report and will remain valid till the target period. The information and any disclosures provided herein may be considered confidential. Any use, distribution, modification, copying, forwarding or disclosure by any person is strictly prohibited. The information and any disclosures provided herein do not constitute a solicitation or offer to purchase or sell any security or other financial product or instrument. The current performance may be unaudited. Past performance does not guarantee future returns. There can be no assurance that investments will achieve any targeted rates of return, and there is no guarantee against the loss of your entire investment. POTENTIAL CONFLICT OF INTEREST DISCLOSURE (as on date of report) Disclosure of interest statement – • Analyst interest of the stock /Instrument(s): - No. • Firm interest of the stock / Instrument (s): - No. Choice Equity Broking Pvt. Ltd. Choice House, Shree Shakambhari Corporate Park, Plt No: -156-158, J.B. Nagar, Andheri (East), Mumbai - 400 099. +91-022-6707 9999 +91-022-6707 9959 www.choiceindia.com Choice’s Rating Rationale The price target for a large cap stock represents the value the analyst expects the stock to reach over next 12 months. For a stock to be classified as Outperform, the expected return must exceed the local risk free return by at least 5% over the next 12 months. For a stock to be classified as Underperform, the stock return must be below the local risk free return by at least 5% over the next 12 months. Stocks between these bands are classified as Neutral. BUY Absolute Return >15% Accumulate Absolute Return Between 10-15% Hold Absolute Return Between 0-10% Reduce Absolute Return 0 To Negative 10% Sell Absolute Return > Negative 10% Coverage History Date Recommendation CMP (Rs) Target Price (Rs) 18-Feb-16 Buy 1,202 1,411 07-Nov-15 Buy 1,248 1,437 12-Aug-15 Hold 1,339 1,441 03-Jun-15 Buy 1,202 1,375 06-Apr-15 Buy 1,200 1,419 Institutional Equity Team Name Designation Email id Contact No. Ajay Kejriwal President ajay@choiceindia.com 022- 6707 9850 Sumeet Bagadia Head of Research sumeet.bagadia@choiceindia.com 022 - 6707 9830 Amit Singh VP - Institutional Sales amit.singh@choiceindia.com 022 - 6707 9852 Devendra Gaikwad Sr. Manager - Institutional Sales devendra.gaikwad@choiceindia.com 022 - 6707 9877 Rajnath Yadav Research Analyst rajnath.yadav@choiceindia.com 022 - 6707 9912 Satish Kumar Research Analyst satish.kumar@choiceindia.com 022 - 6707 9913 Kunal Parmar Research Associate kunal.parmar@choiceindia.com 022 - 6707 9982 Amit Pathania Research Associate amit.pathania@choiceindia.com 022 - 6707 9979 Vikas Chaudhari Research Associate vikas.chaudhari@choiceindia.com 022 - 6707 9988 Trirashmi Ghoderao Research Advisor trirashmi.ghoderao@choiceindia.com 022 - 6707 9972 Neeraj Yadav Research Advisor Neeraj.yadav@choiceindia.com 022 - 6707 9988 Satish Kumar Digitally signed by Satish Kumar DN: cn=Satish Kumar, o=Choice Equity Broking Pvt. Ltd., ou=Research Analyst, email=satish.kumar@choiceindia.com, c=US Date: 2016.02.18 11:02:08 +05'30'