Bright Prospects for a Steep Auto Sector Recovery
•
1 like•122 views

Why Car Sales Will Rise in 2010 Commentary

Recommended
Recommended
More Related Content
Similar to Bright Prospects for a Steep Auto Sector Recovery
Similar to Bright Prospects for a Steep Auto Sector Recovery (20)
More from Ralph Paglia
More from Ralph Paglia (20)
Recently uploaded
Recently uploaded (20)
Bright Prospects for a Steep Auto Sector Recovery
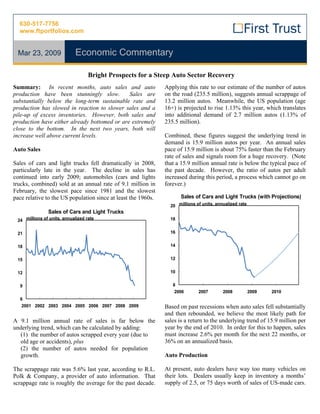
- 1. 630-517-7756 www.ftportfolios.com Mar 23, 2009 Economic Commentary Bright Prospects for a Steep Auto Sector Recovery Summary: In recent months, auto sales and auto Applying this rate to our estimate of the number of autos production have been stunningly slow. Sales are on the road (235.5 million), suggests annual scrappage of substantially below the long-term sustainable rate and 13.2 million autos. Meanwhile, the US population (age production has slowed in reaction to slower sales and a 16+) is projected to rise 1.13% this year, which translates pile-up of excess inventories. However, both sales and into additional demand of 2.7 million autos (1.13% of production have either already bottomed or are extremely 235.5 million). close to the bottom. In the next two years, both will increase well above current levels. Combined, these figures suggest the underlying trend in demand is 15.9 million autos per year. An annual sales Auto Sales pace of 15.9 million is about 75% faster than the February rate of sales and signals room for a huge recovery. (Note Sales of cars and light trucks fell dramatically in 2008, that a 15.9 million annual rate is below the typical pace of particularly late in the year. The decline in sales has the past decade. However, the ratio of autos per adult continued into early 2009; automobiles (cars and lights increased during this period, a process which cannot go on trucks, combined) sold at an annual rate of 9.1 million in forever.) February, the slowest pace since 1981 and the slowest pace relative to the US population since at least the 1960s. Sales of Cars and Light Trucks (with Projections) 20 millions of units, annualized rate Sales of Cars and Light Trucks 24 millions of units, annualized rate 18 21 16 18 14 15 12 12 10 9 8 2006 2007 2008 2009 2010 6 2001 2002 2003 2004 2005 2006 2007 2008 2009 Based on past recessions when auto sales fell substantially and then rebounded, we believe the most likely path for A 9.1 million annual rate of sales is far below the sales is a return to the underlying trend of 15.9 million per underlying trend, which can be calculated by adding: year by the end of 2010. In order for this to happen, sales (1) the number of autos scrapped every year (due to must increase 2.6% per month for the next 22 months, or old age or accidents), plus 36% on an annualized basis. (2) the number of autos needed for population growth. Auto Production The scrappage rate was 5.6% last year, according to R.L. At present, auto dealers have way too many vehicles on Polk & Company, a provider of auto information. That their lots. Dealers usually keep in inventory a months’ scrappage rate is roughly the average for the past decade. supply of 2.5, or 75 days worth of sales of US-made cars.
- 2. For example, if a dealer typically sells 200 cars per month, Second, and more important, will be the increase in sales it keeps 500 cars in inventory. In February, 239,500 US- we forecasted in the previous section. If sales increase as made cars were sold (a 2.9 million annual rate), which we project and assemblies remain at current levels, means dealers should keep inventories of about 600,000. inventories will fall to the norm in 10 months. Instead, they had 1.3 million. That’s 5.4 months of supply, or an excess of 700,000 US-made cars. Finally, as sales increase, the level of inventory dealers are willing to hold will rise. Remember: dealers like to hold 2.5 months worth of sales. So if car sales improve Months' Supply of US-Made Cars and assemblies remain unchanged, inventories will be at months 6 desired levels by the fourth quarter of this year. 5 The problem with this reasoning is that once inventories are reduced to normal levels (2.5 times the rate of sales), 4 auto assemblies would have to increase substantially to prevent inventories from continuing to fall. Cars were assembled at a 1.65 million annual pace in February. By 3 December, the annual assembly rate required to maintain normal inventories would be 3.11 million. 2 The notion that car assemblies are going to stay at current levels through November and then magically and almost 1 instantaneously spike up by 88% at year end is a fantasy. 1997 1999 2001 2003 2005 2007 2009 It’s not going to happen. Automakers are forward- looking. As sales increase they will be able to foresee Three factors should drive down the excess inventory back future declines in inventories and will adjust their to normal levels. First, despite the very slow rate of sales, production schedules accordingly. auto assemblies in the US are already so low that inventories should gradually decline even if sales do not As a result, assemblies are likely to start rising well before improve at all. inventories are back to normal. If sales rise as anticipated and auto dealers are willing to wait until the end of Car Production December 2010 for the inventory correction to run its millions of units, annualized rate 6 course, assemblies can rise 4.8% per month (75% annualized) starting this month. Postponing the rise in 5 assemblies only makes these increases even faster once they begin: the longer the postponement, the faster the increase. 4 The bottom line: the US is setting up for a surprisingly 3 strong rebound in economic growth during the second half of 2009, or sooner. 2 Brian S. Wesbury, Chief Economist 1 Robert Stein, Senior Economist 2001 2002 2003 2004 2005 2006 2007 2008 2009 This report was prepared by First Trust Advisors L. P., and reflects the current opinion of the authors. It is based upon sources and data believed to be accurate and reliable. Opinions and forward looking statements expressed are subject to change without notice. This information does not constitute a solicitation or an offer to buy or sell any security.