Download as PDF, PPTX
![Evaluating global climate models
using simple, explainable
neural networks
@ZLabe
Zachary M. Labe
with Elizabeth A. Barnes
Colorado State University
Department of Atmospheric Science
17 December 2021
NG51A-06 – AGU Fall Meeting
Climate Variability Across Scales and Climate States and
Neural Earth System Modeling [Oral Session I]](https://image.slidesharecdn.com/zlabeaisessionrecording-slides-211207172443/85/Evaluating-global-climate-models-using-simple-explainable-neural-networks-1-320.jpg)
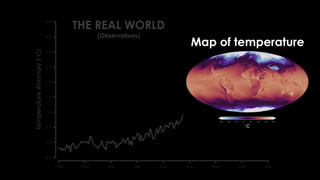
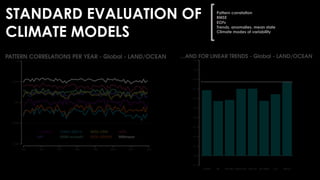
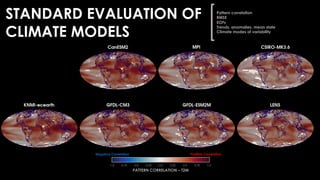
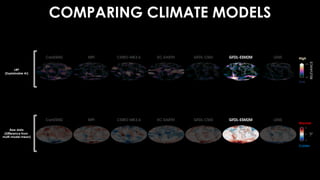
![STANDARD EVALUATION OF
CLIMATE MODELS
Pattern correlation
RMSE
EOFs
Trends, anomalies, mean state
Climate modes of variability
CORRELATION
[R]](https://image.slidesharecdn.com/zlabeaisessionrecording-slides-211207172443/85/Evaluating-global-climate-models-using-simple-explainable-neural-networks-9-320.jpg)
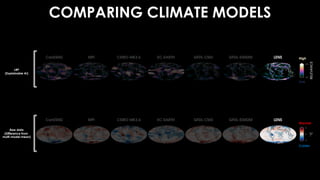
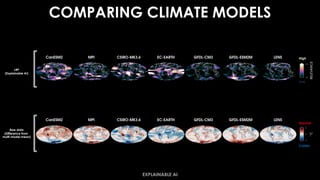
![STANDARD EVALUATION OF
CLIMATE MODELS
Pattern correlation
RMSE
EOFs
Trends, anomalies, mean state
Climate modes of variability
CORRELATION
[R]](https://image.slidesharecdn.com/zlabeaisessionrecording-slides-211207172443/85/Evaluating-global-climate-models-using-simple-explainable-neural-networks-10-320.jpg)
![INPUT
[DATA]
PREDICTION
Machine
Learning](https://image.slidesharecdn.com/zlabeaisessionrecording-slides-211207172443/85/Evaluating-global-climate-models-using-simple-explainable-neural-networks-12-320.jpg)

![CLIMATE MODEL
MAP
[DATA]
Machine
Learning
CLASSIFICATION](https://image.slidesharecdn.com/zlabeaisessionrecording-slides-211207172443/85/Evaluating-global-climate-models-using-simple-explainable-neural-networks-16-320.jpg)
![CLASSIFICATION
Machine
Learning
CLIMATE MODEL
MAP
[DATA]](https://image.slidesharecdn.com/zlabeaisessionrecording-slides-211207172443/85/Evaluating-global-climate-models-using-simple-explainable-neural-networks-17-320.jpg)
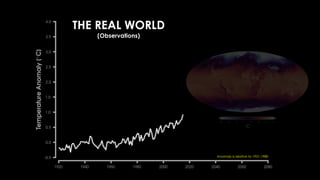
![CLASSIFICATION
Machine
Learning
CLIMATE MODEL
MAP
[DATA]
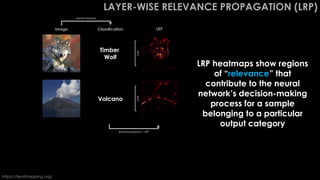
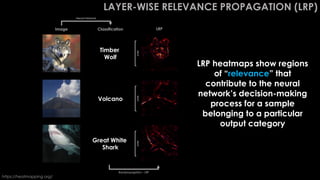
Explainable AI
Learn new
science!](https://image.slidesharecdn.com/zlabeaisessionrecording-slides-211207172443/85/Evaluating-global-climate-models-using-simple-explainable-neural-networks-18-320.jpg)
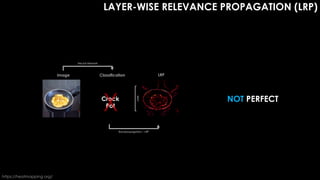
![[Adapted from Adebayo et al., 2020]
EXPLAINABLE AI IS
NOT PERFECT
THERE ARE MANY
METHODS](https://image.slidesharecdn.com/zlabeaisessionrecording-slides-211207172443/85/Evaluating-global-climate-models-using-simple-explainable-neural-networks-23-320.jpg)
![[Adapted from Adebayo et al., 2020]
THERE ARE MANY
METHODS
EXPLAINABLE AI IS
NOT PERFECT](https://image.slidesharecdn.com/zlabeaisessionrecording-slides-211207172443/85/Evaluating-global-climate-models-using-simple-explainable-neural-networks-24-320.jpg)
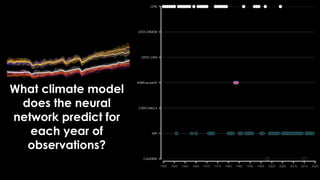
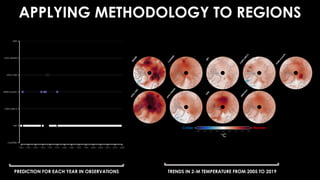
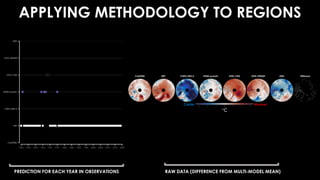
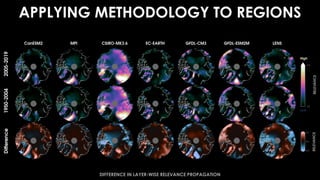
![APPLYING METHODOLOGY TO REGIONS
PREDICTION FOR EACH YEAR IN OBSERVATIONS PATTERN CORRELATIONS FOR EACH YEAR IN THE ARCTIC
CORRELATION
[R]](https://image.slidesharecdn.com/zlabeaisessionrecording-slides-211207172443/85/Evaluating-global-climate-models-using-simple-explainable-neural-networks-34-320.jpg)
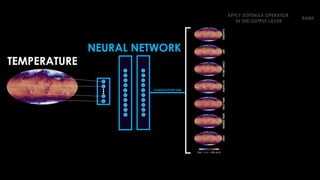
![APPLY SOFTMAX OPERATOR
IN THE OUTPUT LAYER
[ 0.71 ]
[ 0.05 ]
[ 0.01 ]
[ 0.01 ]
[ 0.03 ]
[ 0.11 ]
[ 0.08 ]
RANK](https://image.slidesharecdn.com/zlabeaisessionrecording-slides-211207172443/85/Evaluating-global-climate-models-using-simple-explainable-neural-networks-41-320.jpg)
![APPLY SOFTMAX OPERATOR
IN THE OUTPUT LAYER
[ 0.71 ]
[ 0.05 ]
[ 0.01 ]
[ 0.01 ]
[ 0.03 ]
[ 0.11 ]
[ 0.08 ]
RANK
[ 1 ]
[ 4 ]
[ 7 ]
[ 6 ]
[ 5 ]
[ 2 ]
[ 3 ]](https://image.slidesharecdn.com/zlabeaisessionrecording-slides-211207172443/85/Evaluating-global-climate-models-using-simple-explainable-neural-networks-42-320.jpg)
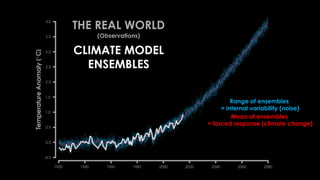
![APPLY SOFTMAX OPERATOR
IN THE OUTPUT LAYER
[ 0.71 ]
[ 0.05 ]
[ 0.01 ]
[ 0.01 ]
[ 0.03 ]
[ 0.11 ]
[ 0.08 ]
RANK
[ 1 ]
[ 4 ]
[ 7 ]
[ 6 ]
[ 5 ]
[ 2 ]
[ 3 ]
Confidence/Probability](https://image.slidesharecdn.com/zlabeaisessionrecording-slides-211207172443/85/Evaluating-global-climate-models-using-simple-explainable-neural-networks-43-320.jpg)
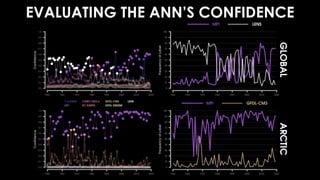
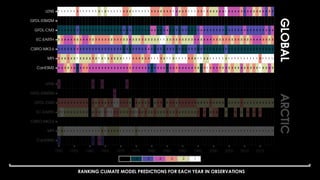
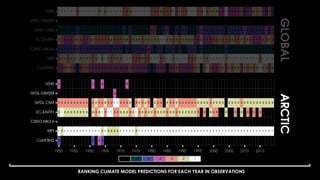

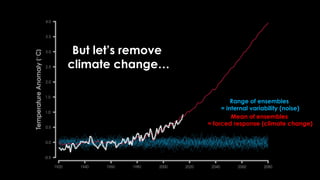
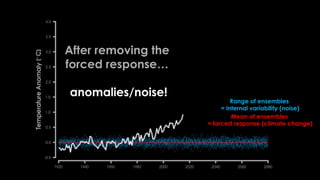
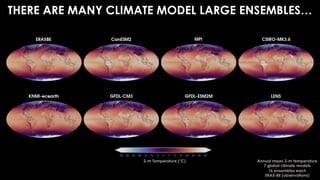
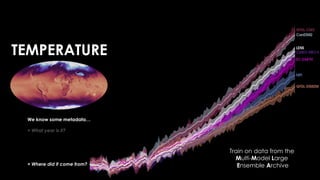
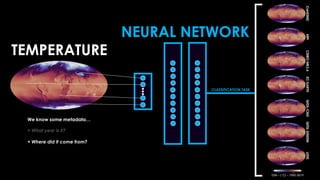
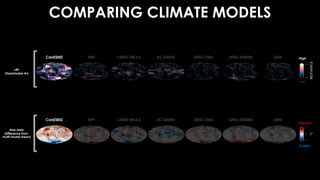
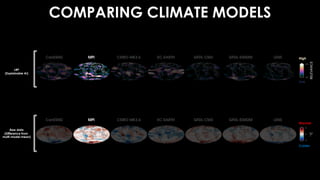
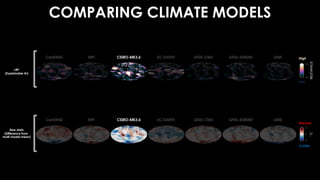
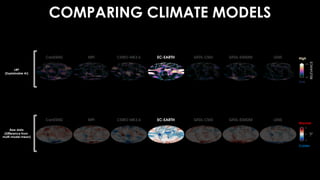
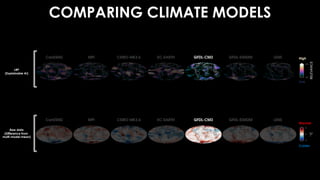
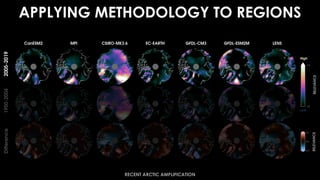
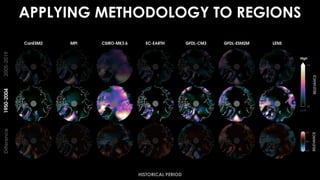
The document discusses the use of explainable neural networks to evaluate global climate models by analyzing temperature differences across model ensembles. It describes how these networks classify annual climate data and identify biases in regions such as the Arctic. The work highlights the potential of neural networks in climate science for better understanding and improving climate model predictions.