SlideShare a Scribd company logo
1 of 3
SPSS AND REGRESSION ANALYSIS
Using SPSS
1. Once you’ve accessed the SPSS data editor in the course folder, you can begin
adding data that pertain to your model.
2. To Enter Data:
a. Click on the Variable View position at the bottom of the screen.
b. Click on the name column for that row (row 11 is the first entry row open)
and write in an 8-character name for your variable.
c. Click back to the Data View position and start entering the data for each
year for which you have values. (In some cases you may have found data
for variables that you believe have influence on your dependent variable
but the data are only available for some of the years from 1960 to 2000.
That is all right. You can just run the model for those years when you
include that variable. You do this by going to the “select” function in the
data button on the menu commands row at the very top of the screen and
setting the “if” window to read years > 1974 (for example, if you only
have data for those years for a particular variable). The program will then
show all the rows for years before 1974 crossed out. When you run the
program it will only include the data for years after 1974 so there will be
no missing data problem.
3. Run the regression equation:
a. Click on analyze on the menu command row at the top of the screen, then
regression, then linear.
b. Move the dependent variable into its position by highlighting it and
clicking on the arrow key next to the dependent window.
c. Move the independent variables into the independent window in the same
way (you can move these in and out by highlighting them – the arrow will
always point in the right direction).
d. Just below the independent window, there is a drop-down window entitled
method. You can open that and select forward (you have to scroll down to
see it) if you want only to include variables that have a level of
significance exceeding .05. We will discuss this below under interpreting
your results.
e. Click on next or continue and the regression function will run.
Note: Once you’ve entered data, you may want to look at descriptive statistics and a
graph for each variable. You can do this by using the analyze button and click on
descriptive and run that function (you’ll get a lot of stuff – you’re interested in the
mean, the median, the minimum and the maximum). Then go to the graphs button,
choose line or scatterplot and position each variable into the Y axis window and the
years variable into the X axis window. Run the graph and print it or save it. This
gives you an eyeball estimate of how the variable has changed over the years. You
can also graph each pair of other variables against each other on a graph to determine
by eyeball if there is a pattern to their relationship before you run any regression.
4. Interpreting your results:
a. Once you have run the regression you’ll be shown the results in tables
with the titles, variables entered/removed, Model Summary, ANOVA,
Coefficients and Excluded Variables. For our purposes you’re not
interested in ANOVA.
b. The Model Summary gives you the Adjusted R Square (R2
). If it’s
above .250 you should be interested. The rough interpretation of that is
that 25 percent of the variation in the dependent variable can be explained
by variation(s) in the independent variable(s). That’s not great but you’re
getting there.
c. Next look at the Coefficients table. This takes the equation form Y = a +
b1X1 + b2X2 - b3X3 where Y is the dependent variable, a is a constant, the
bs are the beta coefficients that indicate the degree of influence the
corresponding independent variable has on variations in the dependent
variable (the higher the value of b the more influential the independent
variable) and the sign (pos., neg.) indicates the nature of the relationship
(whether the independent variable and the dependent variable move
together or in opposite directions). The Xs are the independent variables.
Don’t worry about the t statistic column but look at the sig. column. The
significant levels should all be below .05 which means that there is only a
5 percent probability that the independent variable does not influence the
dependent variable in the reported fashion (for example, negatively and
with a certain beta coefficient value). So, assuming a beta coefficient of - .
520 for a particular X is statistically significant (Sig. < .05) we can
conclude that the value of the Y variable will be determined by the value
of X and by changes in the value of X accordingly. So, for every one unit
change in X, Y will change by -.520X.
d. First, does the sign of the beta coefficient make theoretical sense? If you
believe (rightly) that a rise in government spending, everything else
unchanged, will cause a fall in unemployment and you find the beta
coefficient for government spending has a positive sign, then something is
fishy. Your results do not make sense. You might continue to play around
with adjusting the nature of the variables. You might create a new variable
that relates the change in unemployment (or unemployment rate) with the
change in government spending, or exclude some years when you think
there may have been an anomalous relationship between the two variables
because of some exogenous shock (oil prices, war etc). Be creative in your
choice of variables. For example, does the change in prison population,
military enlistment or college enrollments have an impact on the
unemployment rate? Keep thinking.
5. Finding Data
a. Here is the most difficult challenge. Is the data you want even available or
available in the right form? This is a problem for all researchers. Again
being creative is important. If you cannot find continuous data (a value for
each year), then create a dummy variable (0, 1) in which the variable takes
on a value of 0 if the value of the variable is above or below a particular
level or if something does or does not exist (e.g., if the party in the White
House is Republican or not; or if we’re at war or not, etc.)
b. Search in my cool sites webpage. Look in the economic report of the
President. Put in the search window the name of the variable you are
looking for and go to the tables (the initial locations will be in the
narrative of the report and you’re not interested in that for now) which will
be toward the bottom of the list of occurrences of that name. Look in the
RFE website (Resources For Economists) and then in the Data section and
then stroll through the Bureau of Labor Statistics, the Bureau of Economic
Analysis and the Organization of Economic Cooperation and
Development (OECD) sites for useful data.
c. Above all think whether or not these data might have a reasonable
influence on the dependent variable and in what direction (negative or
positive). Add the data to a column in the data editor and go to it. Just
keep trucking and contacting me by e-mail or phone.

More Related Content

What's hot

Scatter diagrams and correlation
Scatter diagrams and correlationScatter diagrams and correlation
Scatter diagrams and correlationkeithpeter
 
Excel creating pivot table
Excel creating pivot tableExcel creating pivot table
Excel creating pivot tablesamikshaa sinha
 
Pivot Tables and Beyond Data Analysis in Excel 2013 - Course Technology Compu...
Pivot Tables and Beyond Data Analysis in Excel 2013 - Course Technology Compu...Pivot Tables and Beyond Data Analysis in Excel 2013 - Course Technology Compu...
Pivot Tables and Beyond Data Analysis in Excel 2013 - Course Technology Compu...Cengage Learning
 
Dashboard and Database Manual for AFG
Dashboard and Database Manual for AFGDashboard and Database Manual for AFG
Dashboard and Database Manual for AFGAbigail Anderson
 
5 6 Scatter Plots & Best Fit Lines
5 6 Scatter Plots & Best Fit Lines5 6 Scatter Plots & Best Fit Lines
5 6 Scatter Plots & Best Fit LinesBitsy Griffin
 
Scatter plots
Scatter plotsScatter plots
Scatter plotsswartzje
 
Scatter plot- Complete
Scatter plot- CompleteScatter plot- Complete
Scatter plot- CompleteIrfan Yaqoob
 
Alg II 2-5 Linear Models
Alg II 2-5 Linear ModelsAlg II 2-5 Linear Models
Alg II 2-5 Linear Modelsjtentinger
 
Using the ti 83 84
Using the ti 83 84Using the ti 83 84
Using the ti 83 84lothomas
 

What's hot (20)

Graphing Calculator
Graphing CalculatorGraphing Calculator
Graphing Calculator
 
Presenting statistics in social media
Presenting statistics in social mediaPresenting statistics in social media
Presenting statistics in social media
 
Scatter diagrams and correlation
Scatter diagrams and correlationScatter diagrams and correlation
Scatter diagrams and correlation
 
Excel creating pivot table
Excel creating pivot tableExcel creating pivot table
Excel creating pivot table
 
Print18
Print18Print18
Print18
 
Pivot Tables and Beyond Data Analysis in Excel 2013 - Course Technology Compu...
Pivot Tables and Beyond Data Analysis in Excel 2013 - Course Technology Compu...Pivot Tables and Beyond Data Analysis in Excel 2013 - Course Technology Compu...
Pivot Tables and Beyond Data Analysis in Excel 2013 - Course Technology Compu...
 
Dashboard and Database Manual for AFG
Dashboard and Database Manual for AFGDashboard and Database Manual for AFG
Dashboard and Database Manual for AFG
 
assignment 2
assignment 2assignment 2
assignment 2
 
Mean Median Range Mode On Ti 84
Mean Median Range Mode On Ti 84Mean Median Range Mode On Ti 84
Mean Median Range Mode On Ti 84
 
Excel 2007 Get Started With Pivot Table Reports
Excel 2007  Get Started With  Pivot Table ReportsExcel 2007  Get Started With  Pivot Table Reports
Excel 2007 Get Started With Pivot Table Reports
 
5 6 Scatter Plots & Best Fit Lines
5 6 Scatter Plots & Best Fit Lines5 6 Scatter Plots & Best Fit Lines
5 6 Scatter Plots & Best Fit Lines
 
Scatter Plot
Scatter PlotScatter Plot
Scatter Plot
 
Excel Crash Course: Pivot Tables
Excel Crash Course: Pivot TablesExcel Crash Course: Pivot Tables
Excel Crash Course: Pivot Tables
 
Scatter plots
Scatter plotsScatter plots
Scatter plots
 
Pivot Tables
Pivot TablesPivot Tables
Pivot Tables
 
DuplicatesExcelDemo
DuplicatesExcelDemoDuplicatesExcelDemo
DuplicatesExcelDemo
 
Scatter plot- Complete
Scatter plot- CompleteScatter plot- Complete
Scatter plot- Complete
 
Scatter Diagrams
Scatter DiagramsScatter Diagrams
Scatter Diagrams
 
Alg II 2-5 Linear Models
Alg II 2-5 Linear ModelsAlg II 2-5 Linear Models
Alg II 2-5 Linear Models
 
Using the ti 83 84
Using the ti 83 84Using the ti 83 84
Using the ti 83 84
 

Viewers also liked

Viewers also liked (6)

Simplre regression through spss
Simplre regression through spssSimplre regression through spss
Simplre regression through spss
 
Modeling and interpretation
Modeling and interpretationModeling and interpretation
Modeling and interpretation
 
Topic17 regression spss
Topic17 regression spssTopic17 regression spss
Topic17 regression spss
 
Regression analysis
Regression analysisRegression analysis
Regression analysis
 
Linear Regression Using SPSS
Linear Regression Using SPSSLinear Regression Using SPSS
Linear Regression Using SPSS
 
Regression analysis ppt
Regression analysis pptRegression analysis ppt
Regression analysis ppt
 

Similar to Spss & regression analysis

Poli_399_Tutorial_Week_Three_-_Sept_29th_(2)
Poli_399_Tutorial_Week_Three_-_Sept_29th_(2)Poli_399_Tutorial_Week_Three_-_Sept_29th_(2)
Poli_399_Tutorial_Week_Three_-_Sept_29th_(2)christineshearer
 
DBM380 v14Create a DatabaseDBM380 v14Page 2 of 2Create a D.docx
DBM380 v14Create a DatabaseDBM380 v14Page 2 of 2Create a D.docxDBM380 v14Create a DatabaseDBM380 v14Page 2 of 2Create a D.docx
DBM380 v14Create a DatabaseDBM380 v14Page 2 of 2Create a D.docxedwardmarivel
 
Structural equation modeling in amos
Structural equation modeling in amosStructural equation modeling in amos
Structural equation modeling in amosBalaji P
 
Data Coding and Data Management using SPSS
Data Coding and Data Management using SPSSData Coding and Data Management using SPSS
Data Coding and Data Management using SPSSMelba Shaya Sweety
 
This is Teacher’s feedback on our FIRST DELIVERABLE.Just to le.docx
This is Teacher’s feedback on our FIRST DELIVERABLE.Just to le.docxThis is Teacher’s feedback on our FIRST DELIVERABLE.Just to le.docx
This is Teacher’s feedback on our FIRST DELIVERABLE.Just to le.docxchristalgrieg
 
SPSS How to use Spss software
SPSS How to use Spss softwareSPSS How to use Spss software
SPSS How to use Spss softwareDebashis Baidya
 
111249-140817070204-phpapp02.pdf
111249-140817070204-phpapp02.pdf111249-140817070204-phpapp02.pdf
111249-140817070204-phpapp02.pdfBMmugal
 
SPSS PRESENTATION.PPT.pptx
SPSS PRESENTATION.PPT.pptxSPSS PRESENTATION.PPT.pptx
SPSS PRESENTATION.PPT.pptxBMmugal
 
Week 3 Lecture 11 Regression Analysis Regression analy.docx
Week 3 Lecture 11 Regression Analysis Regression analy.docxWeek 3 Lecture 11 Regression Analysis Regression analy.docx
Week 3 Lecture 11 Regression Analysis Regression analy.docxcockekeshia
 
Covariance and correlation
Covariance and correlationCovariance and correlation
Covariance and correlationRashid Hussain
 
Spss by vijay ambast
Spss by vijay ambastSpss by vijay ambast
Spss by vijay ambastVijay Ambast
 
Homework Assignment 9 Edited on 10272014 Due by Wednes.docx
Homework Assignment 9 Edited on 10272014 Due by Wednes.docxHomework Assignment 9 Edited on 10272014 Due by Wednes.docx
Homework Assignment 9 Edited on 10272014 Due by Wednes.docxadampcarr67227
 
SPSS :Introduction for beginners
SPSS :Introduction for beginners SPSS :Introduction for beginners
SPSS :Introduction for beginners PRAKASAM C P
 
REGRESSION ANALYSISPlease refer to chapter 3 of the textbook fo.docx
REGRESSION ANALYSISPlease refer to chapter 3 of  the textbook fo.docxREGRESSION ANALYSISPlease refer to chapter 3 of  the textbook fo.docx
REGRESSION ANALYSISPlease refer to chapter 3 of the textbook fo.docxdebishakespeare
 
Print CopyExport Output InstructionsSPSS output can be selectiv.docx
Print CopyExport Output InstructionsSPSS output can be selectiv.docxPrint CopyExport Output InstructionsSPSS output can be selectiv.docx
Print CopyExport Output InstructionsSPSS output can be selectiv.docxstilliegeorgiana
 

Similar to Spss & regression analysis (20)

Poli_399_Tutorial_Week_Three_-_Sept_29th_(2)
Poli_399_Tutorial_Week_Three_-_Sept_29th_(2)Poli_399_Tutorial_Week_Three_-_Sept_29th_(2)
Poli_399_Tutorial_Week_Three_-_Sept_29th_(2)
 
DBM380 v14Create a DatabaseDBM380 v14Page 2 of 2Create a D.docx
DBM380 v14Create a DatabaseDBM380 v14Page 2 of 2Create a D.docxDBM380 v14Create a DatabaseDBM380 v14Page 2 of 2Create a D.docx
DBM380 v14Create a DatabaseDBM380 v14Page 2 of 2Create a D.docx
 
Dealing with data-excel
Dealing with data-excelDealing with data-excel
Dealing with data-excel
 
Structural equation modeling in amos
Structural equation modeling in amosStructural equation modeling in amos
Structural equation modeling in amos
 
Data Coding and Data Management using SPSS
Data Coding and Data Management using SPSSData Coding and Data Management using SPSS
Data Coding and Data Management using SPSS
 
Graphs ppt
Graphs pptGraphs ppt
Graphs ppt
 
This is Teacher’s feedback on our FIRST DELIVERABLE.Just to le.docx
This is Teacher’s feedback on our FIRST DELIVERABLE.Just to le.docxThis is Teacher’s feedback on our FIRST DELIVERABLE.Just to le.docx
This is Teacher’s feedback on our FIRST DELIVERABLE.Just to le.docx
 
SPSS How to use Spss software
SPSS How to use Spss softwareSPSS How to use Spss software
SPSS How to use Spss software
 
Spss guidelines
Spss guidelinesSpss guidelines
Spss guidelines
 
111249-140817070204-phpapp02.pdf
111249-140817070204-phpapp02.pdf111249-140817070204-phpapp02.pdf
111249-140817070204-phpapp02.pdf
 
(Manual spss)
(Manual spss)(Manual spss)
(Manual spss)
 
SPSS PRESENTATION.PPT.pptx
SPSS PRESENTATION.PPT.pptxSPSS PRESENTATION.PPT.pptx
SPSS PRESENTATION.PPT.pptx
 
Week 3 Lecture 11 Regression Analysis Regression analy.docx
Week 3 Lecture 11 Regression Analysis Regression analy.docxWeek 3 Lecture 11 Regression Analysis Regression analy.docx
Week 3 Lecture 11 Regression Analysis Regression analy.docx
 
Covariance and correlation
Covariance and correlationCovariance and correlation
Covariance and correlation
 
Spss by vijay ambast
Spss by vijay ambastSpss by vijay ambast
Spss by vijay ambast
 
spss teaching
spss teachingspss teaching
spss teaching
 
Homework Assignment 9 Edited on 10272014 Due by Wednes.docx
Homework Assignment 9 Edited on 10272014 Due by Wednes.docxHomework Assignment 9 Edited on 10272014 Due by Wednes.docx
Homework Assignment 9 Edited on 10272014 Due by Wednes.docx
 
SPSS :Introduction for beginners
SPSS :Introduction for beginners SPSS :Introduction for beginners
SPSS :Introduction for beginners
 
REGRESSION ANALYSISPlease refer to chapter 3 of the textbook fo.docx
REGRESSION ANALYSISPlease refer to chapter 3 of  the textbook fo.docxREGRESSION ANALYSISPlease refer to chapter 3 of  the textbook fo.docx
REGRESSION ANALYSISPlease refer to chapter 3 of the textbook fo.docx
 
Print CopyExport Output InstructionsSPSS output can be selectiv.docx
Print CopyExport Output InstructionsSPSS output can be selectiv.docxPrint CopyExport Output InstructionsSPSS output can be selectiv.docx
Print CopyExport Output InstructionsSPSS output can be selectiv.docx
 

Recently uploaded

A Critique of the Proposed National Education Policy Reform
A Critique of the Proposed National Education Policy ReformA Critique of the Proposed National Education Policy Reform
A Critique of the Proposed National Education Policy ReformChameera Dedduwage
 
History Class XII Ch. 3 Kinship, Caste and Class (1).pptx
History Class XII Ch. 3 Kinship, Caste and Class (1).pptxHistory Class XII Ch. 3 Kinship, Caste and Class (1).pptx
History Class XII Ch. 3 Kinship, Caste and Class (1).pptxsocialsciencegdgrohi
 
How to Configure Email Server in Odoo 17
How to Configure Email Server in Odoo 17How to Configure Email Server in Odoo 17
How to Configure Email Server in Odoo 17Celine George
 
Science 7 - LAND and SEA BREEZE and its Characteristics
Science 7 - LAND and SEA BREEZE and its CharacteristicsScience 7 - LAND and SEA BREEZE and its Characteristics
Science 7 - LAND and SEA BREEZE and its CharacteristicsKarinaGenton
 
Computed Fields and api Depends in the Odoo 17
Computed Fields and api Depends in the Odoo 17Computed Fields and api Depends in the Odoo 17
Computed Fields and api Depends in the Odoo 17Celine George
 
_Math 4-Q4 Week 5.pptx Steps in Collecting Data
_Math 4-Q4 Week 5.pptx Steps in Collecting Data_Math 4-Q4 Week 5.pptx Steps in Collecting Data
_Math 4-Q4 Week 5.pptx Steps in Collecting DataJhengPantaleon
 
Kisan Call Centre - To harness potential of ICT in Agriculture by answer farm...
Kisan Call Centre - To harness potential of ICT in Agriculture by answer farm...Kisan Call Centre - To harness potential of ICT in Agriculture by answer farm...
Kisan Call Centre - To harness potential of ICT in Agriculture by answer farm...Krashi Coaching
 
Enzyme, Pharmaceutical Aids, Miscellaneous Last Part of Chapter no 5th.pdf
Enzyme, Pharmaceutical Aids, Miscellaneous Last Part of Chapter no 5th.pdfEnzyme, Pharmaceutical Aids, Miscellaneous Last Part of Chapter no 5th.pdf
Enzyme, Pharmaceutical Aids, Miscellaneous Last Part of Chapter no 5th.pdfSumit Tiwari
 
Presiding Officer Training module 2024 lok sabha elections
Presiding Officer Training module 2024 lok sabha electionsPresiding Officer Training module 2024 lok sabha elections
Presiding Officer Training module 2024 lok sabha electionsanshu789521
 
Final demo Grade 9 for demo Plan dessert.pptx
Final demo Grade 9 for demo Plan dessert.pptxFinal demo Grade 9 for demo Plan dessert.pptx
Final demo Grade 9 for demo Plan dessert.pptxAvyJaneVismanos
 
ENGLISH5 QUARTER4 MODULE1 WEEK1-3 How Visual and Multimedia Elements.pptx
ENGLISH5 QUARTER4 MODULE1 WEEK1-3 How Visual and Multimedia Elements.pptxENGLISH5 QUARTER4 MODULE1 WEEK1-3 How Visual and Multimedia Elements.pptx
ENGLISH5 QUARTER4 MODULE1 WEEK1-3 How Visual and Multimedia Elements.pptxAnaBeatriceAblay2
 
Software Engineering Methodologies (overview)
Software Engineering Methodologies (overview)Software Engineering Methodologies (overview)
Software Engineering Methodologies (overview)eniolaolutunde
 
Science lesson Moon for 4th quarter lesson
Science lesson Moon for 4th quarter lessonScience lesson Moon for 4th quarter lesson
Science lesson Moon for 4th quarter lessonJericReyAuditor
 
Hybridoma Technology ( Production , Purification , and Application )
Hybridoma Technology  ( Production , Purification , and Application  ) Hybridoma Technology  ( Production , Purification , and Application  )
Hybridoma Technology ( Production , Purification , and Application ) Sakshi Ghasle
 
Organic Name Reactions for the students and aspirants of Chemistry12th.pptx
Organic Name Reactions  for the students and aspirants of Chemistry12th.pptxOrganic Name Reactions  for the students and aspirants of Chemistry12th.pptx
Organic Name Reactions for the students and aspirants of Chemistry12th.pptxVS Mahajan Coaching Centre
 
internship ppt on smartinternz platform as salesforce developer
internship ppt on smartinternz platform as salesforce developerinternship ppt on smartinternz platform as salesforce developer
internship ppt on smartinternz platform as salesforce developerunnathinaik
 
Introduction to AI in Higher Education_draft.pptx
Introduction to AI in Higher Education_draft.pptxIntroduction to AI in Higher Education_draft.pptx
Introduction to AI in Higher Education_draft.pptxpboyjonauth
 
“Oh GOSH! Reflecting on Hackteria's Collaborative Practices in a Global Do-It...
“Oh GOSH! Reflecting on Hackteria's Collaborative Practices in a Global Do-It...“Oh GOSH! Reflecting on Hackteria's Collaborative Practices in a Global Do-It...
“Oh GOSH! Reflecting on Hackteria's Collaborative Practices in a Global Do-It...Marc Dusseiller Dusjagr
 

Recently uploaded (20)

A Critique of the Proposed National Education Policy Reform
A Critique of the Proposed National Education Policy ReformA Critique of the Proposed National Education Policy Reform
A Critique of the Proposed National Education Policy Reform
 
History Class XII Ch. 3 Kinship, Caste and Class (1).pptx
History Class XII Ch. 3 Kinship, Caste and Class (1).pptxHistory Class XII Ch. 3 Kinship, Caste and Class (1).pptx
History Class XII Ch. 3 Kinship, Caste and Class (1).pptx
 
How to Configure Email Server in Odoo 17
How to Configure Email Server in Odoo 17How to Configure Email Server in Odoo 17
How to Configure Email Server in Odoo 17
 
Science 7 - LAND and SEA BREEZE and its Characteristics
Science 7 - LAND and SEA BREEZE and its CharacteristicsScience 7 - LAND and SEA BREEZE and its Characteristics
Science 7 - LAND and SEA BREEZE and its Characteristics
 
Computed Fields and api Depends in the Odoo 17
Computed Fields and api Depends in the Odoo 17Computed Fields and api Depends in the Odoo 17
Computed Fields and api Depends in the Odoo 17
 
_Math 4-Q4 Week 5.pptx Steps in Collecting Data
_Math 4-Q4 Week 5.pptx Steps in Collecting Data_Math 4-Q4 Week 5.pptx Steps in Collecting Data
_Math 4-Q4 Week 5.pptx Steps in Collecting Data
 
Kisan Call Centre - To harness potential of ICT in Agriculture by answer farm...
Kisan Call Centre - To harness potential of ICT in Agriculture by answer farm...Kisan Call Centre - To harness potential of ICT in Agriculture by answer farm...
Kisan Call Centre - To harness potential of ICT in Agriculture by answer farm...
 
Staff of Color (SOC) Retention Efforts DDSD
Staff of Color (SOC) Retention Efforts DDSDStaff of Color (SOC) Retention Efforts DDSD
Staff of Color (SOC) Retention Efforts DDSD
 
Enzyme, Pharmaceutical Aids, Miscellaneous Last Part of Chapter no 5th.pdf
Enzyme, Pharmaceutical Aids, Miscellaneous Last Part of Chapter no 5th.pdfEnzyme, Pharmaceutical Aids, Miscellaneous Last Part of Chapter no 5th.pdf
Enzyme, Pharmaceutical Aids, Miscellaneous Last Part of Chapter no 5th.pdf
 
Presiding Officer Training module 2024 lok sabha elections
Presiding Officer Training module 2024 lok sabha electionsPresiding Officer Training module 2024 lok sabha elections
Presiding Officer Training module 2024 lok sabha elections
 
TataKelola dan KamSiber Kecerdasan Buatan v022.pdf
TataKelola dan KamSiber Kecerdasan Buatan v022.pdfTataKelola dan KamSiber Kecerdasan Buatan v022.pdf
TataKelola dan KamSiber Kecerdasan Buatan v022.pdf
 
Final demo Grade 9 for demo Plan dessert.pptx
Final demo Grade 9 for demo Plan dessert.pptxFinal demo Grade 9 for demo Plan dessert.pptx
Final demo Grade 9 for demo Plan dessert.pptx
 
ENGLISH5 QUARTER4 MODULE1 WEEK1-3 How Visual and Multimedia Elements.pptx
ENGLISH5 QUARTER4 MODULE1 WEEK1-3 How Visual and Multimedia Elements.pptxENGLISH5 QUARTER4 MODULE1 WEEK1-3 How Visual and Multimedia Elements.pptx
ENGLISH5 QUARTER4 MODULE1 WEEK1-3 How Visual and Multimedia Elements.pptx
 
Software Engineering Methodologies (overview)
Software Engineering Methodologies (overview)Software Engineering Methodologies (overview)
Software Engineering Methodologies (overview)
 
Science lesson Moon for 4th quarter lesson
Science lesson Moon for 4th quarter lessonScience lesson Moon for 4th quarter lesson
Science lesson Moon for 4th quarter lesson
 
Hybridoma Technology ( Production , Purification , and Application )
Hybridoma Technology  ( Production , Purification , and Application  ) Hybridoma Technology  ( Production , Purification , and Application  )
Hybridoma Technology ( Production , Purification , and Application )
 
Organic Name Reactions for the students and aspirants of Chemistry12th.pptx
Organic Name Reactions  for the students and aspirants of Chemistry12th.pptxOrganic Name Reactions  for the students and aspirants of Chemistry12th.pptx
Organic Name Reactions for the students and aspirants of Chemistry12th.pptx
 
internship ppt on smartinternz platform as salesforce developer
internship ppt on smartinternz platform as salesforce developerinternship ppt on smartinternz platform as salesforce developer
internship ppt on smartinternz platform as salesforce developer
 
Introduction to AI in Higher Education_draft.pptx
Introduction to AI in Higher Education_draft.pptxIntroduction to AI in Higher Education_draft.pptx
Introduction to AI in Higher Education_draft.pptx
 
“Oh GOSH! Reflecting on Hackteria's Collaborative Practices in a Global Do-It...
“Oh GOSH! Reflecting on Hackteria's Collaborative Practices in a Global Do-It...“Oh GOSH! Reflecting on Hackteria's Collaborative Practices in a Global Do-It...
“Oh GOSH! Reflecting on Hackteria's Collaborative Practices in a Global Do-It...
 

Spss & regression analysis

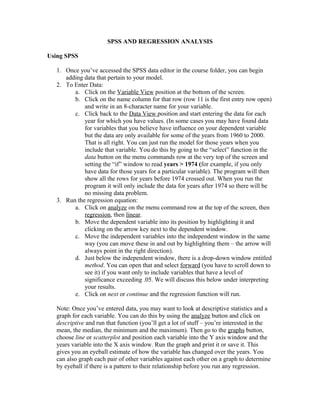
  • 1. SPSS AND REGRESSION ANALYSIS Using SPSS 1. Once you’ve accessed the SPSS data editor in the course folder, you can begin adding data that pertain to your model. 2. To Enter Data: a. Click on the Variable View position at the bottom of the screen. b. Click on the name column for that row (row 11 is the first entry row open) and write in an 8-character name for your variable. c. Click back to the Data View position and start entering the data for each year for which you have values. (In some cases you may have found data for variables that you believe have influence on your dependent variable but the data are only available for some of the years from 1960 to 2000. That is all right. You can just run the model for those years when you include that variable. You do this by going to the “select” function in the data button on the menu commands row at the very top of the screen and setting the “if” window to read years > 1974 (for example, if you only have data for those years for a particular variable). The program will then show all the rows for years before 1974 crossed out. When you run the program it will only include the data for years after 1974 so there will be no missing data problem. 3. Run the regression equation: a. Click on analyze on the menu command row at the top of the screen, then regression, then linear. b. Move the dependent variable into its position by highlighting it and clicking on the arrow key next to the dependent window. c. Move the independent variables into the independent window in the same way (you can move these in and out by highlighting them – the arrow will always point in the right direction). d. Just below the independent window, there is a drop-down window entitled method. You can open that and select forward (you have to scroll down to see it) if you want only to include variables that have a level of significance exceeding .05. We will discuss this below under interpreting your results. e. Click on next or continue and the regression function will run. Note: Once you’ve entered data, you may want to look at descriptive statistics and a graph for each variable. You can do this by using the analyze button and click on descriptive and run that function (you’ll get a lot of stuff – you’re interested in the mean, the median, the minimum and the maximum). Then go to the graphs button, choose line or scatterplot and position each variable into the Y axis window and the years variable into the X axis window. Run the graph and print it or save it. This gives you an eyeball estimate of how the variable has changed over the years. You can also graph each pair of other variables against each other on a graph to determine by eyeball if there is a pattern to their relationship before you run any regression.
  • 2. 4. Interpreting your results: a. Once you have run the regression you’ll be shown the results in tables with the titles, variables entered/removed, Model Summary, ANOVA, Coefficients and Excluded Variables. For our purposes you’re not interested in ANOVA. b. The Model Summary gives you the Adjusted R Square (R2 ). If it’s above .250 you should be interested. The rough interpretation of that is that 25 percent of the variation in the dependent variable can be explained by variation(s) in the independent variable(s). That’s not great but you’re getting there. c. Next look at the Coefficients table. This takes the equation form Y = a + b1X1 + b2X2 - b3X3 where Y is the dependent variable, a is a constant, the bs are the beta coefficients that indicate the degree of influence the corresponding independent variable has on variations in the dependent variable (the higher the value of b the more influential the independent variable) and the sign (pos., neg.) indicates the nature of the relationship (whether the independent variable and the dependent variable move together or in opposite directions). The Xs are the independent variables. Don’t worry about the t statistic column but look at the sig. column. The significant levels should all be below .05 which means that there is only a 5 percent probability that the independent variable does not influence the dependent variable in the reported fashion (for example, negatively and with a certain beta coefficient value). So, assuming a beta coefficient of - . 520 for a particular X is statistically significant (Sig. < .05) we can conclude that the value of the Y variable will be determined by the value of X and by changes in the value of X accordingly. So, for every one unit change in X, Y will change by -.520X. d. First, does the sign of the beta coefficient make theoretical sense? If you believe (rightly) that a rise in government spending, everything else unchanged, will cause a fall in unemployment and you find the beta coefficient for government spending has a positive sign, then something is fishy. Your results do not make sense. You might continue to play around with adjusting the nature of the variables. You might create a new variable that relates the change in unemployment (or unemployment rate) with the change in government spending, or exclude some years when you think there may have been an anomalous relationship between the two variables because of some exogenous shock (oil prices, war etc). Be creative in your choice of variables. For example, does the change in prison population, military enlistment or college enrollments have an impact on the unemployment rate? Keep thinking. 5. Finding Data a. Here is the most difficult challenge. Is the data you want even available or available in the right form? This is a problem for all researchers. Again being creative is important. If you cannot find continuous data (a value for
  • 3. each year), then create a dummy variable (0, 1) in which the variable takes on a value of 0 if the value of the variable is above or below a particular level or if something does or does not exist (e.g., if the party in the White House is Republican or not; or if we’re at war or not, etc.) b. Search in my cool sites webpage. Look in the economic report of the President. Put in the search window the name of the variable you are looking for and go to the tables (the initial locations will be in the narrative of the report and you’re not interested in that for now) which will be toward the bottom of the list of occurrences of that name. Look in the RFE website (Resources For Economists) and then in the Data section and then stroll through the Bureau of Labor Statistics, the Bureau of Economic Analysis and the Organization of Economic Cooperation and Development (OECD) sites for useful data. c. Above all think whether or not these data might have a reasonable influence on the dependent variable and in what direction (negative or positive). Add the data to a column in the data editor and go to it. Just keep trucking and contacting me by e-mail or phone.