Download as PDF, PPTX
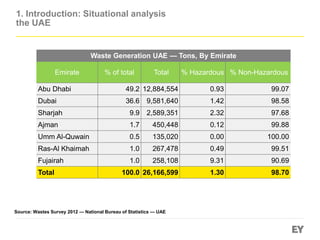
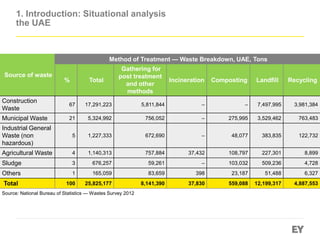
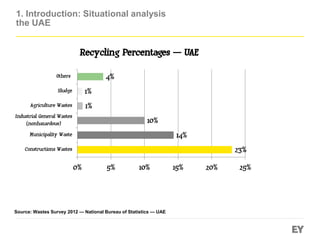
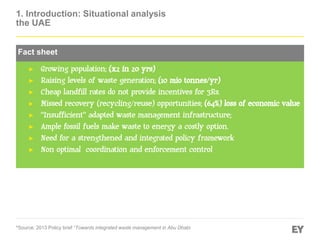


The document provides an overview of sustainable resource management in the UAE, including: 1. Current waste generation and treatment methods, with opportunities for improved recycling. 2. The need for integrated waste management strategies and policies to transition to a circular economy model. 3. EY Belgium's expertise in sustainable resource management and working with governments on circular economy solutions globally.