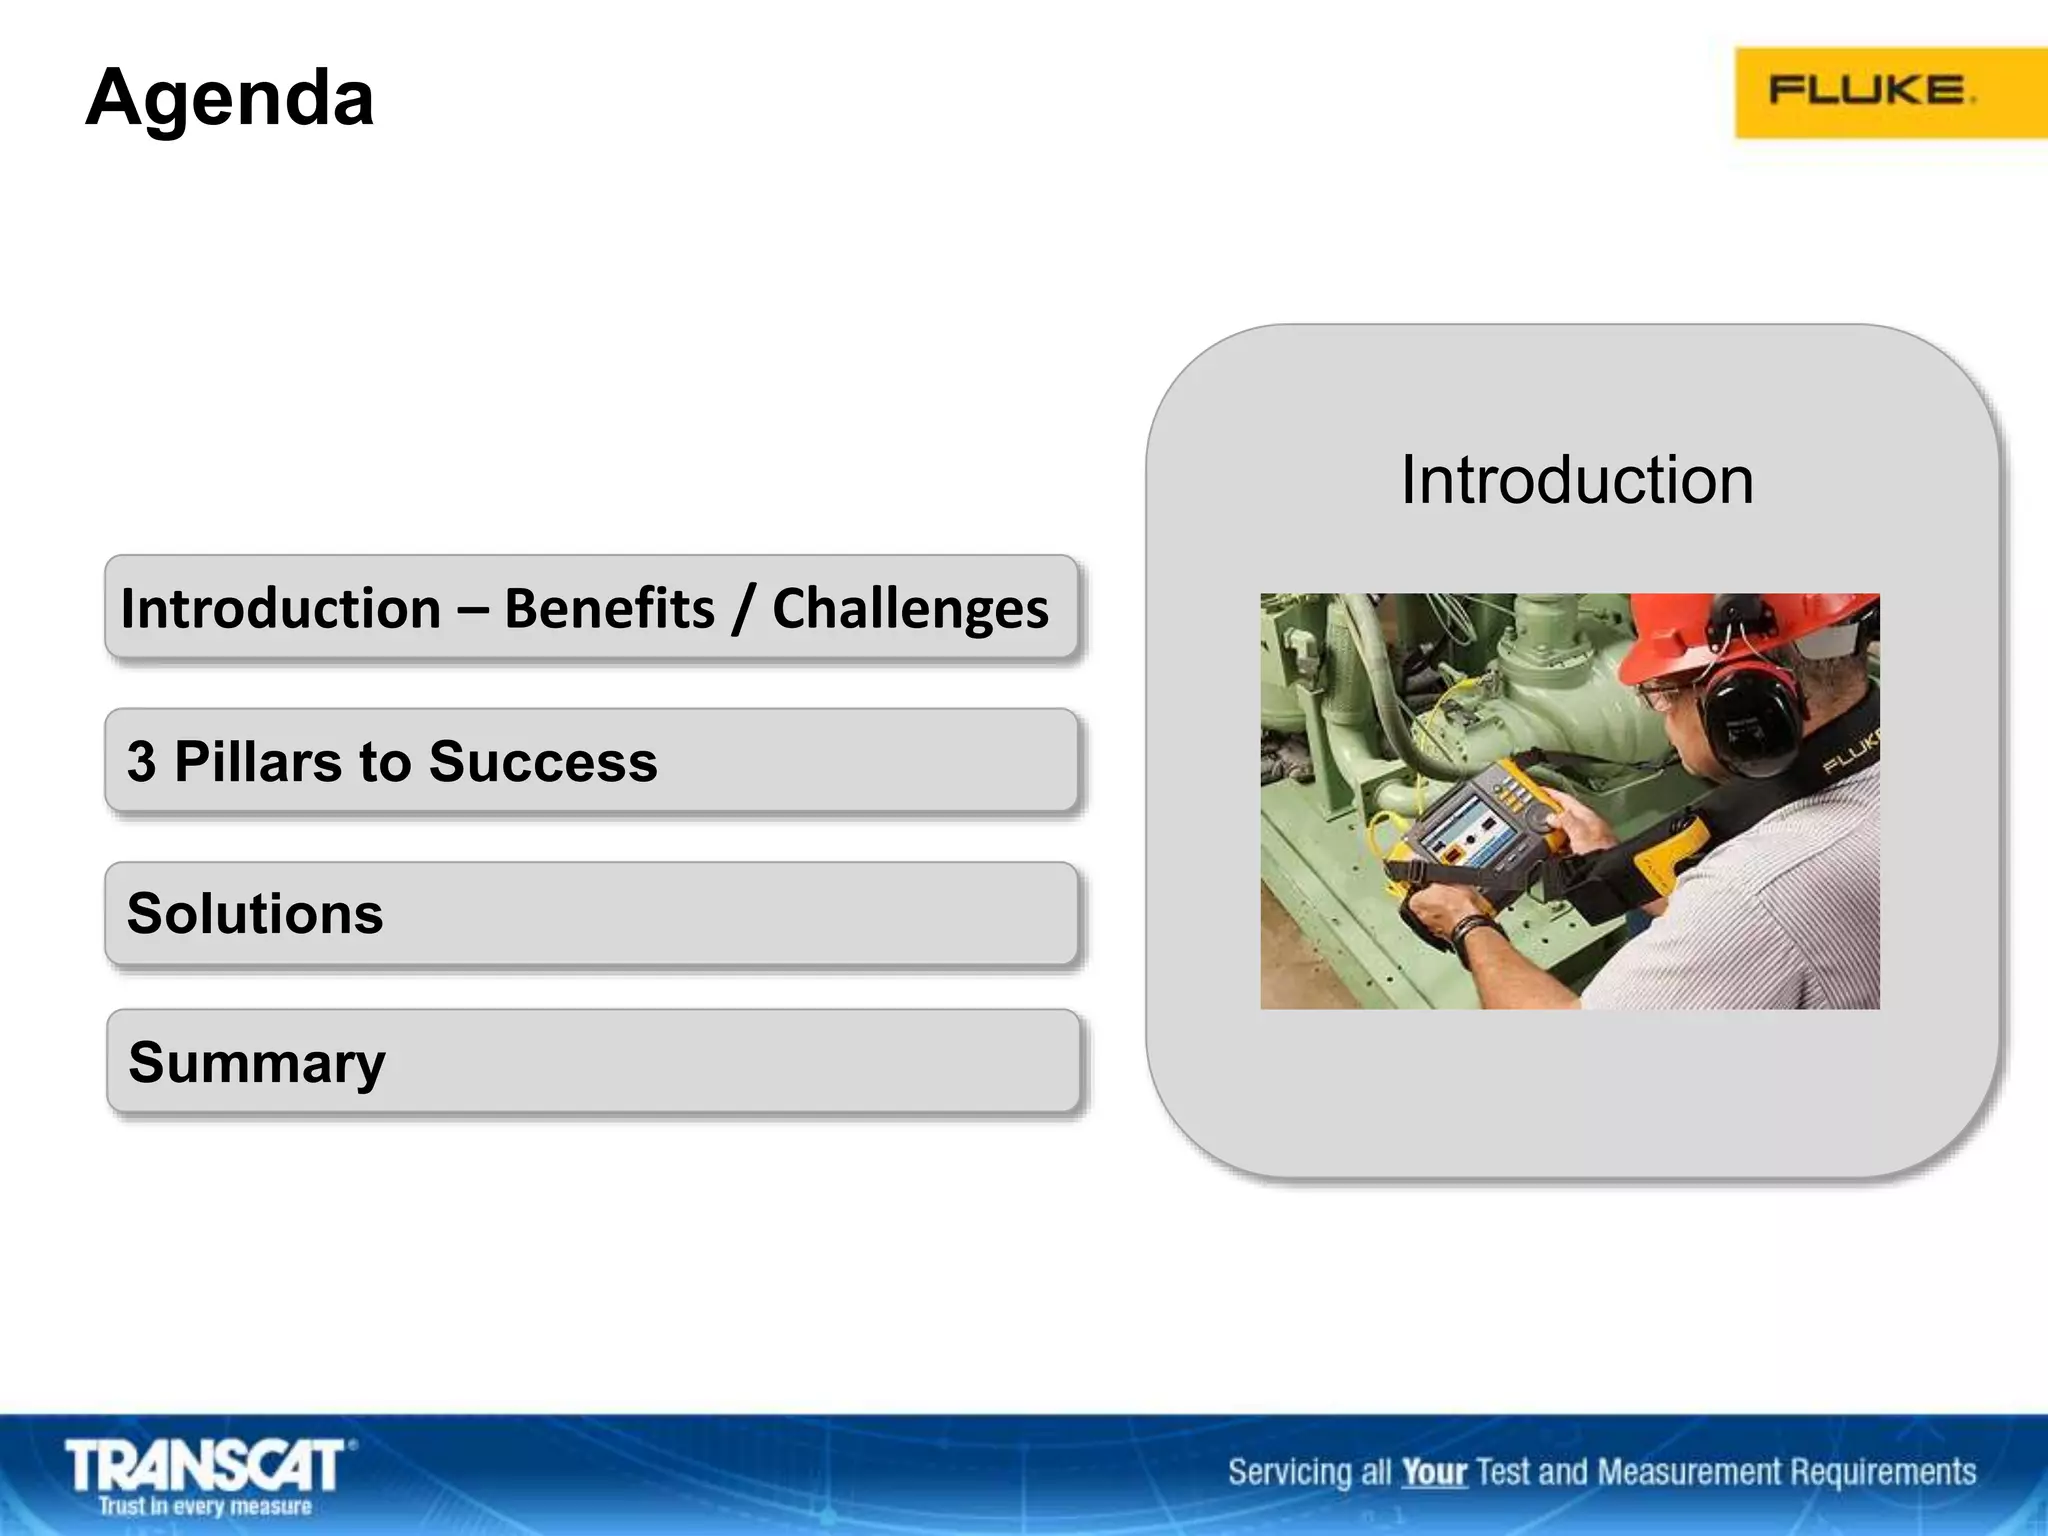
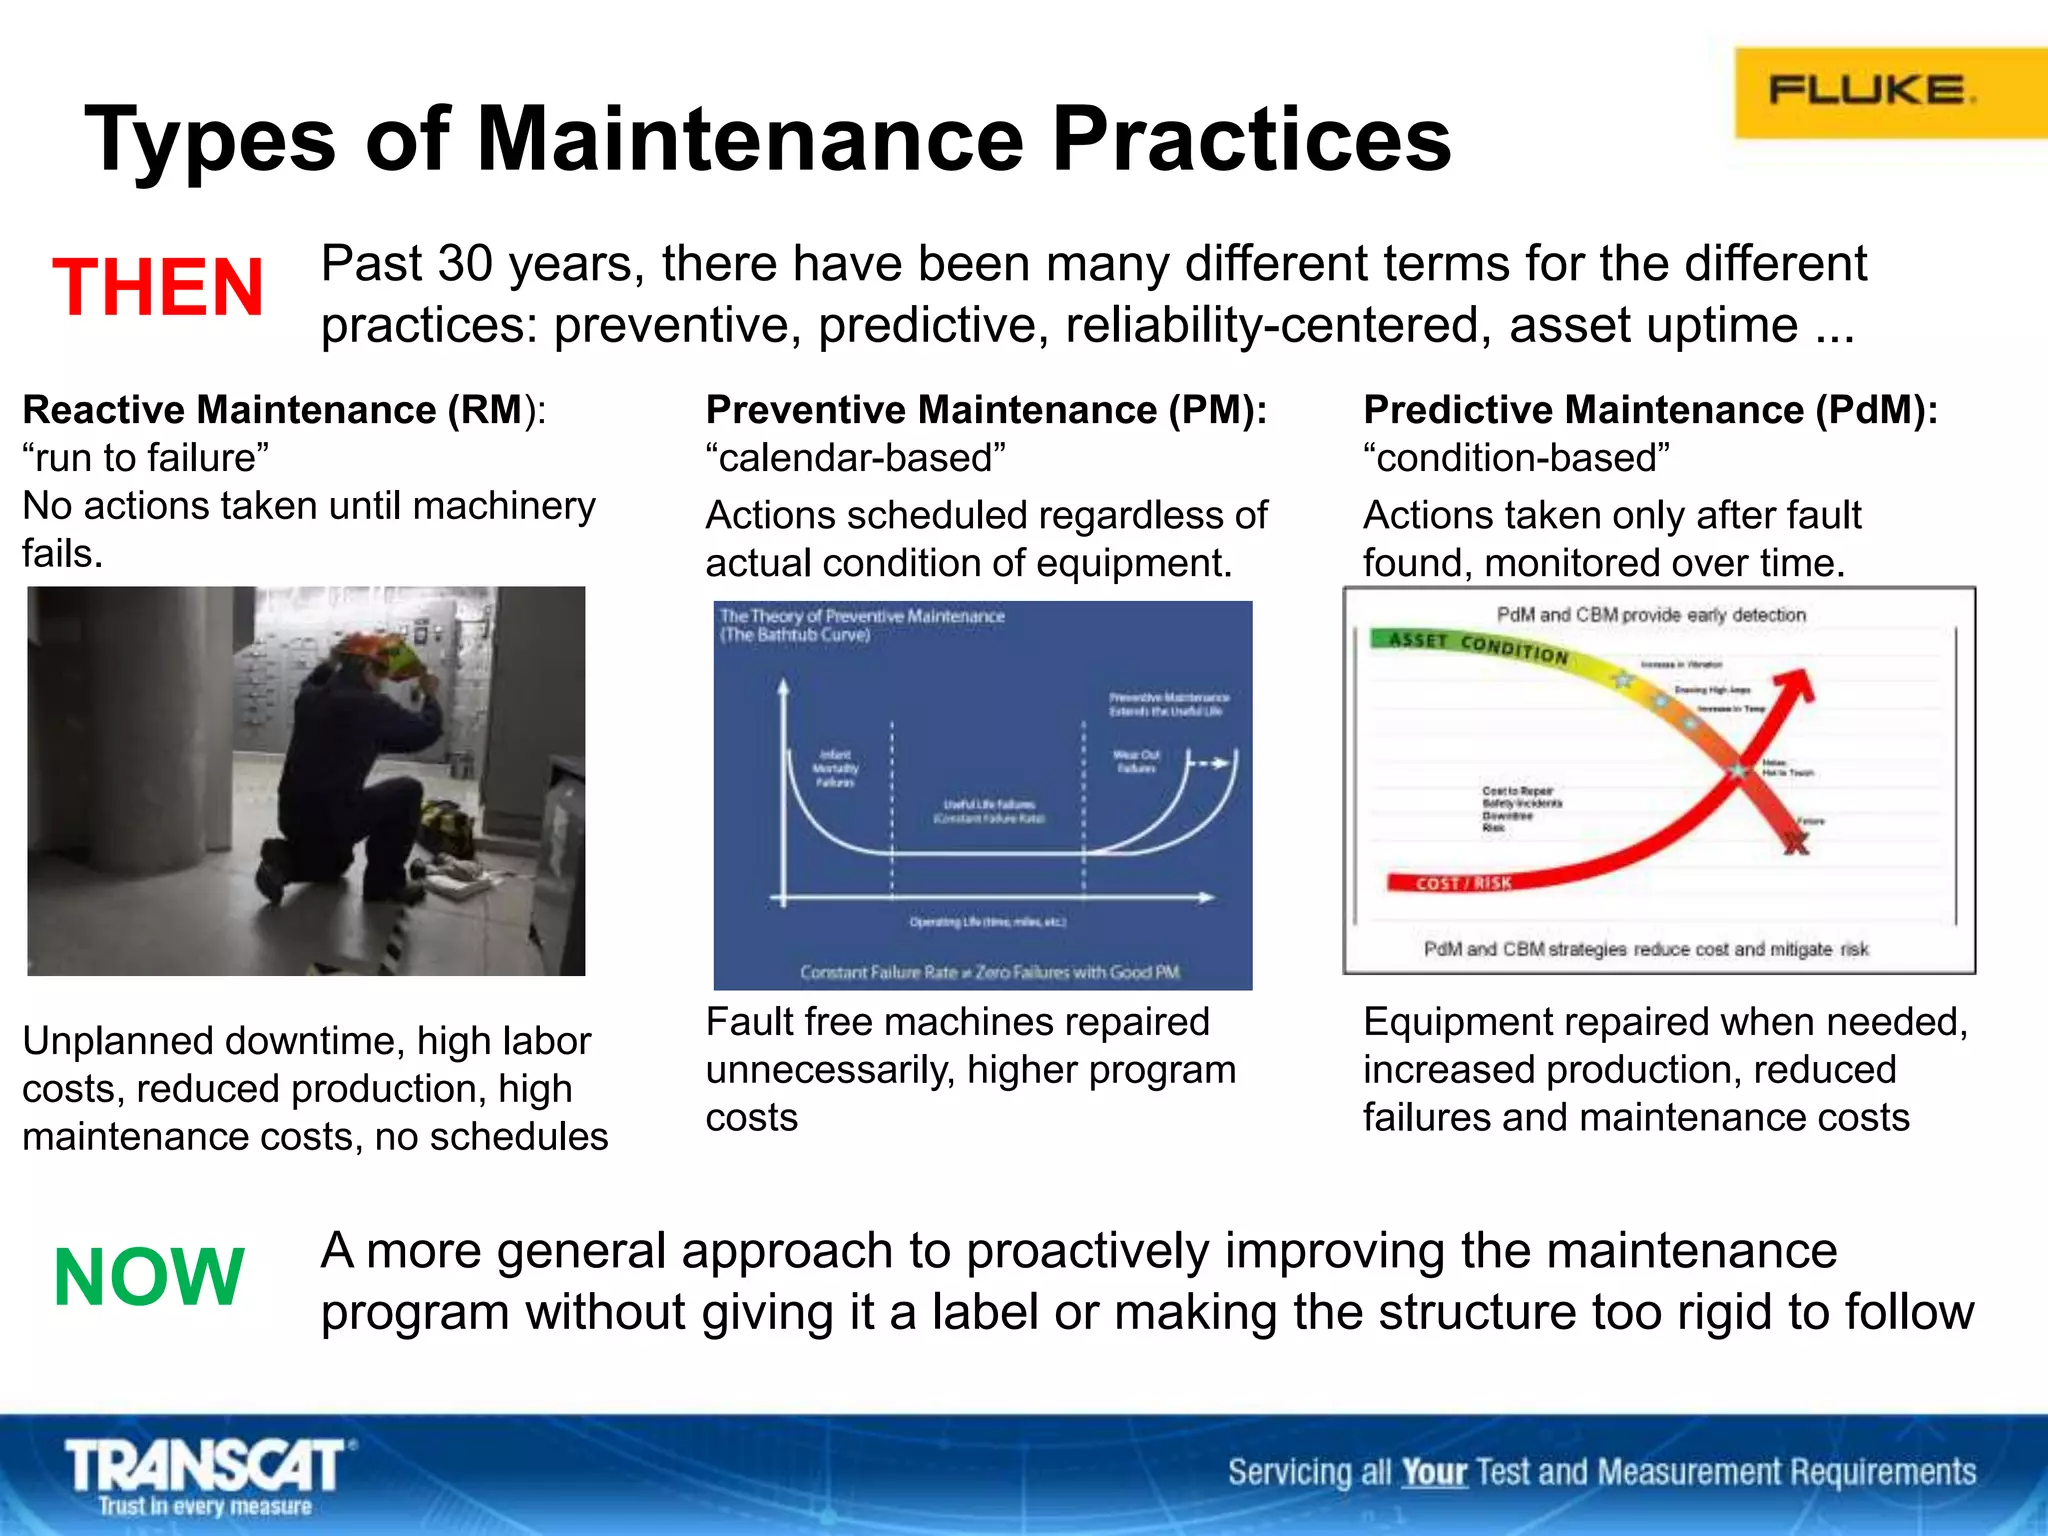
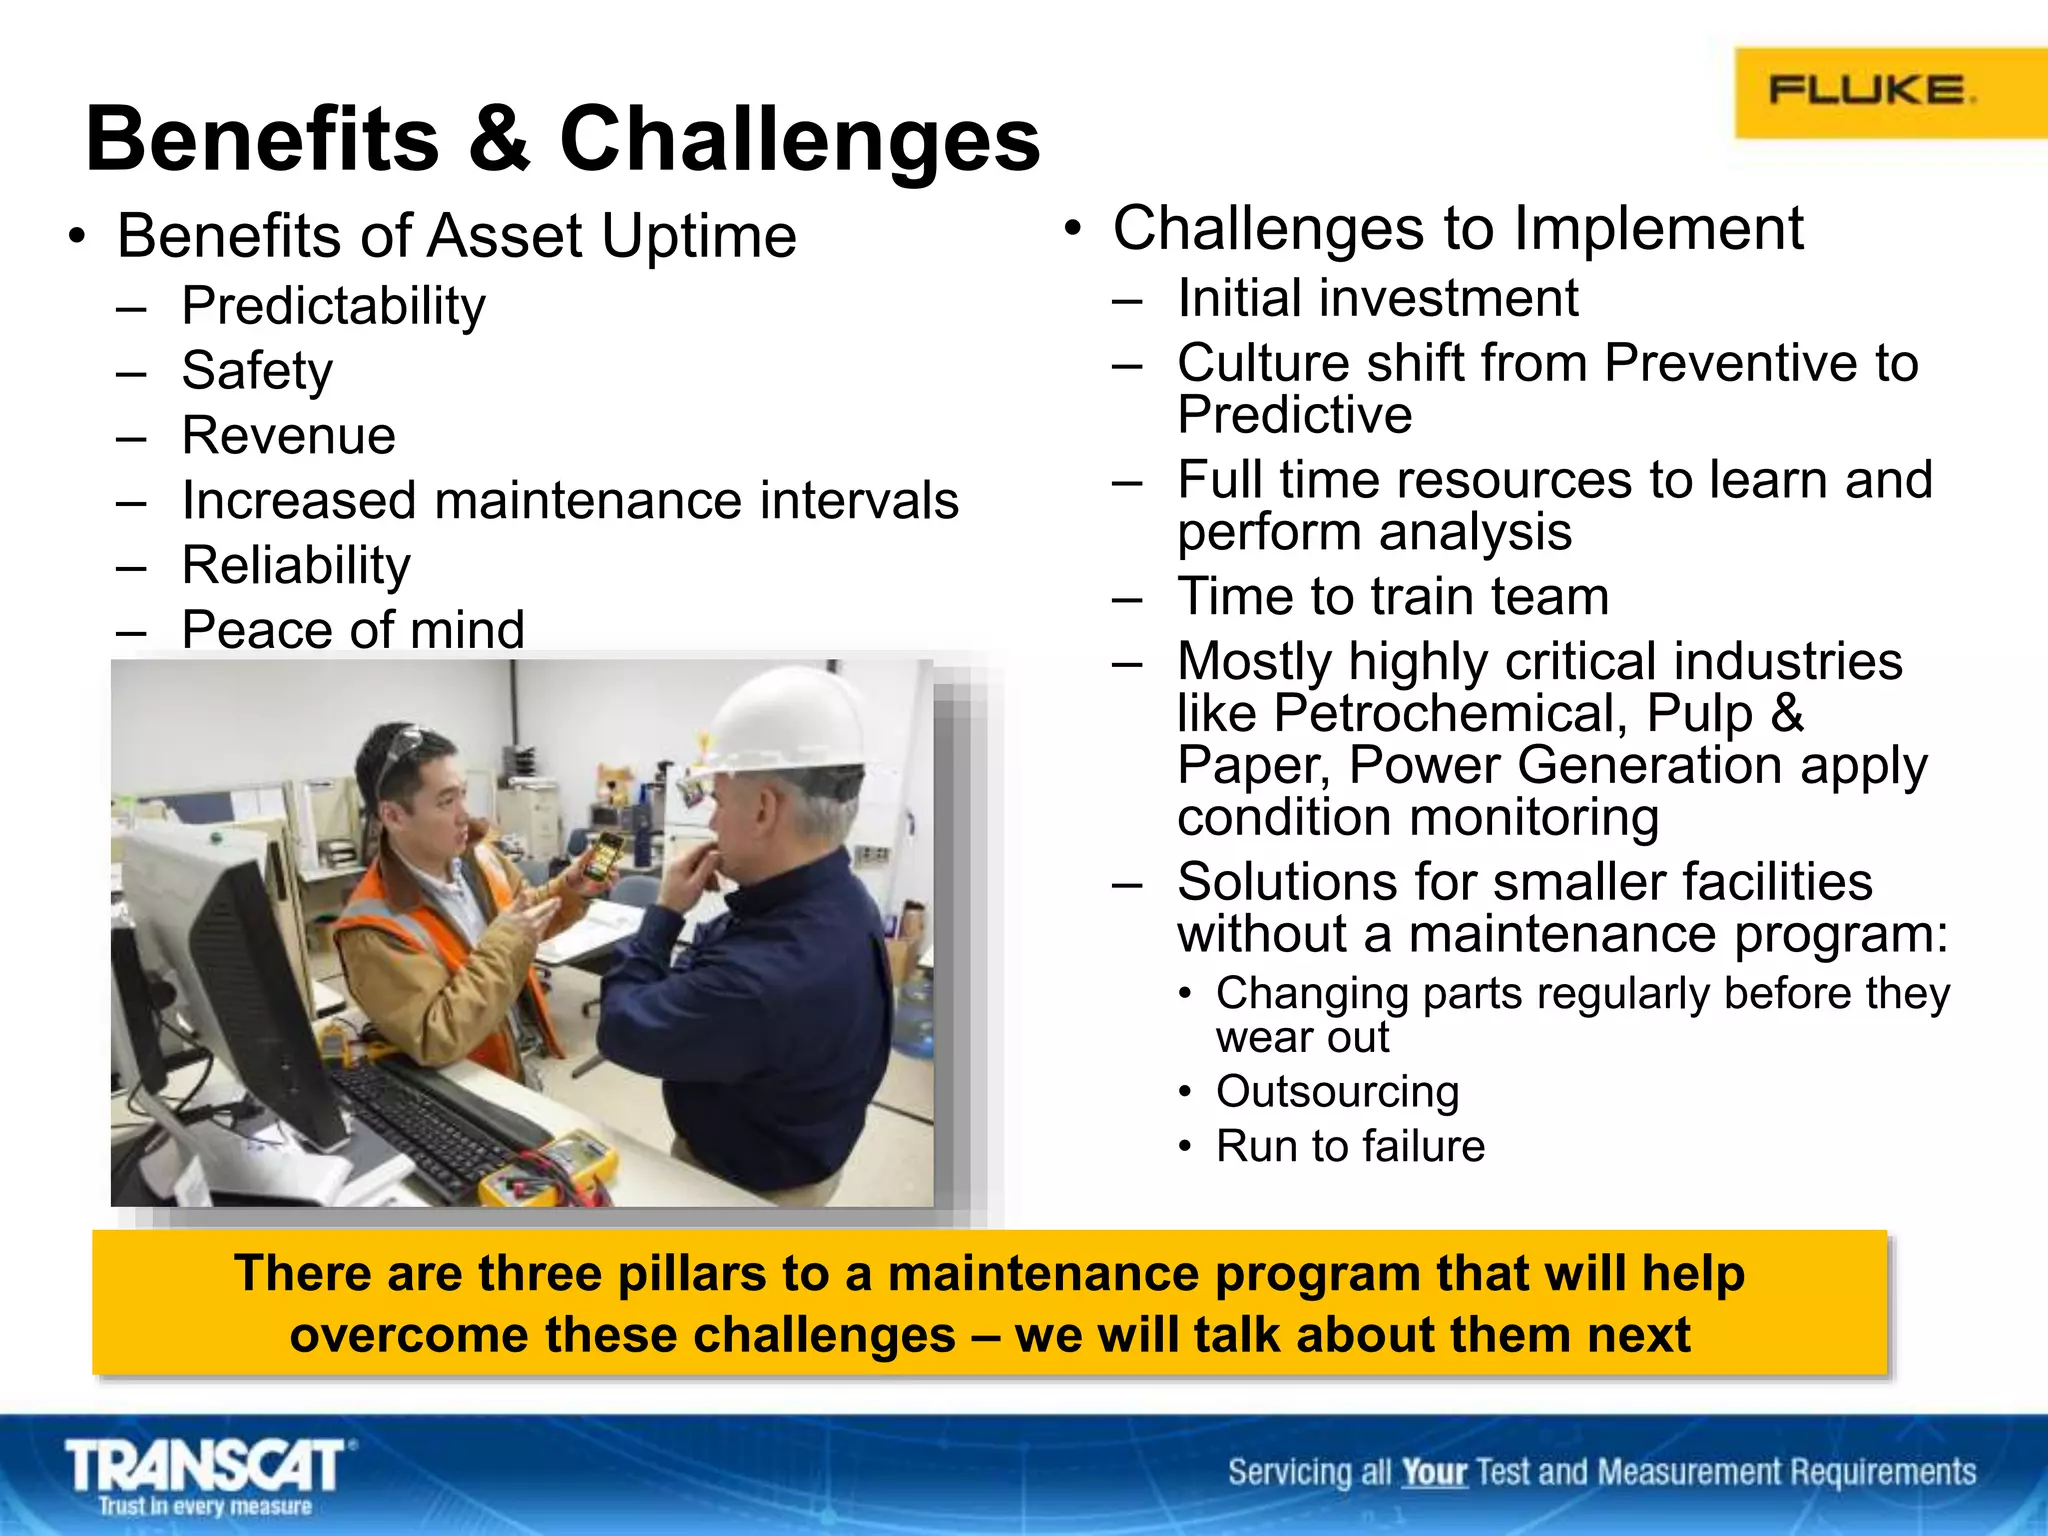
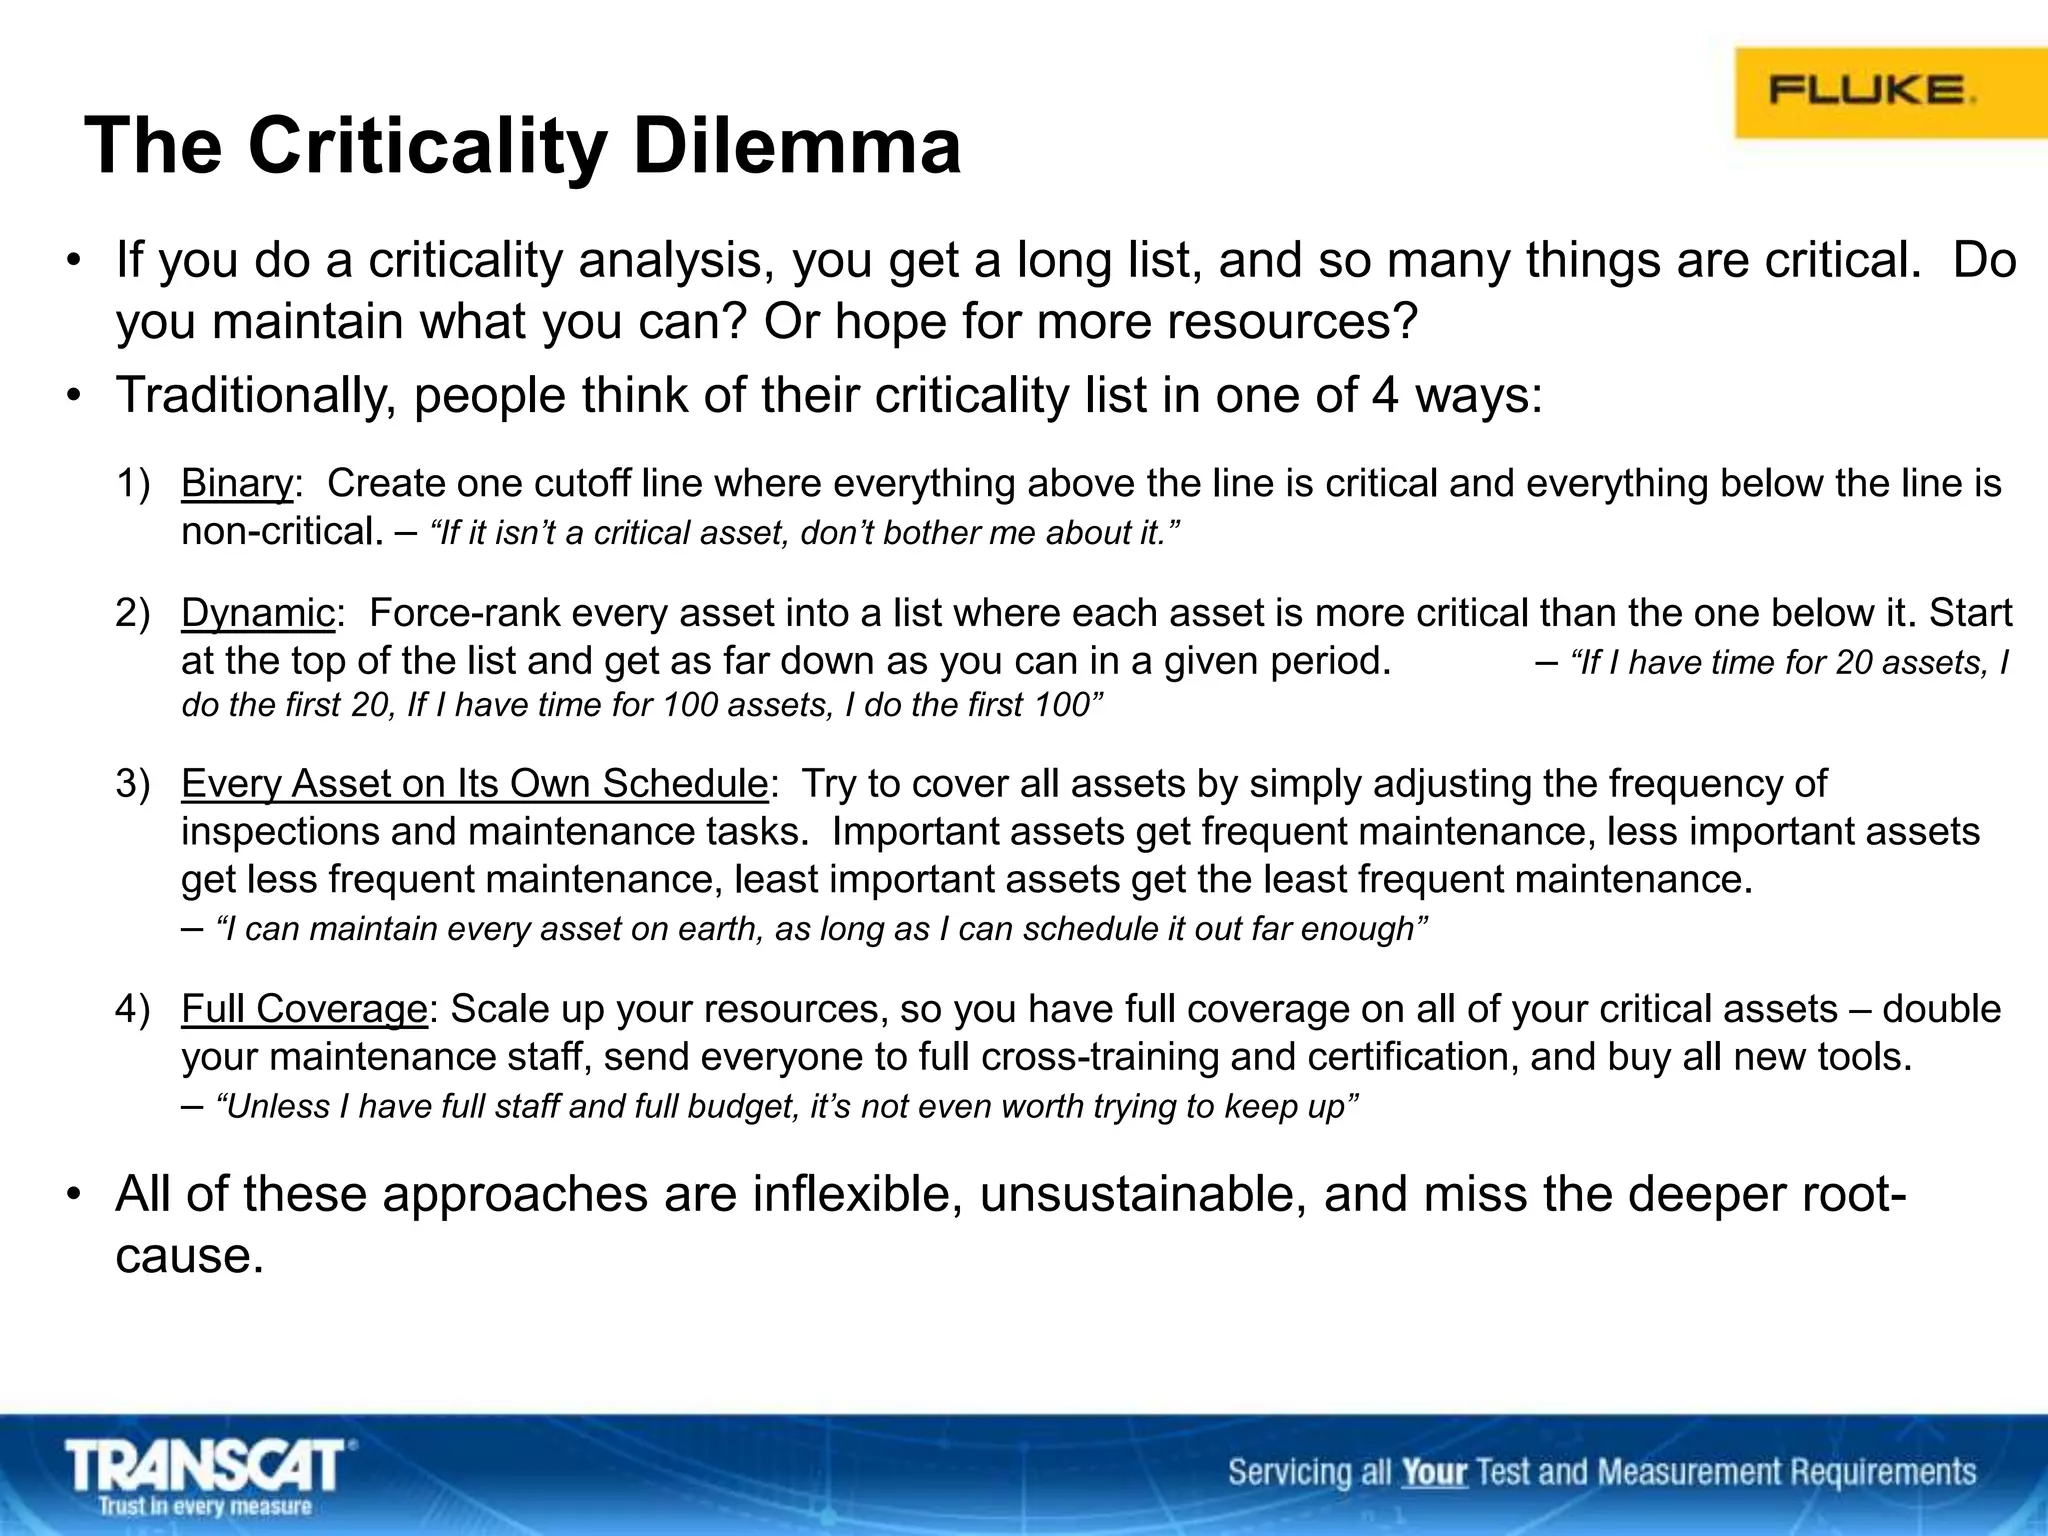
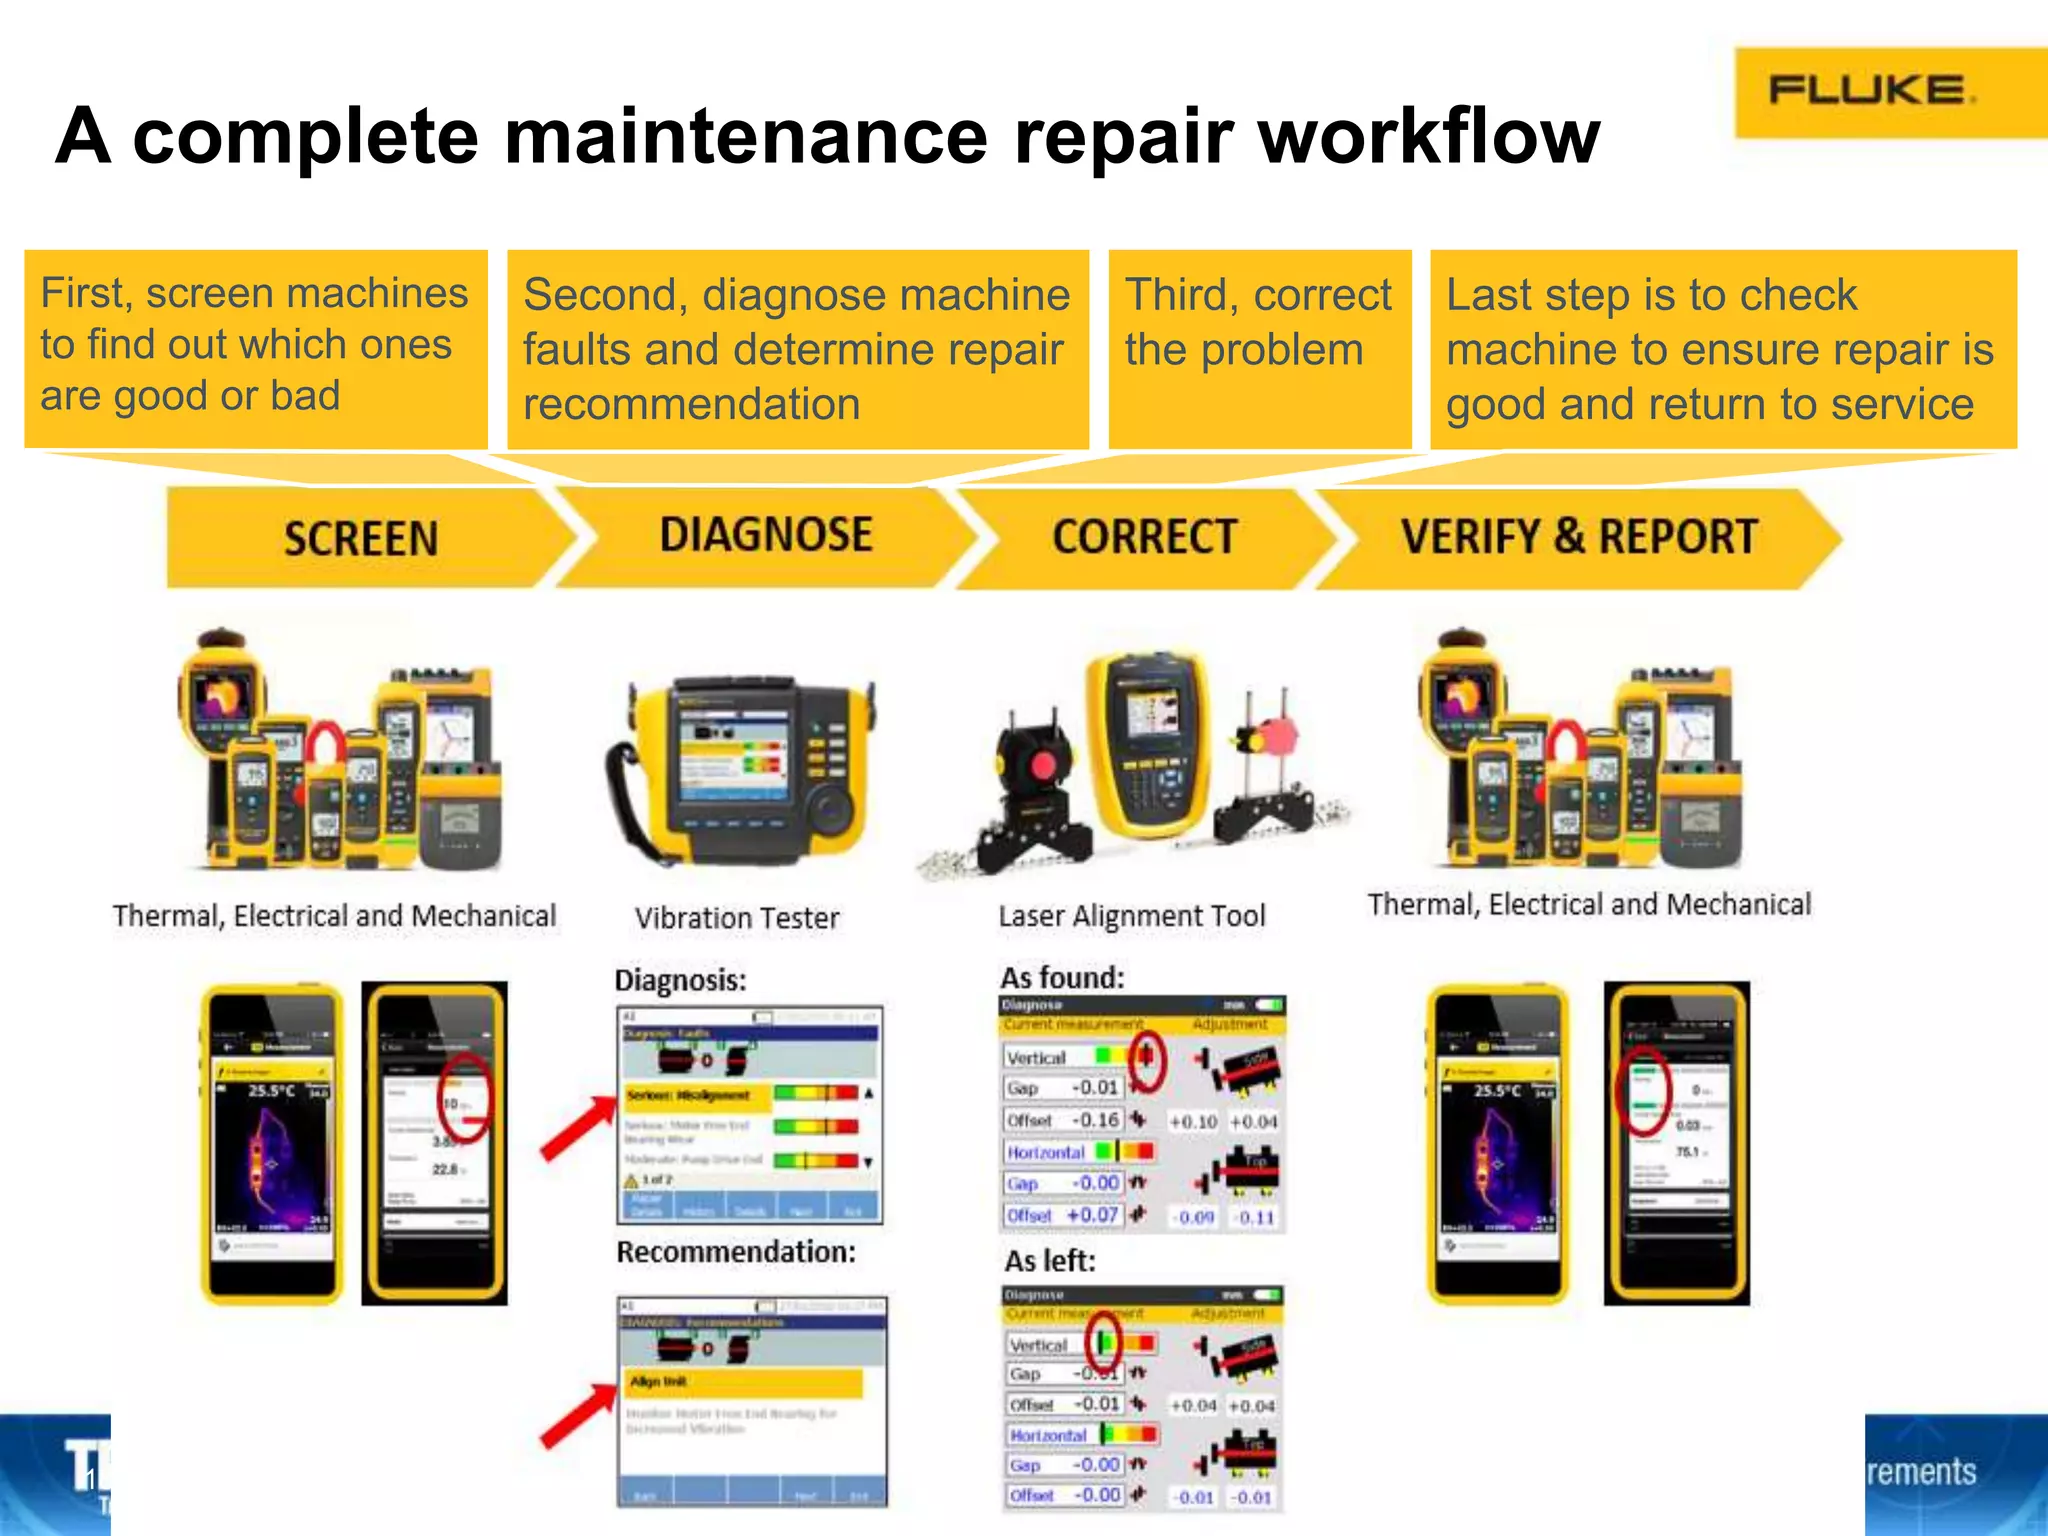
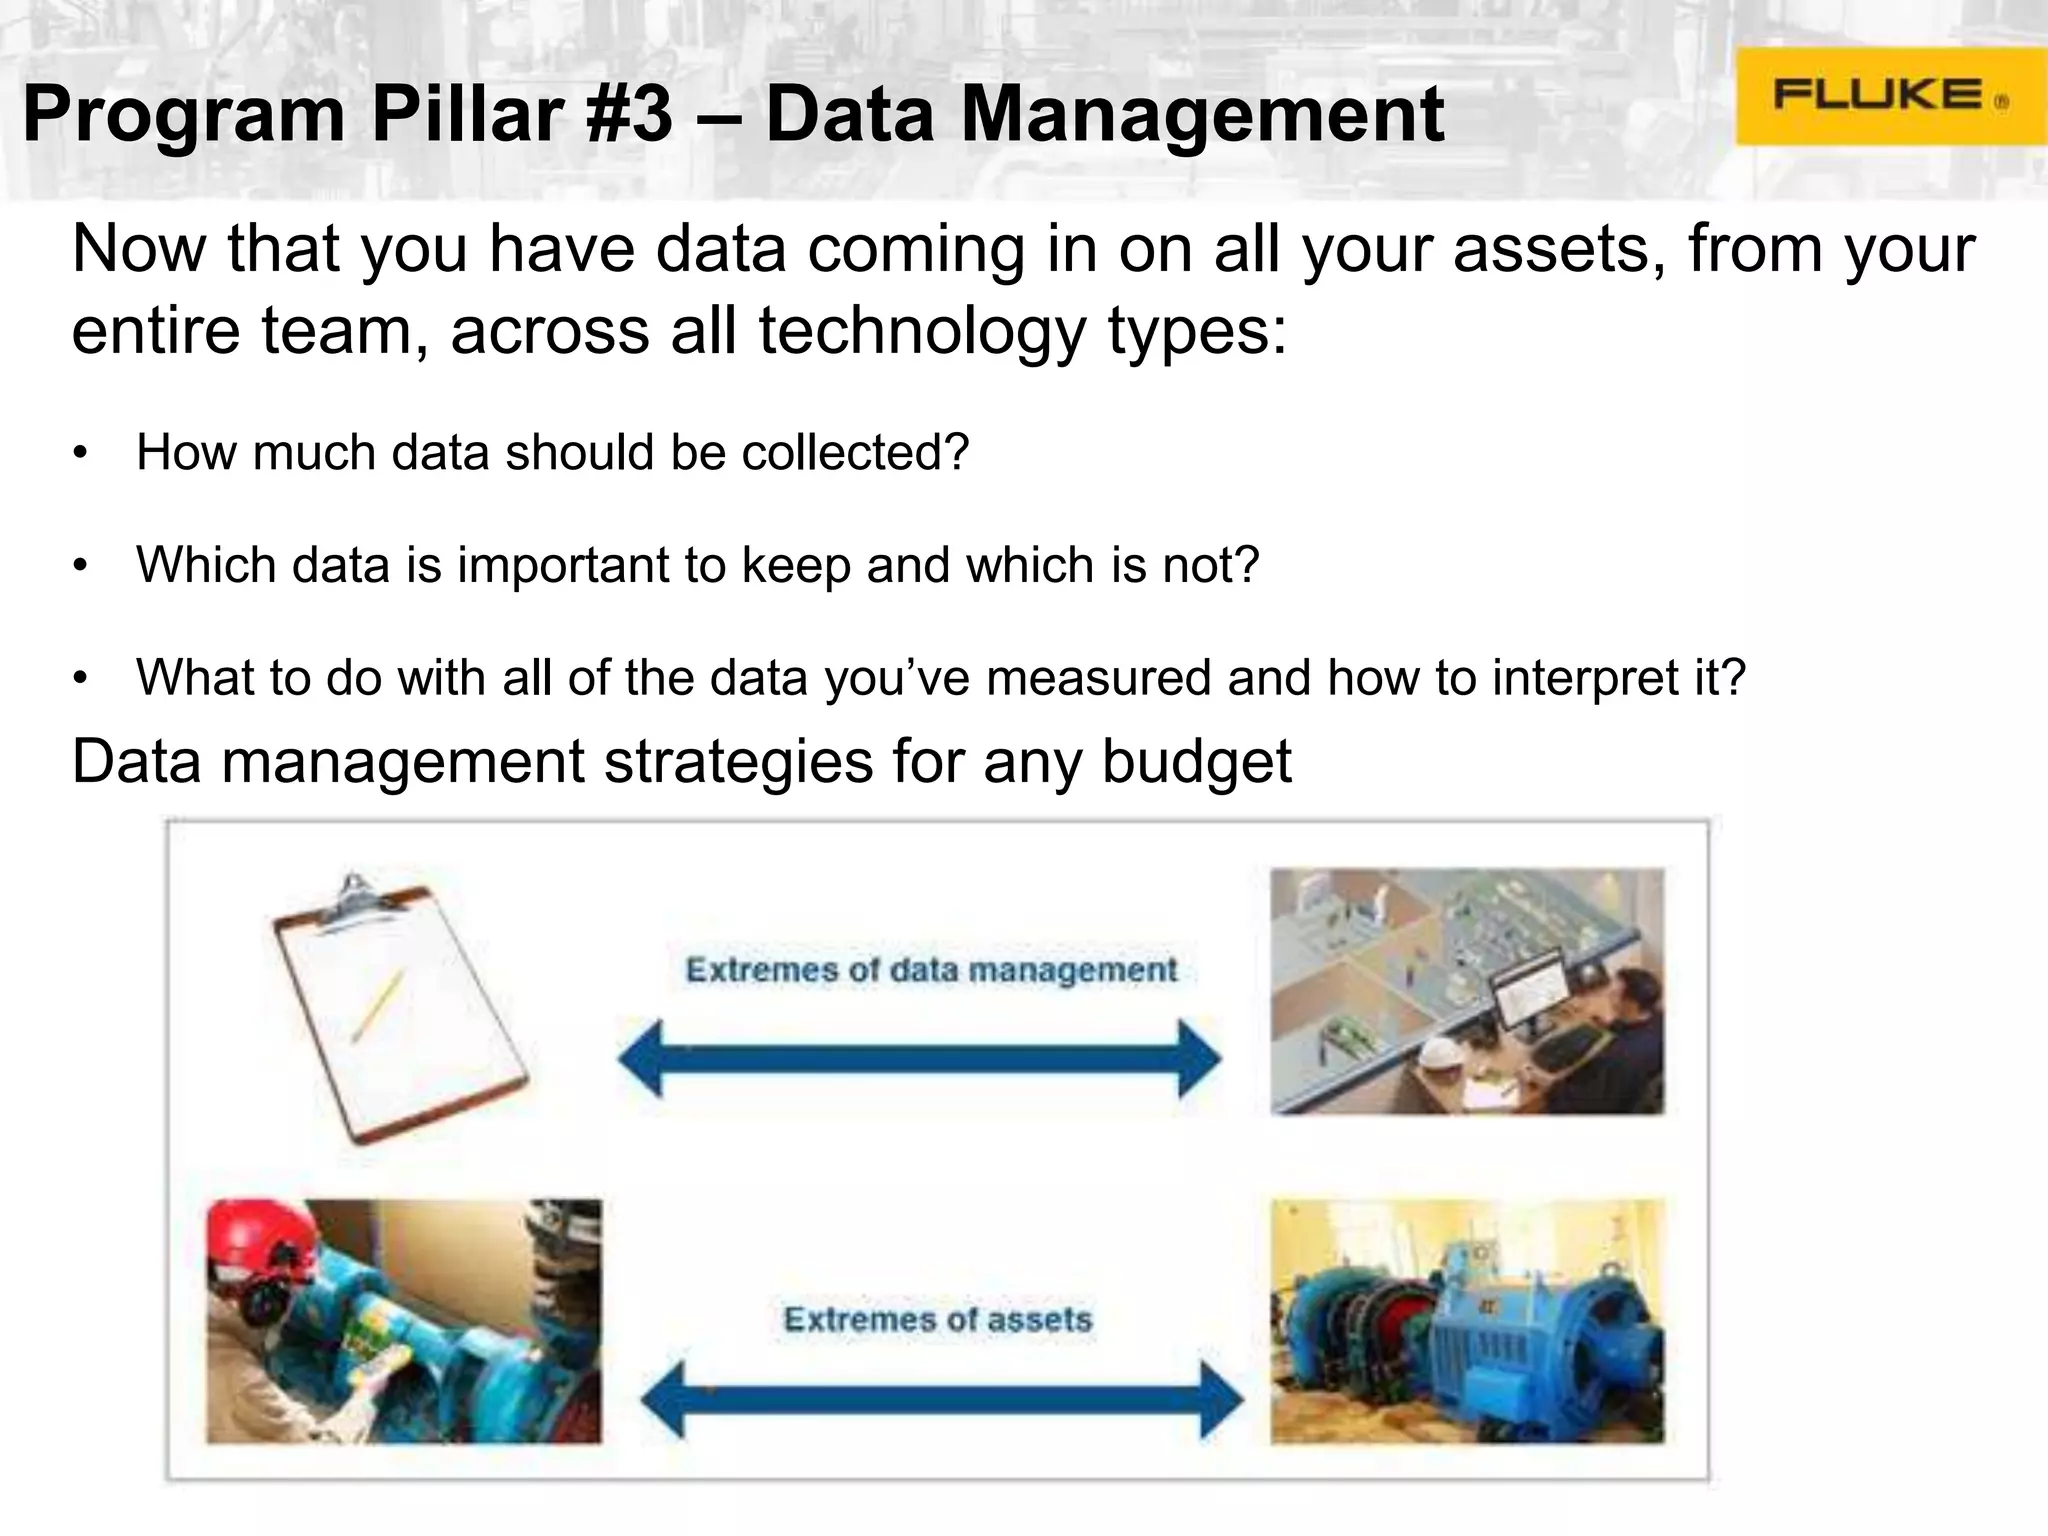
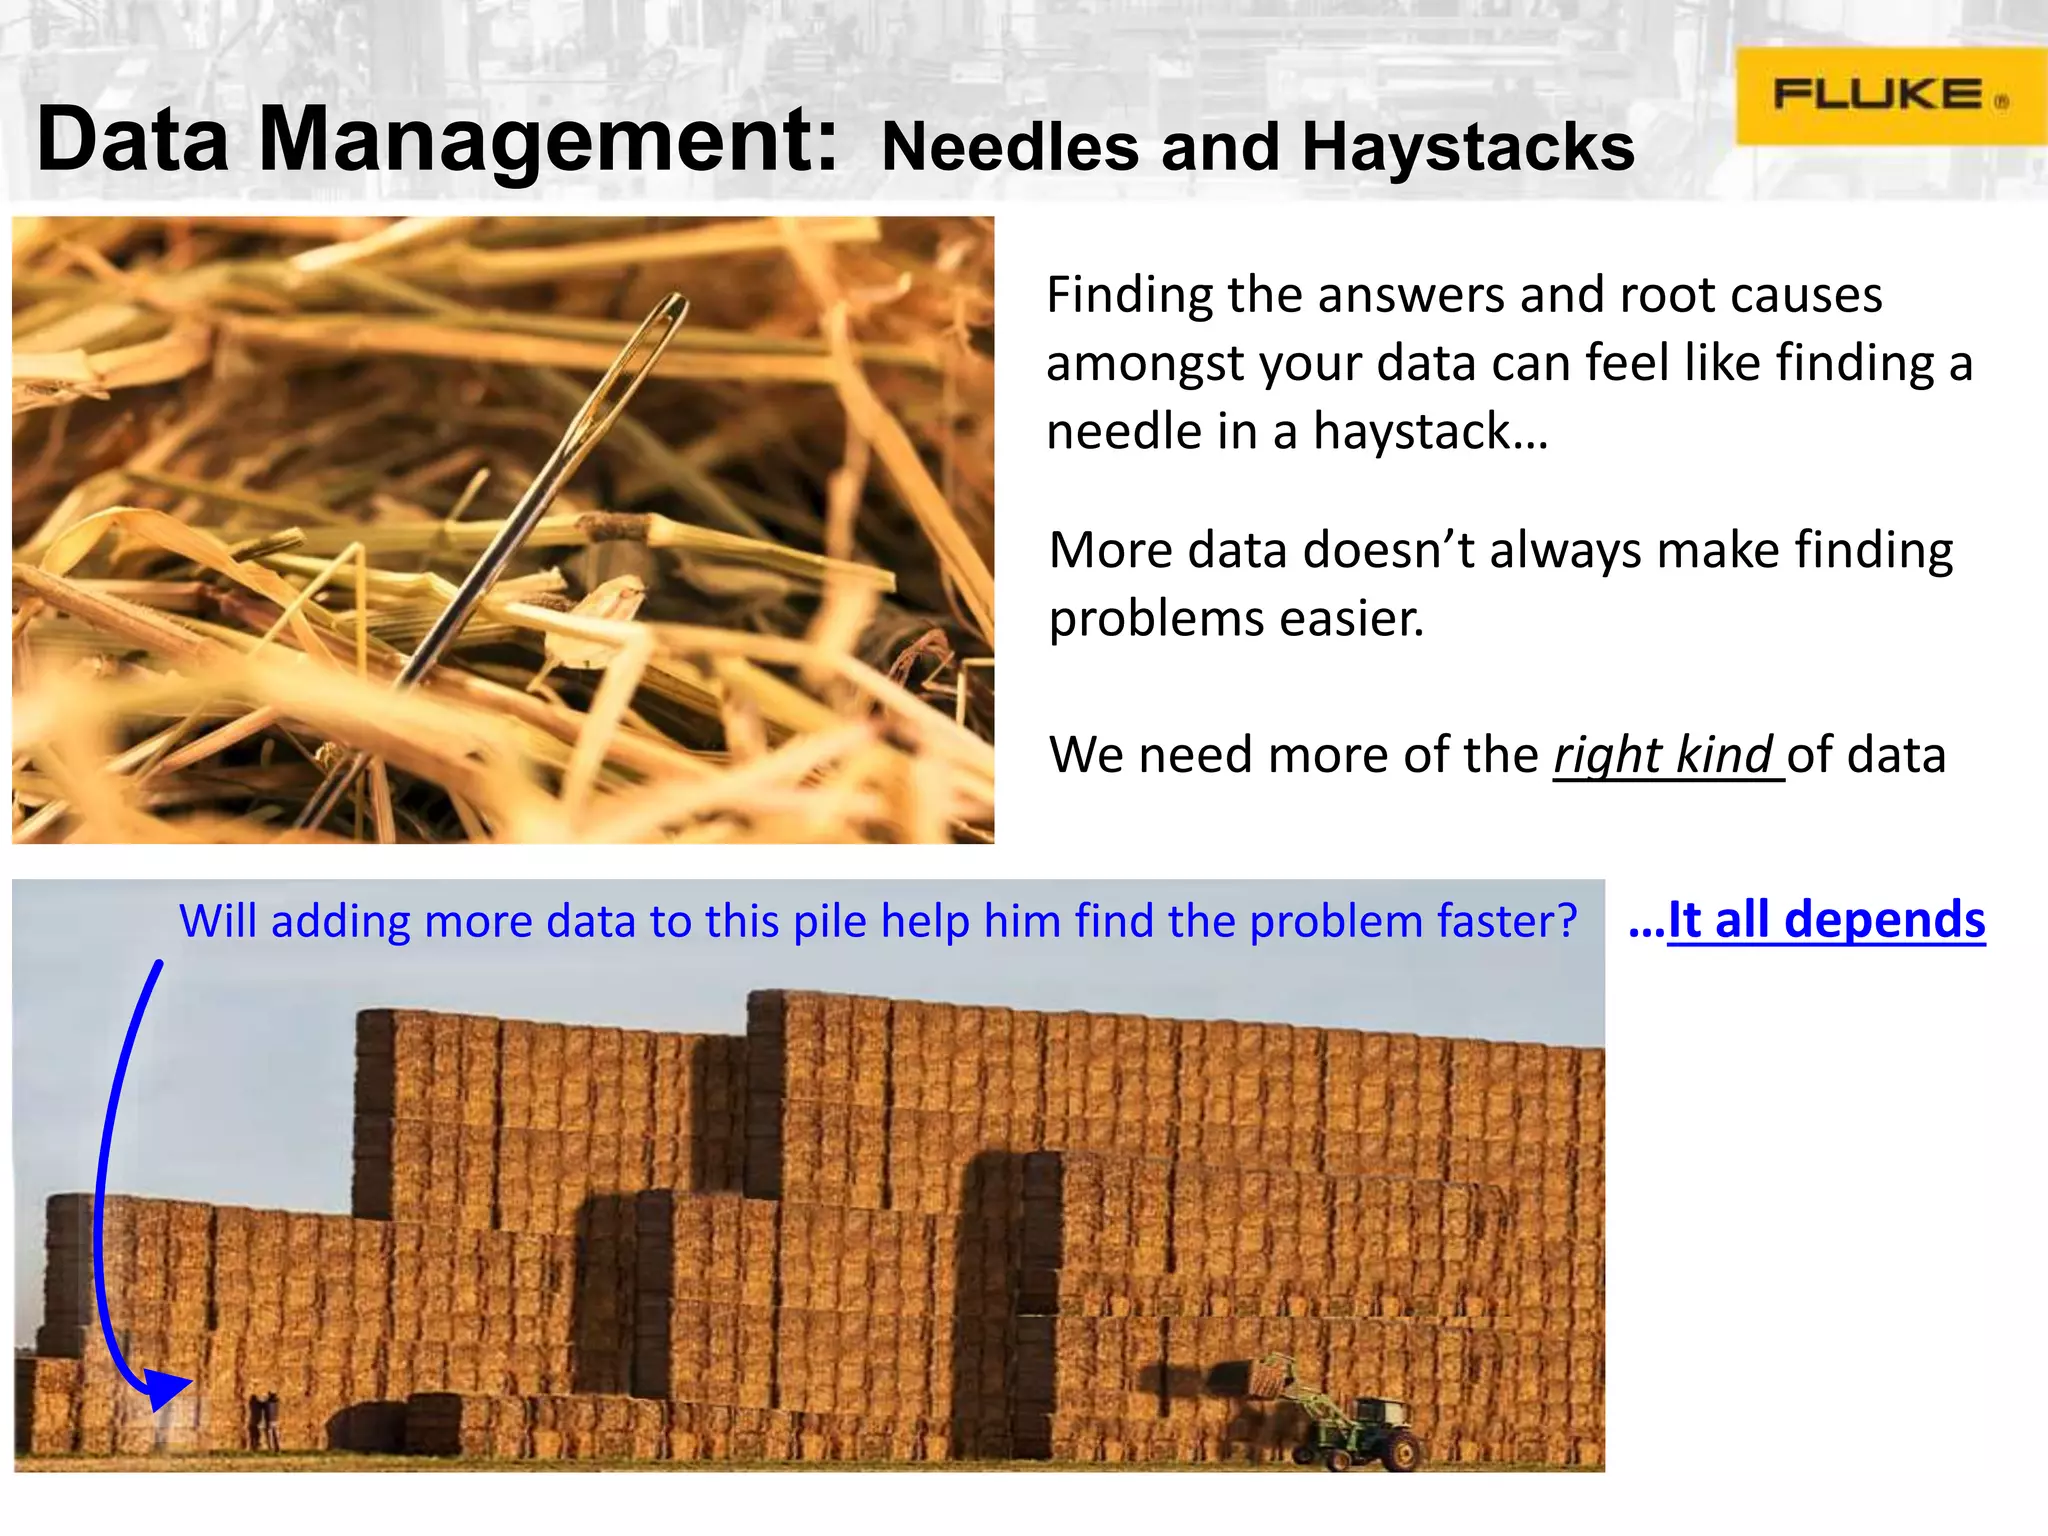
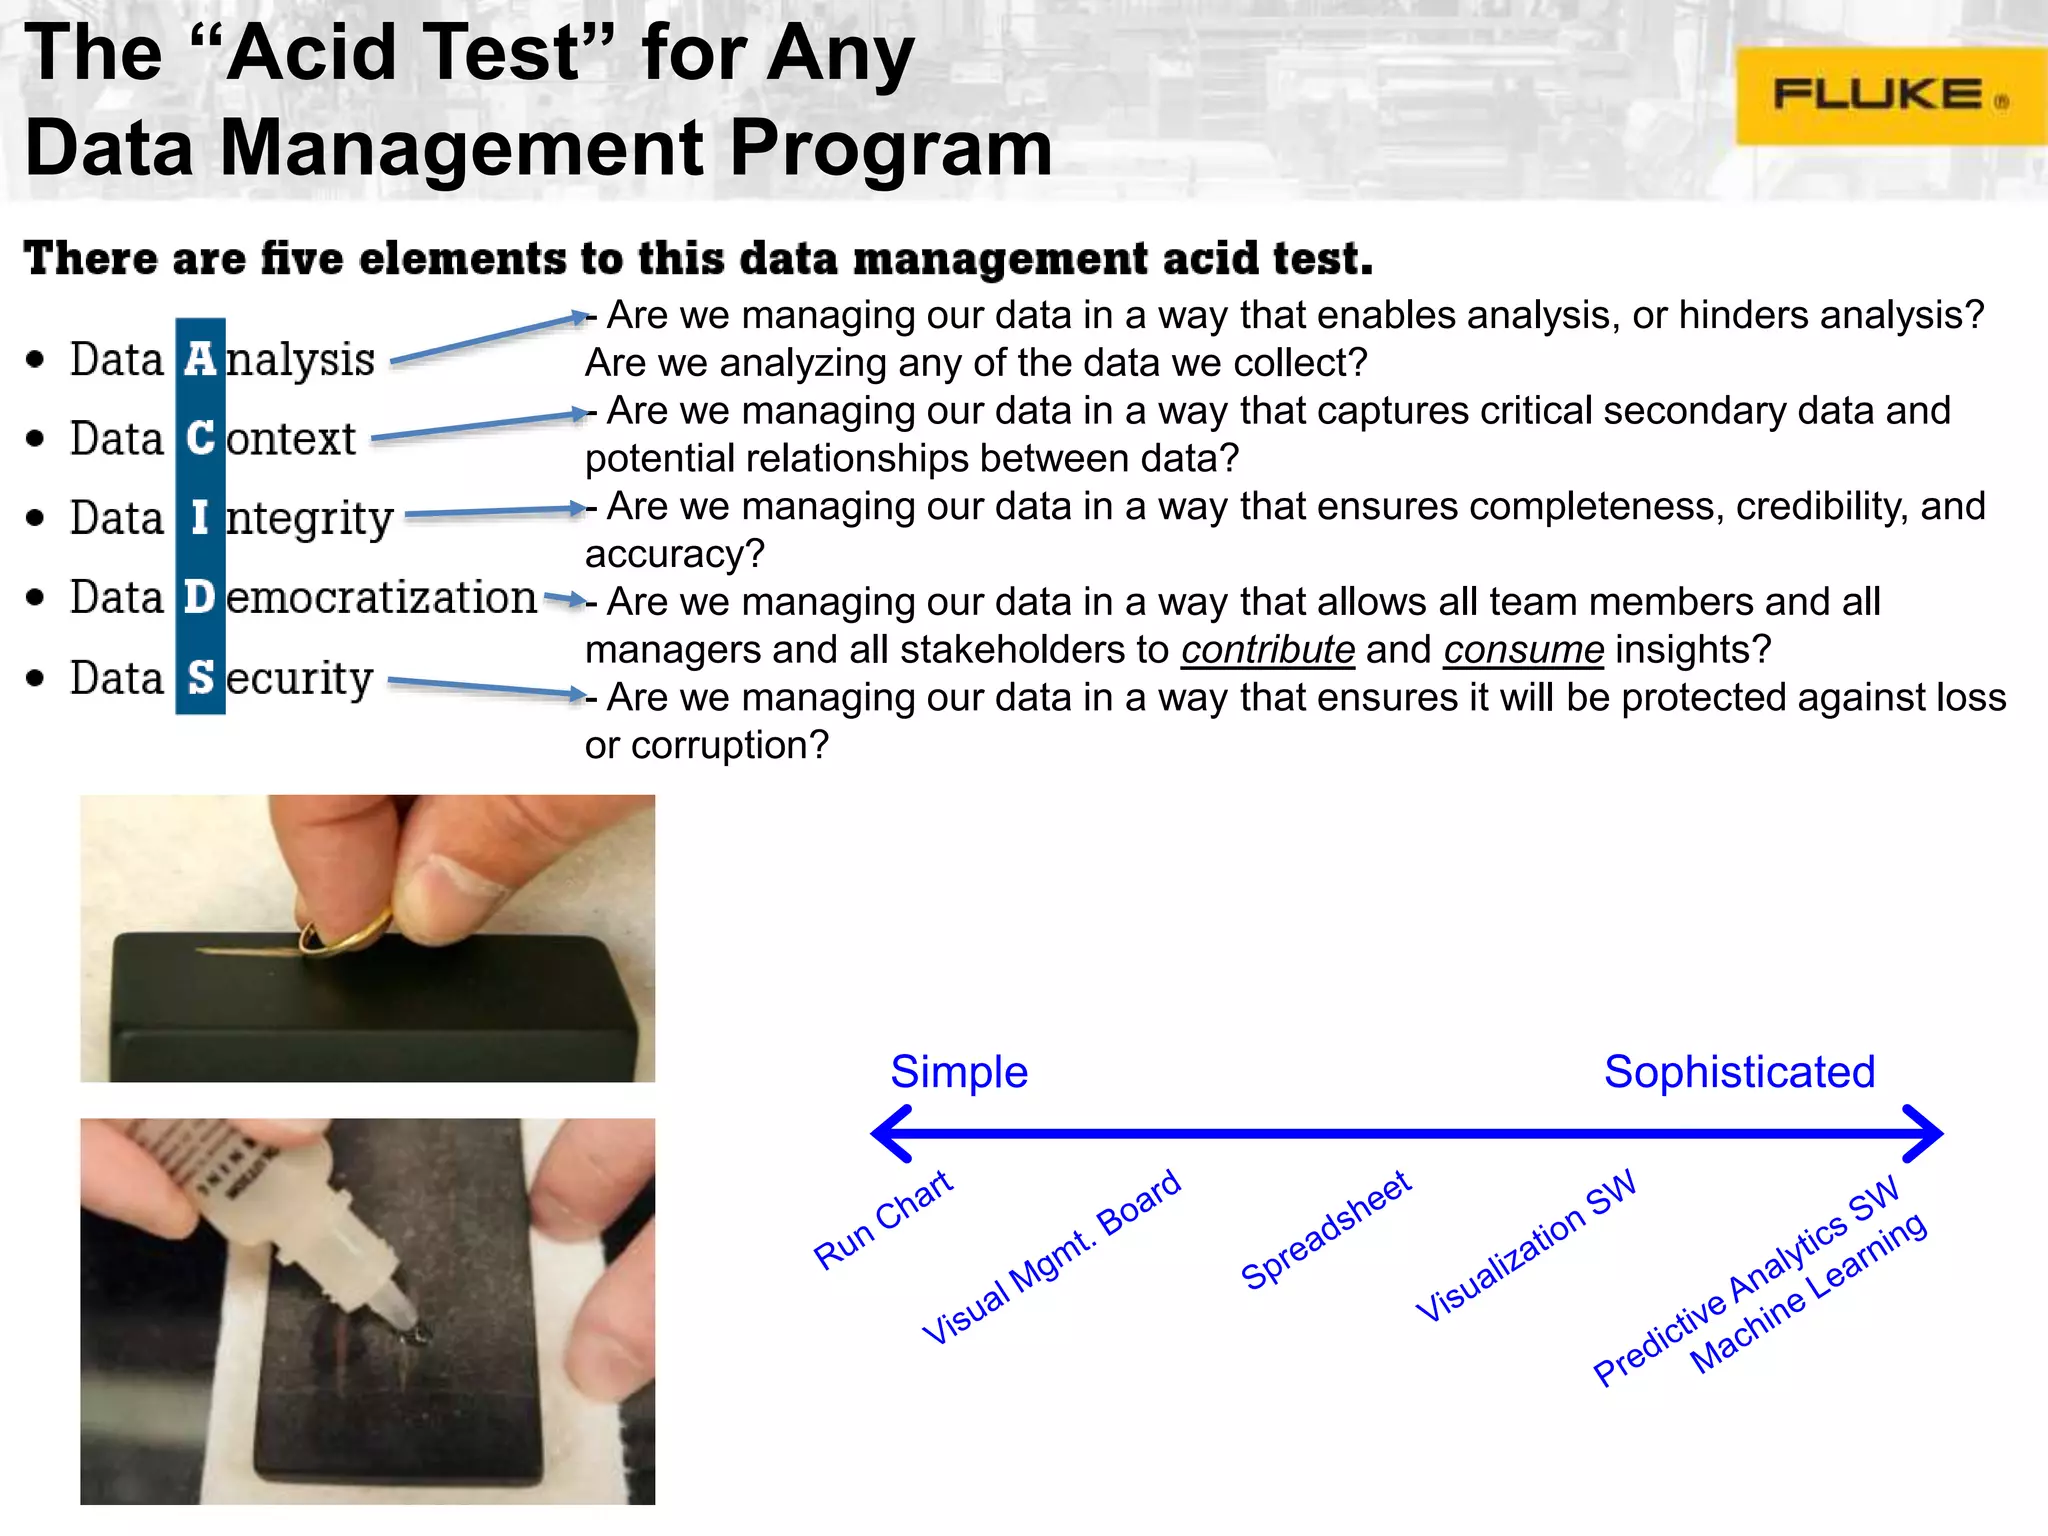
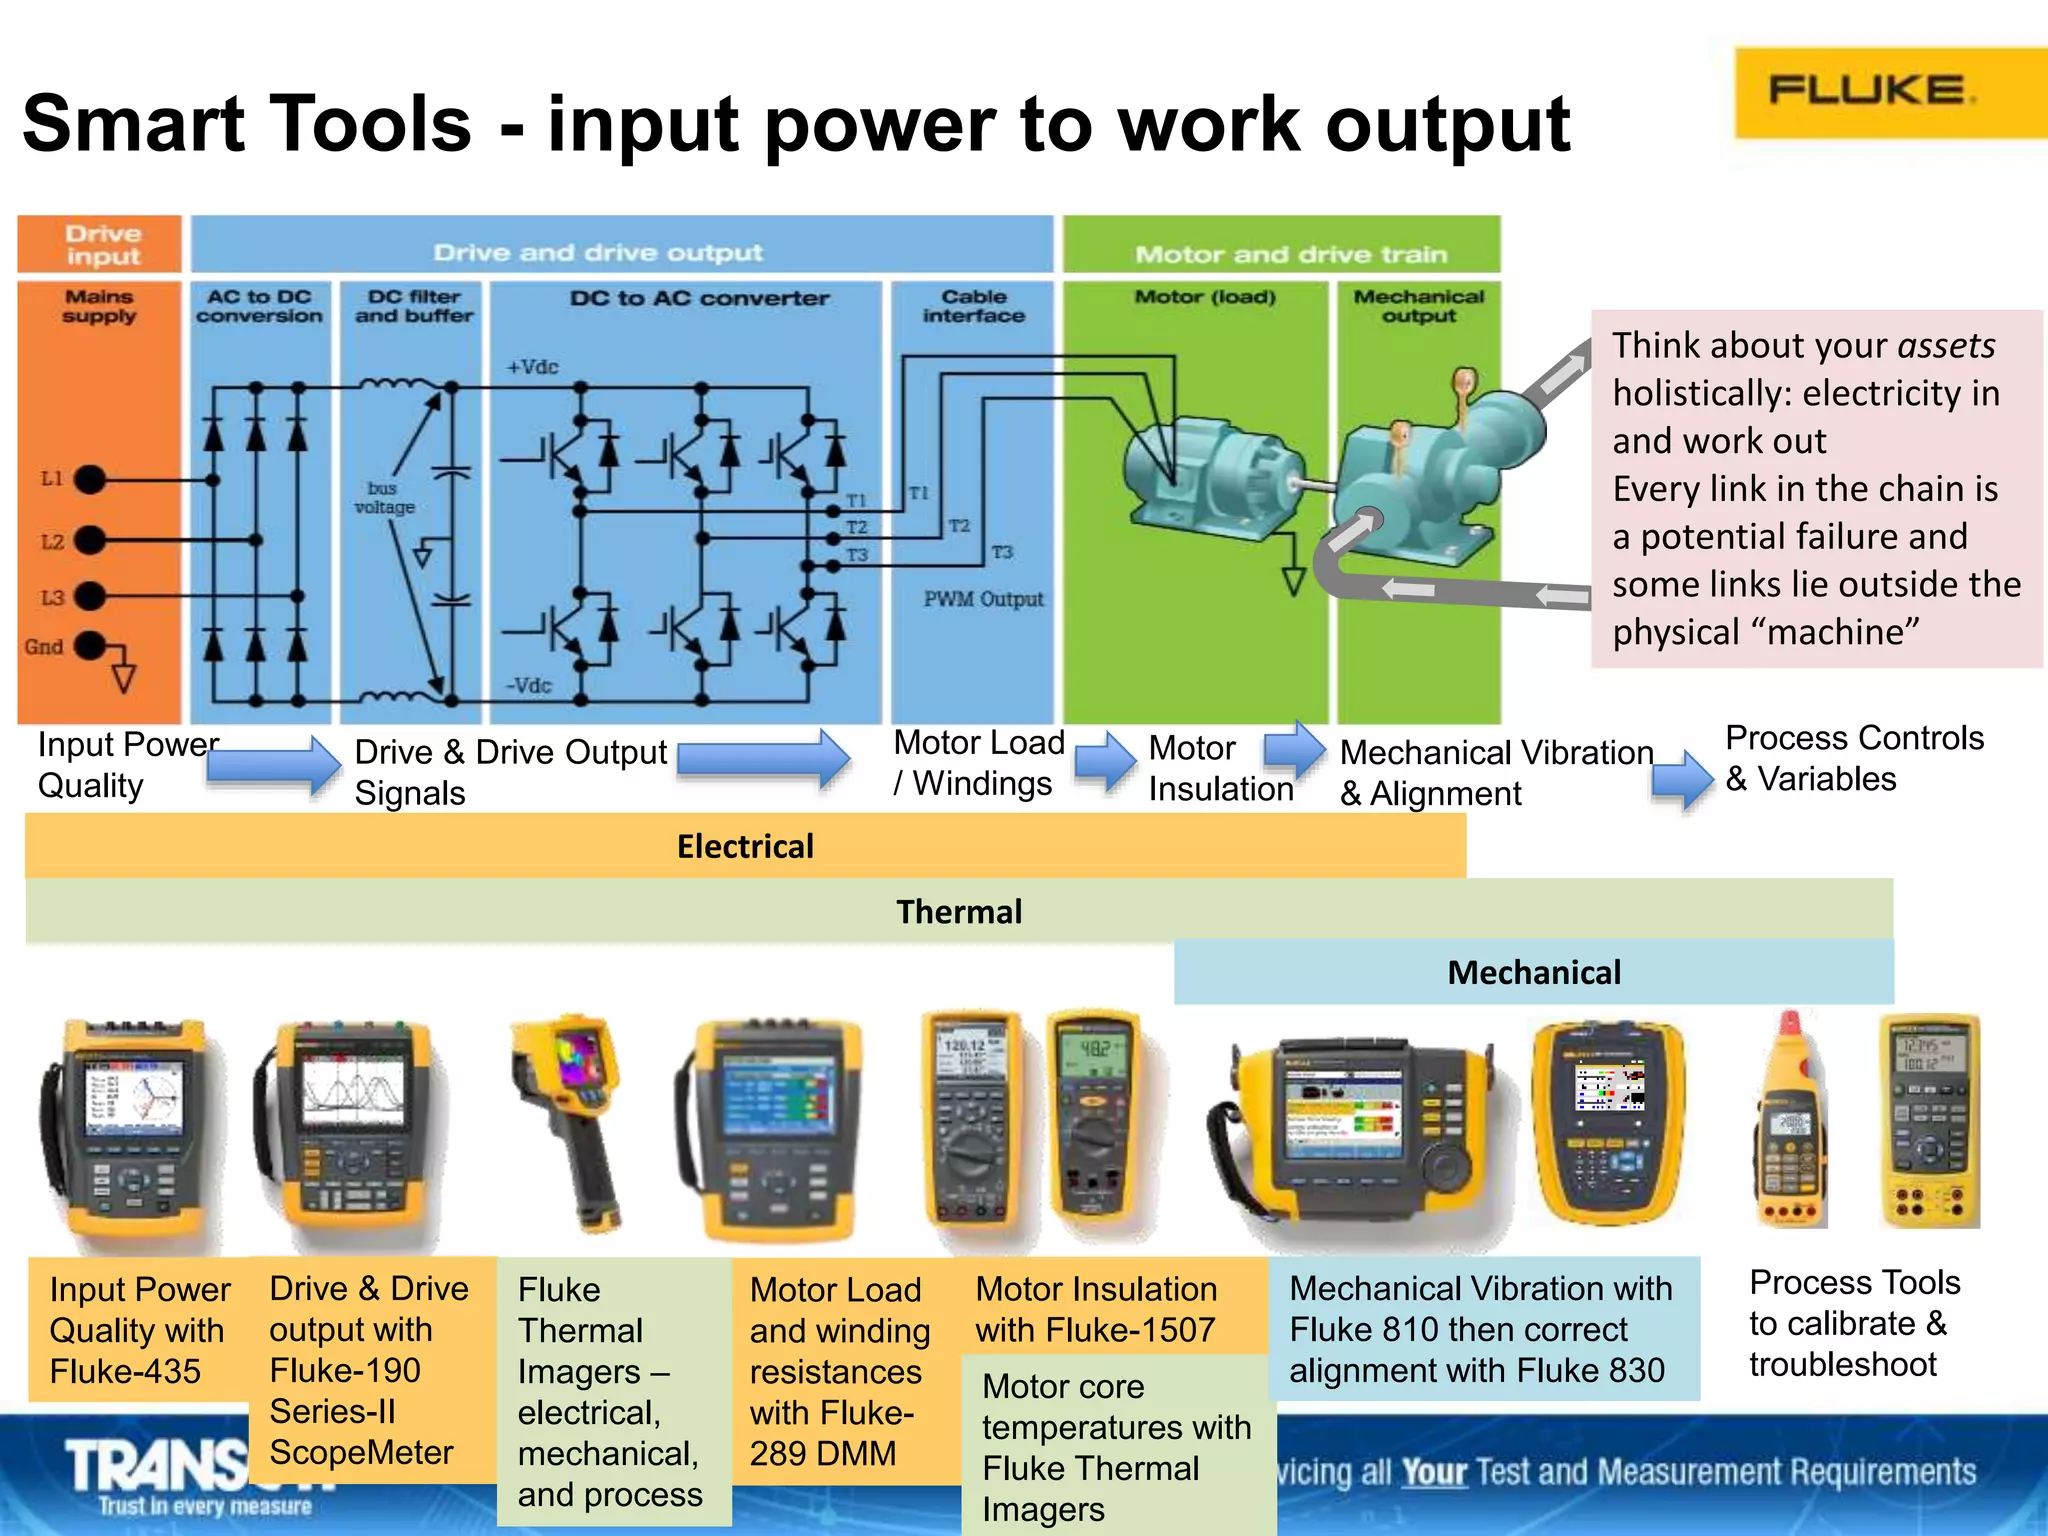
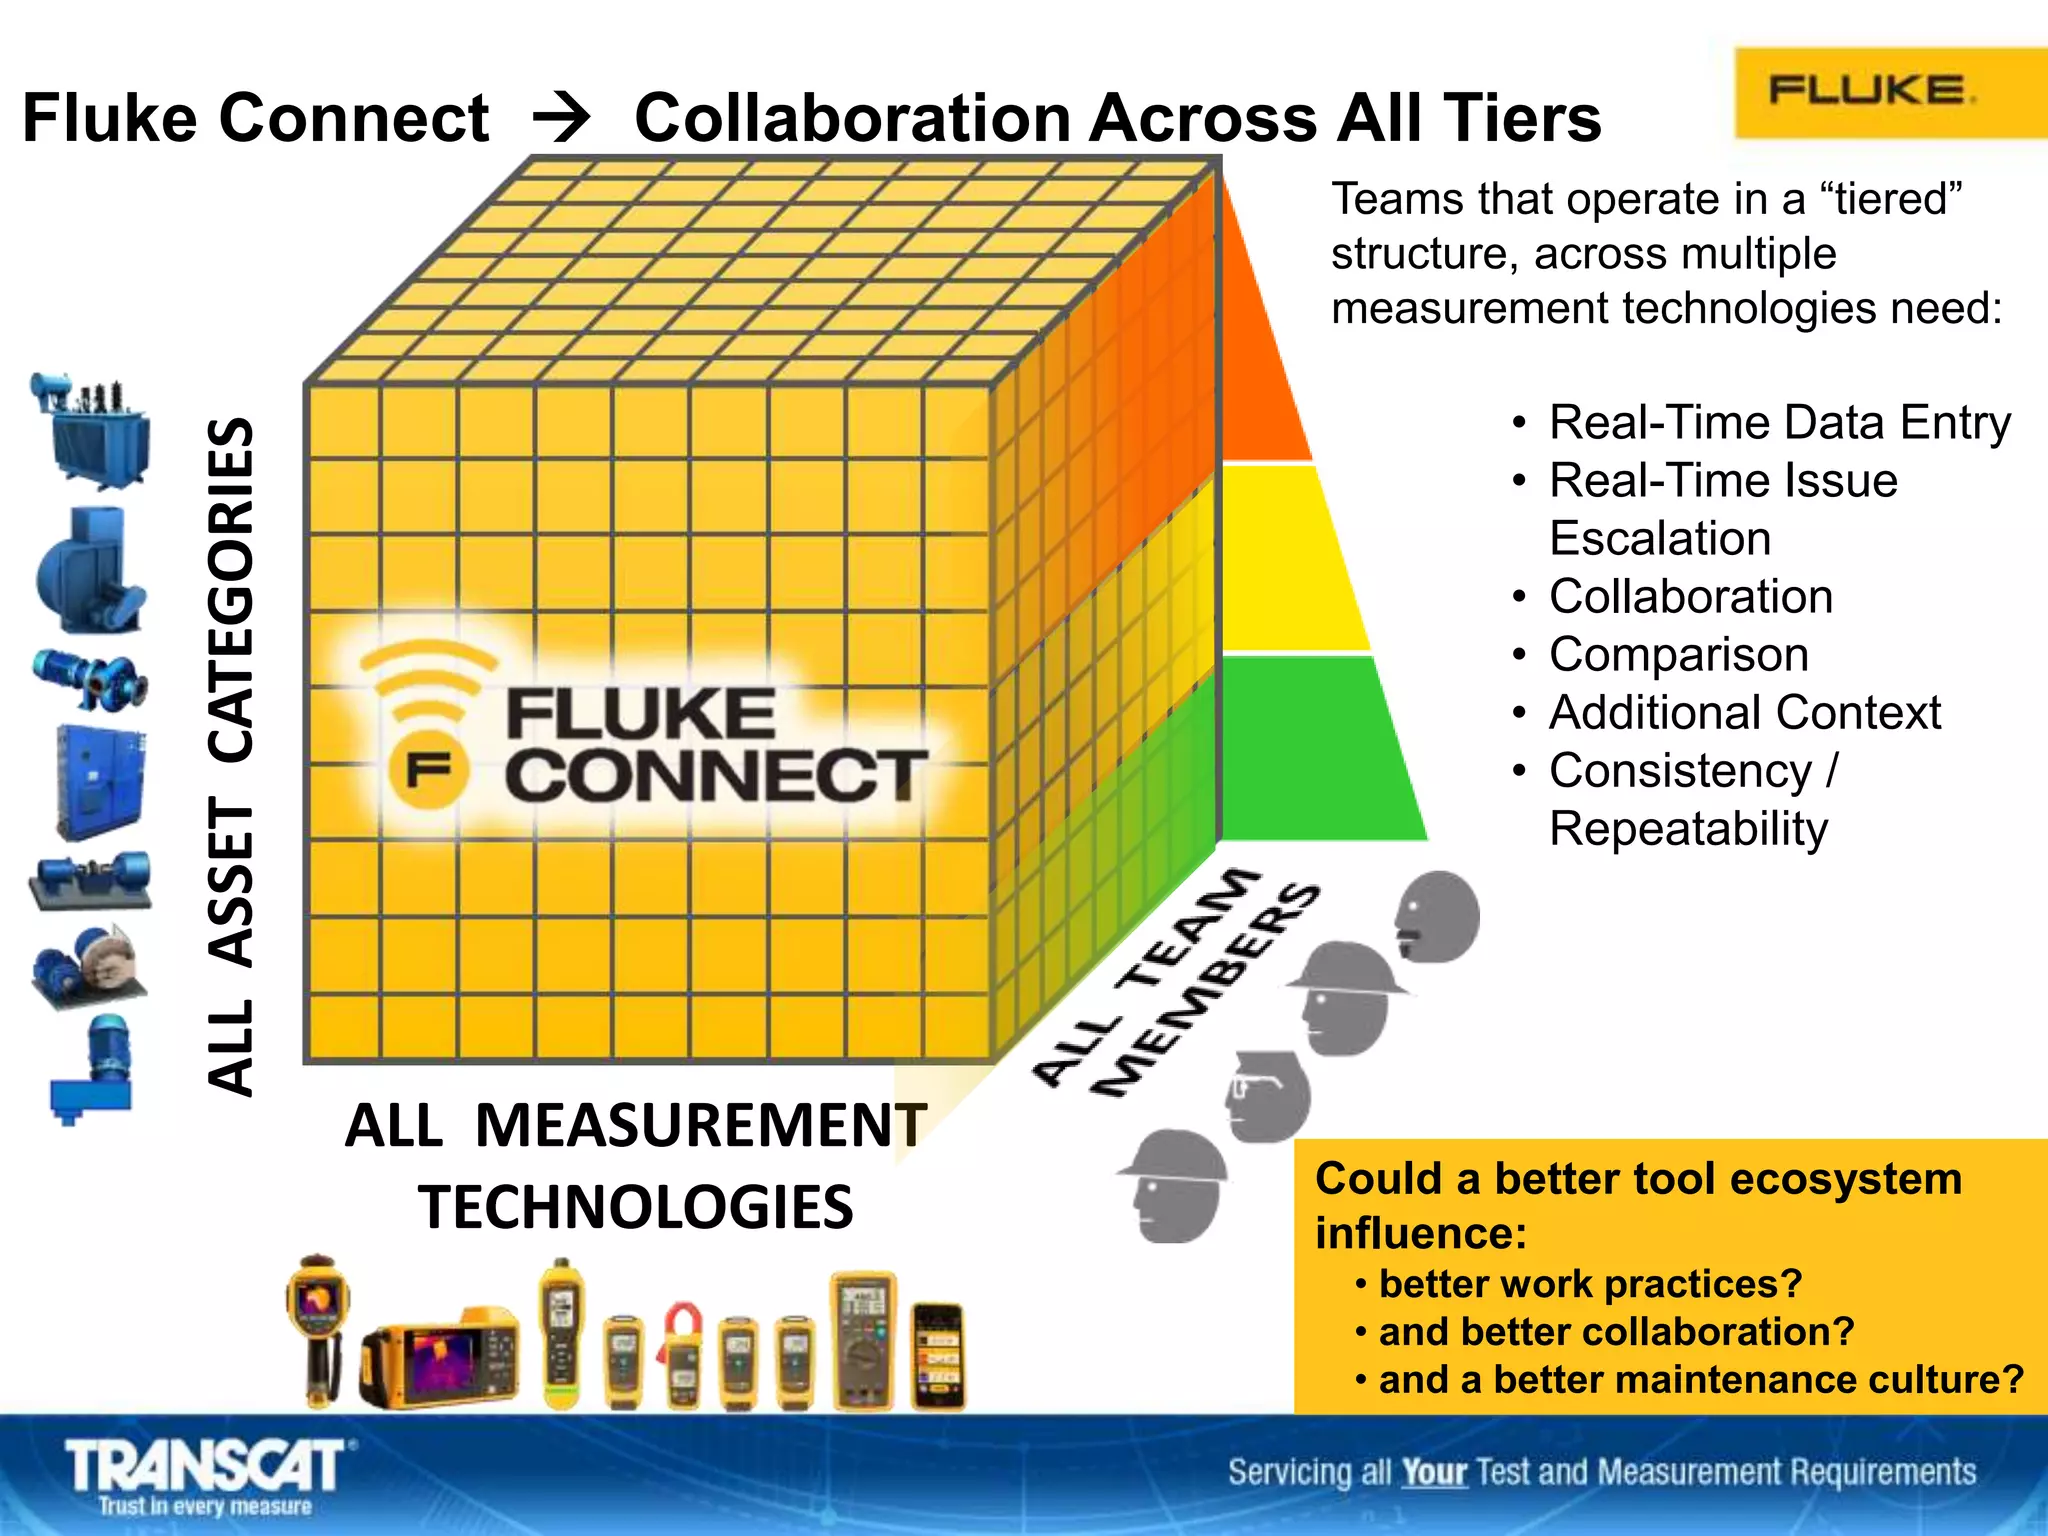
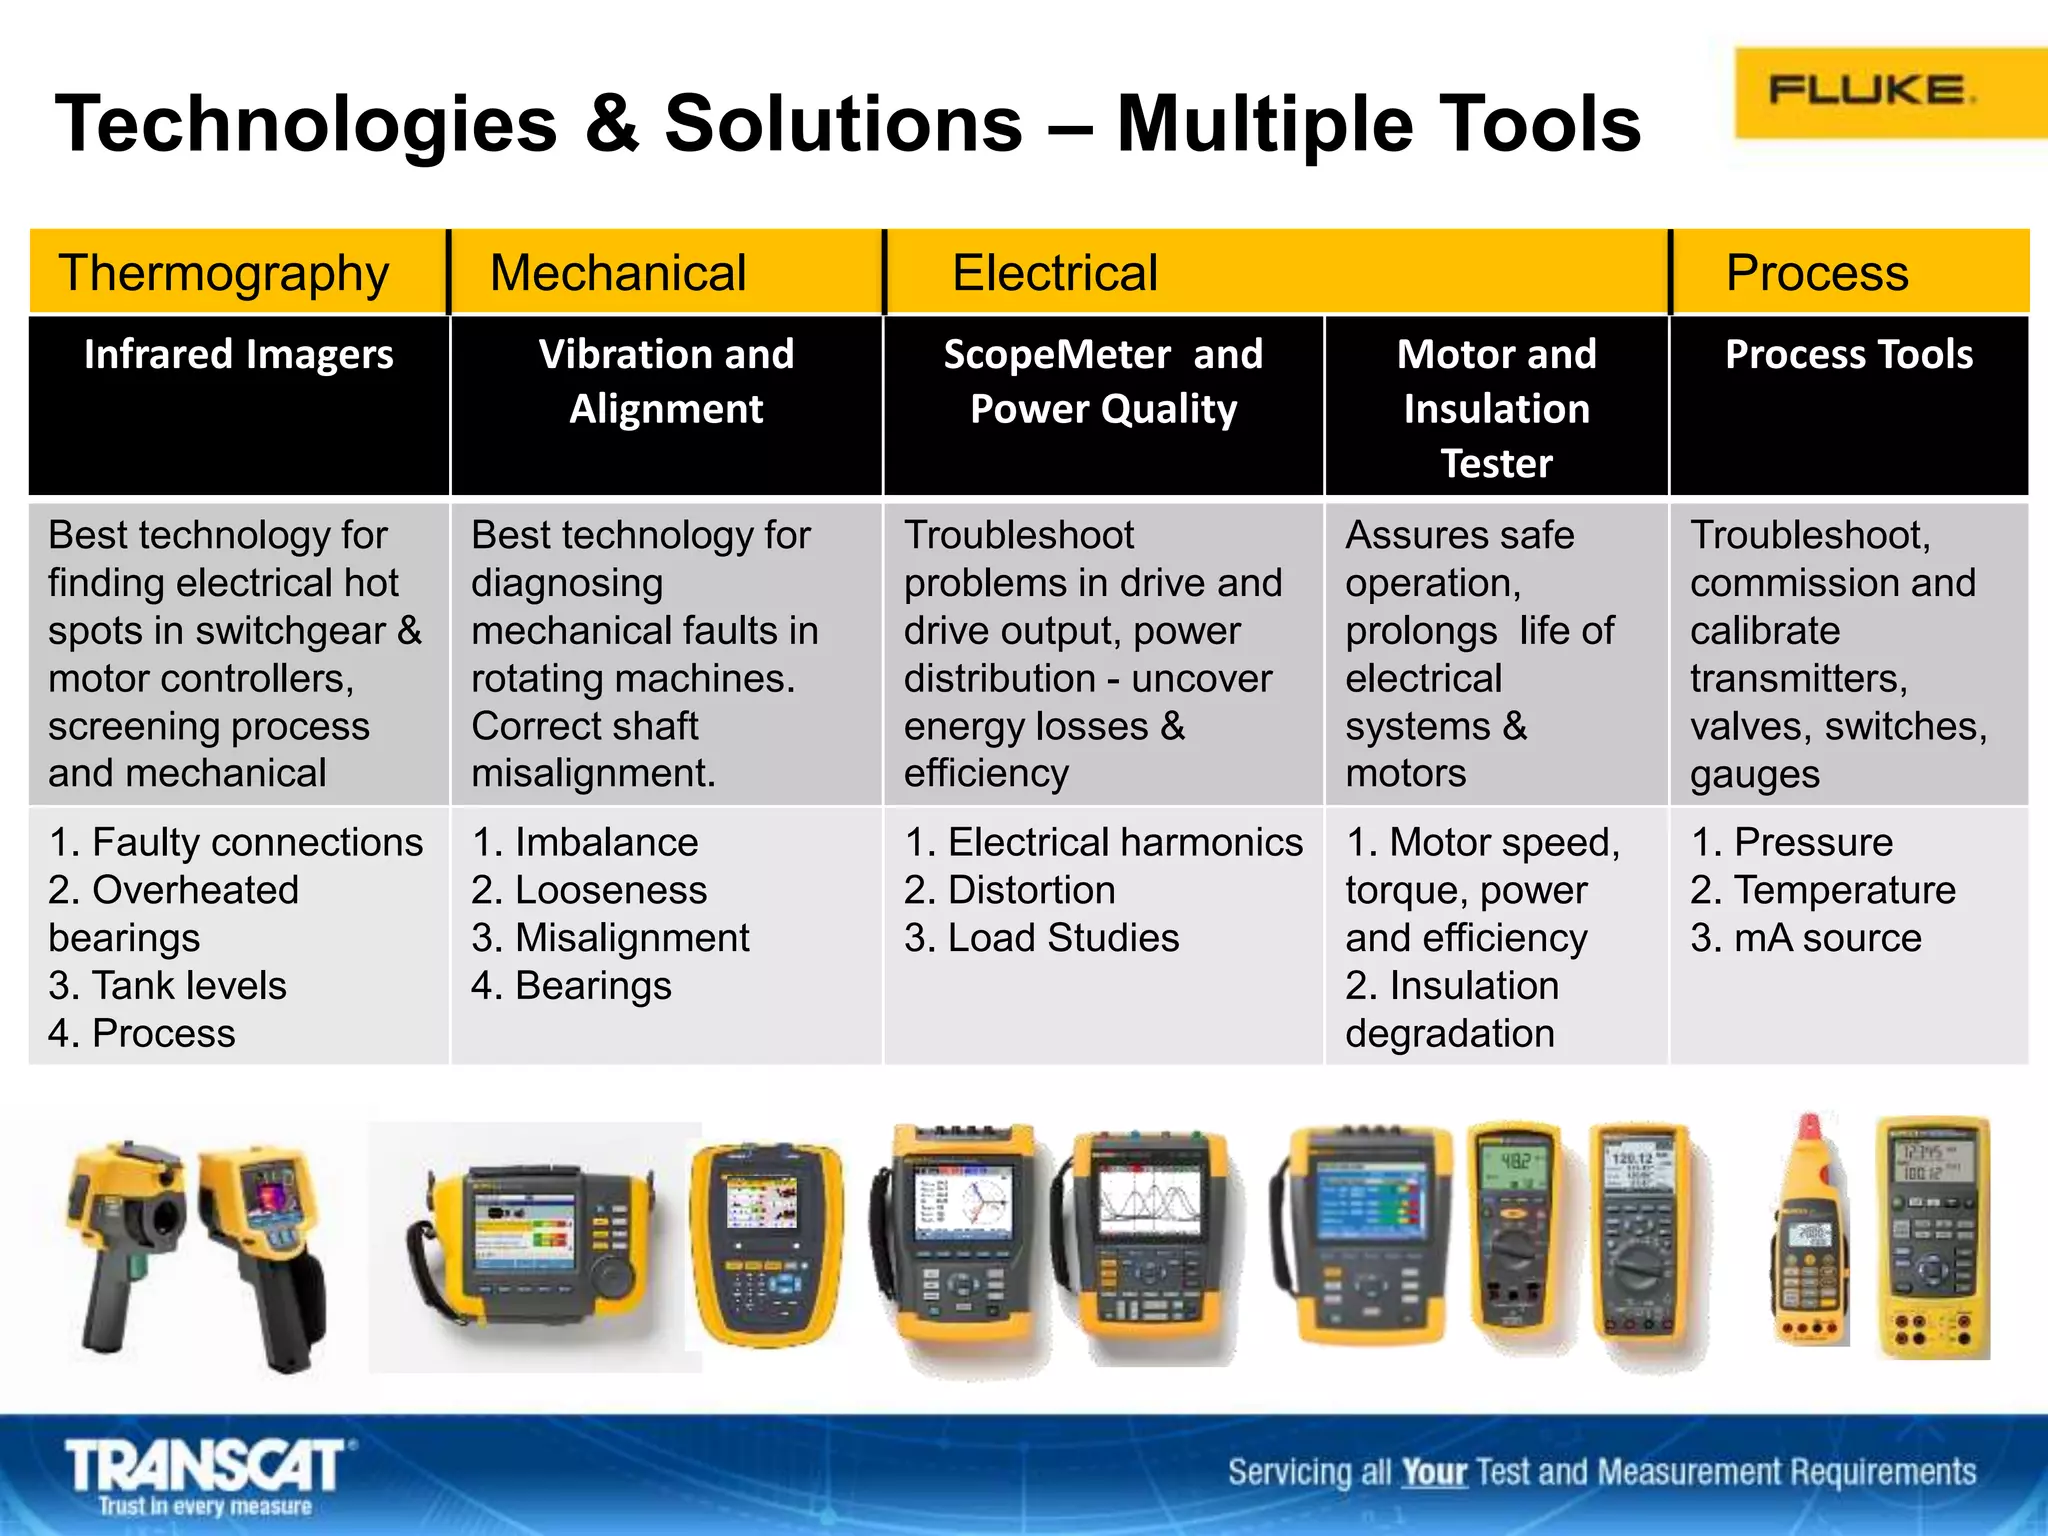
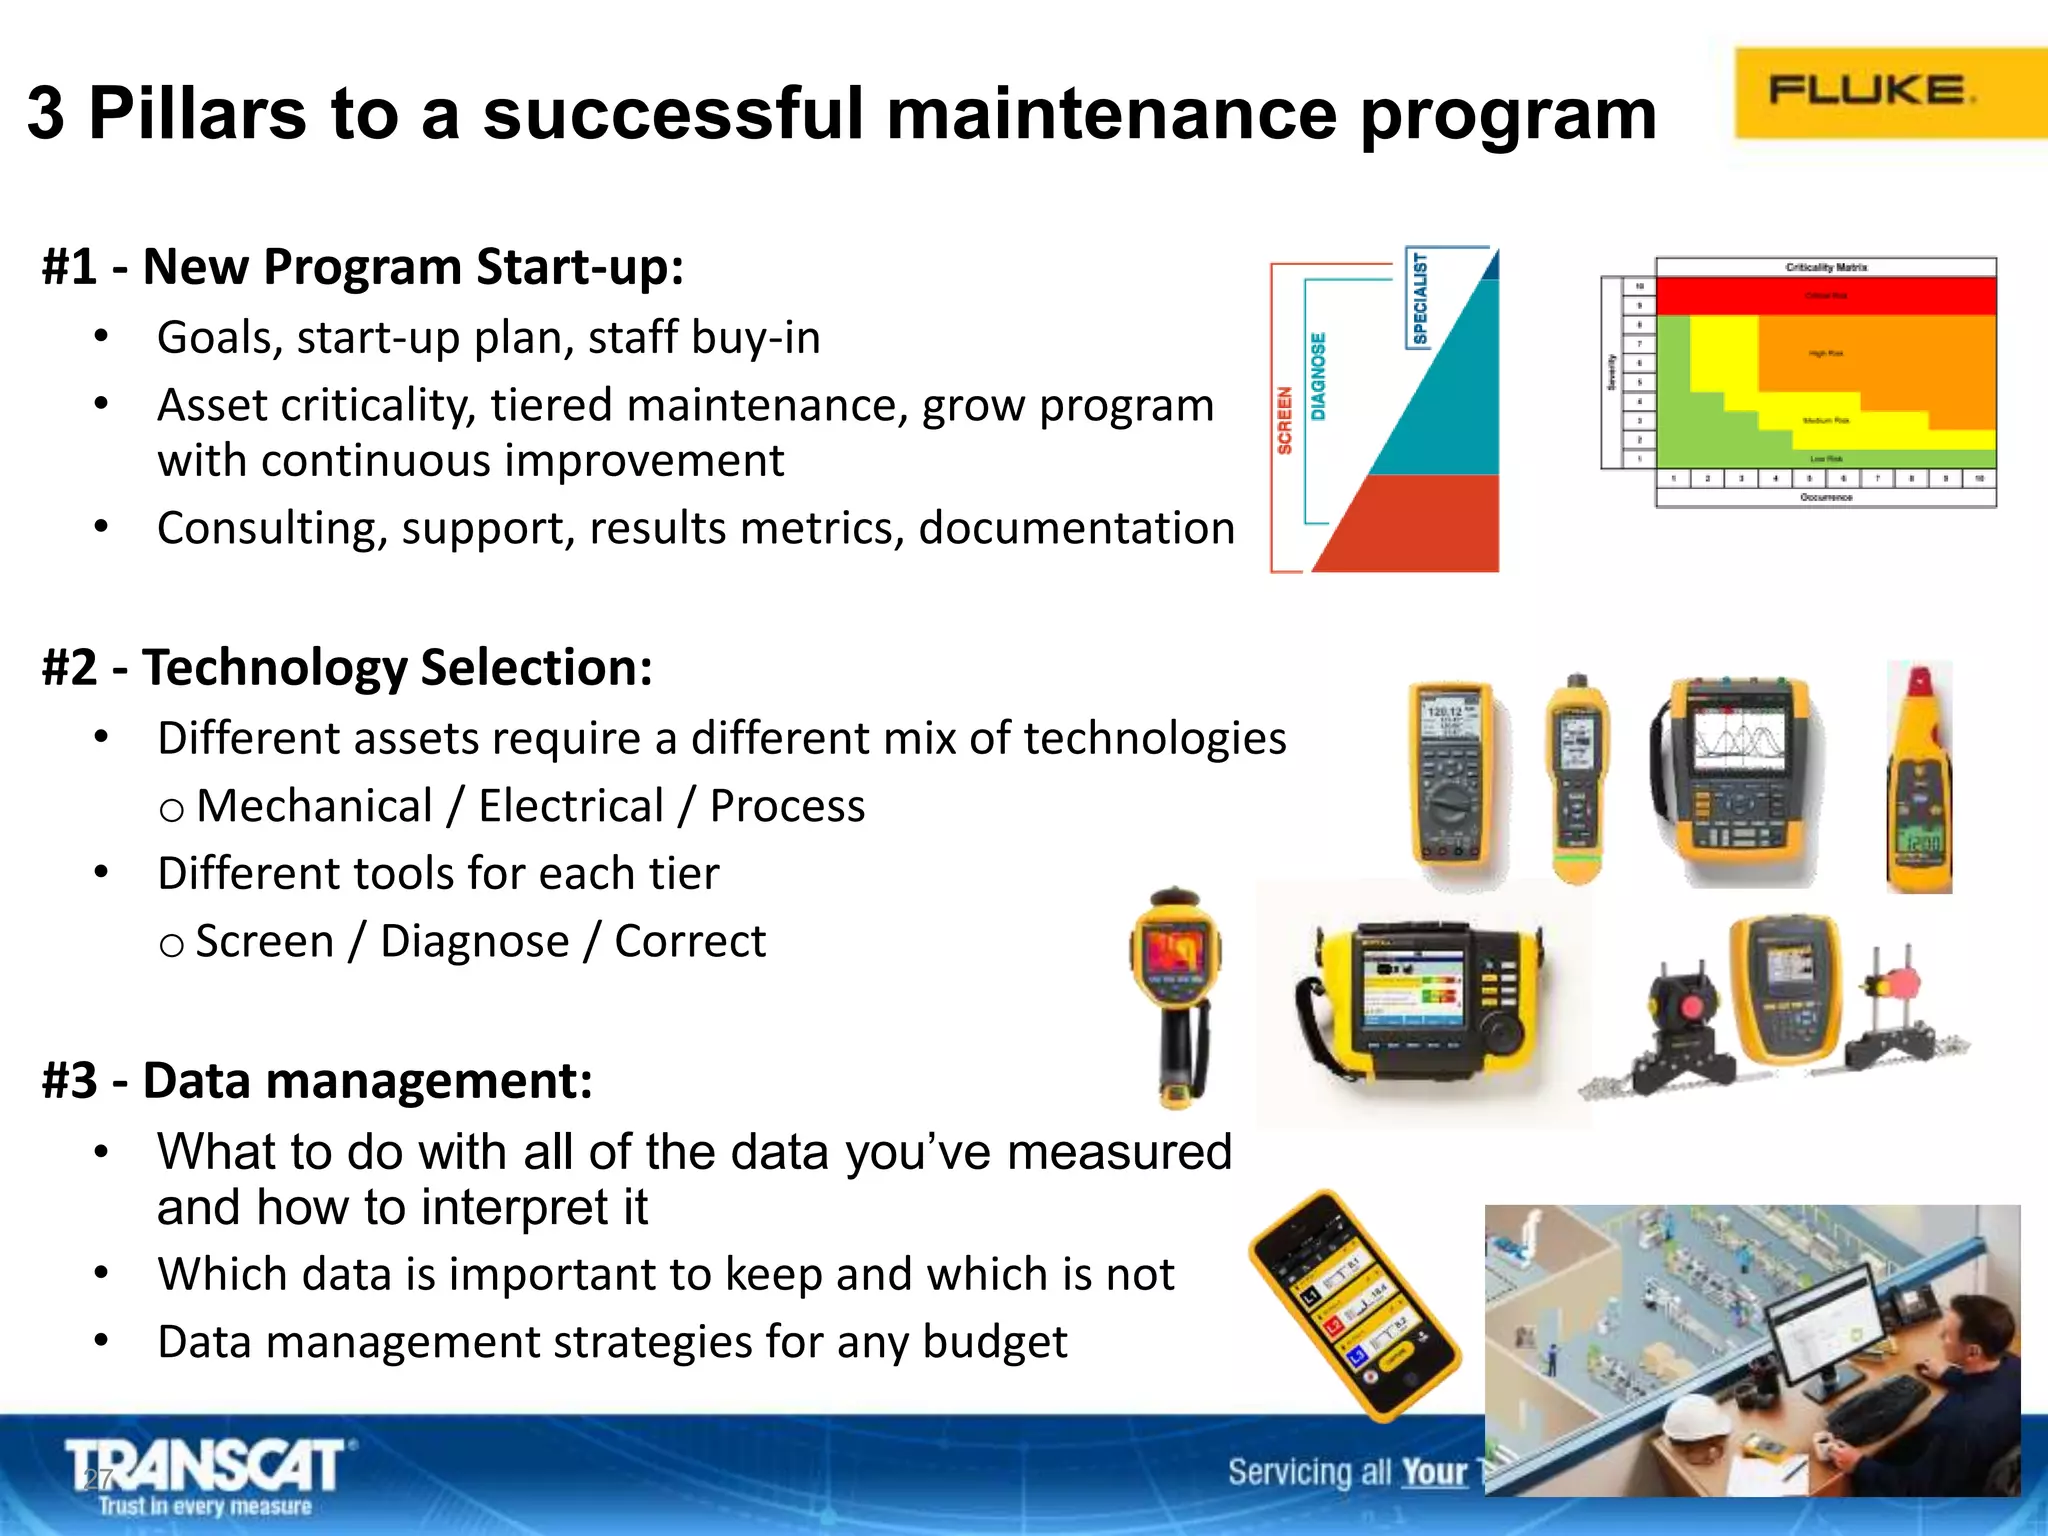
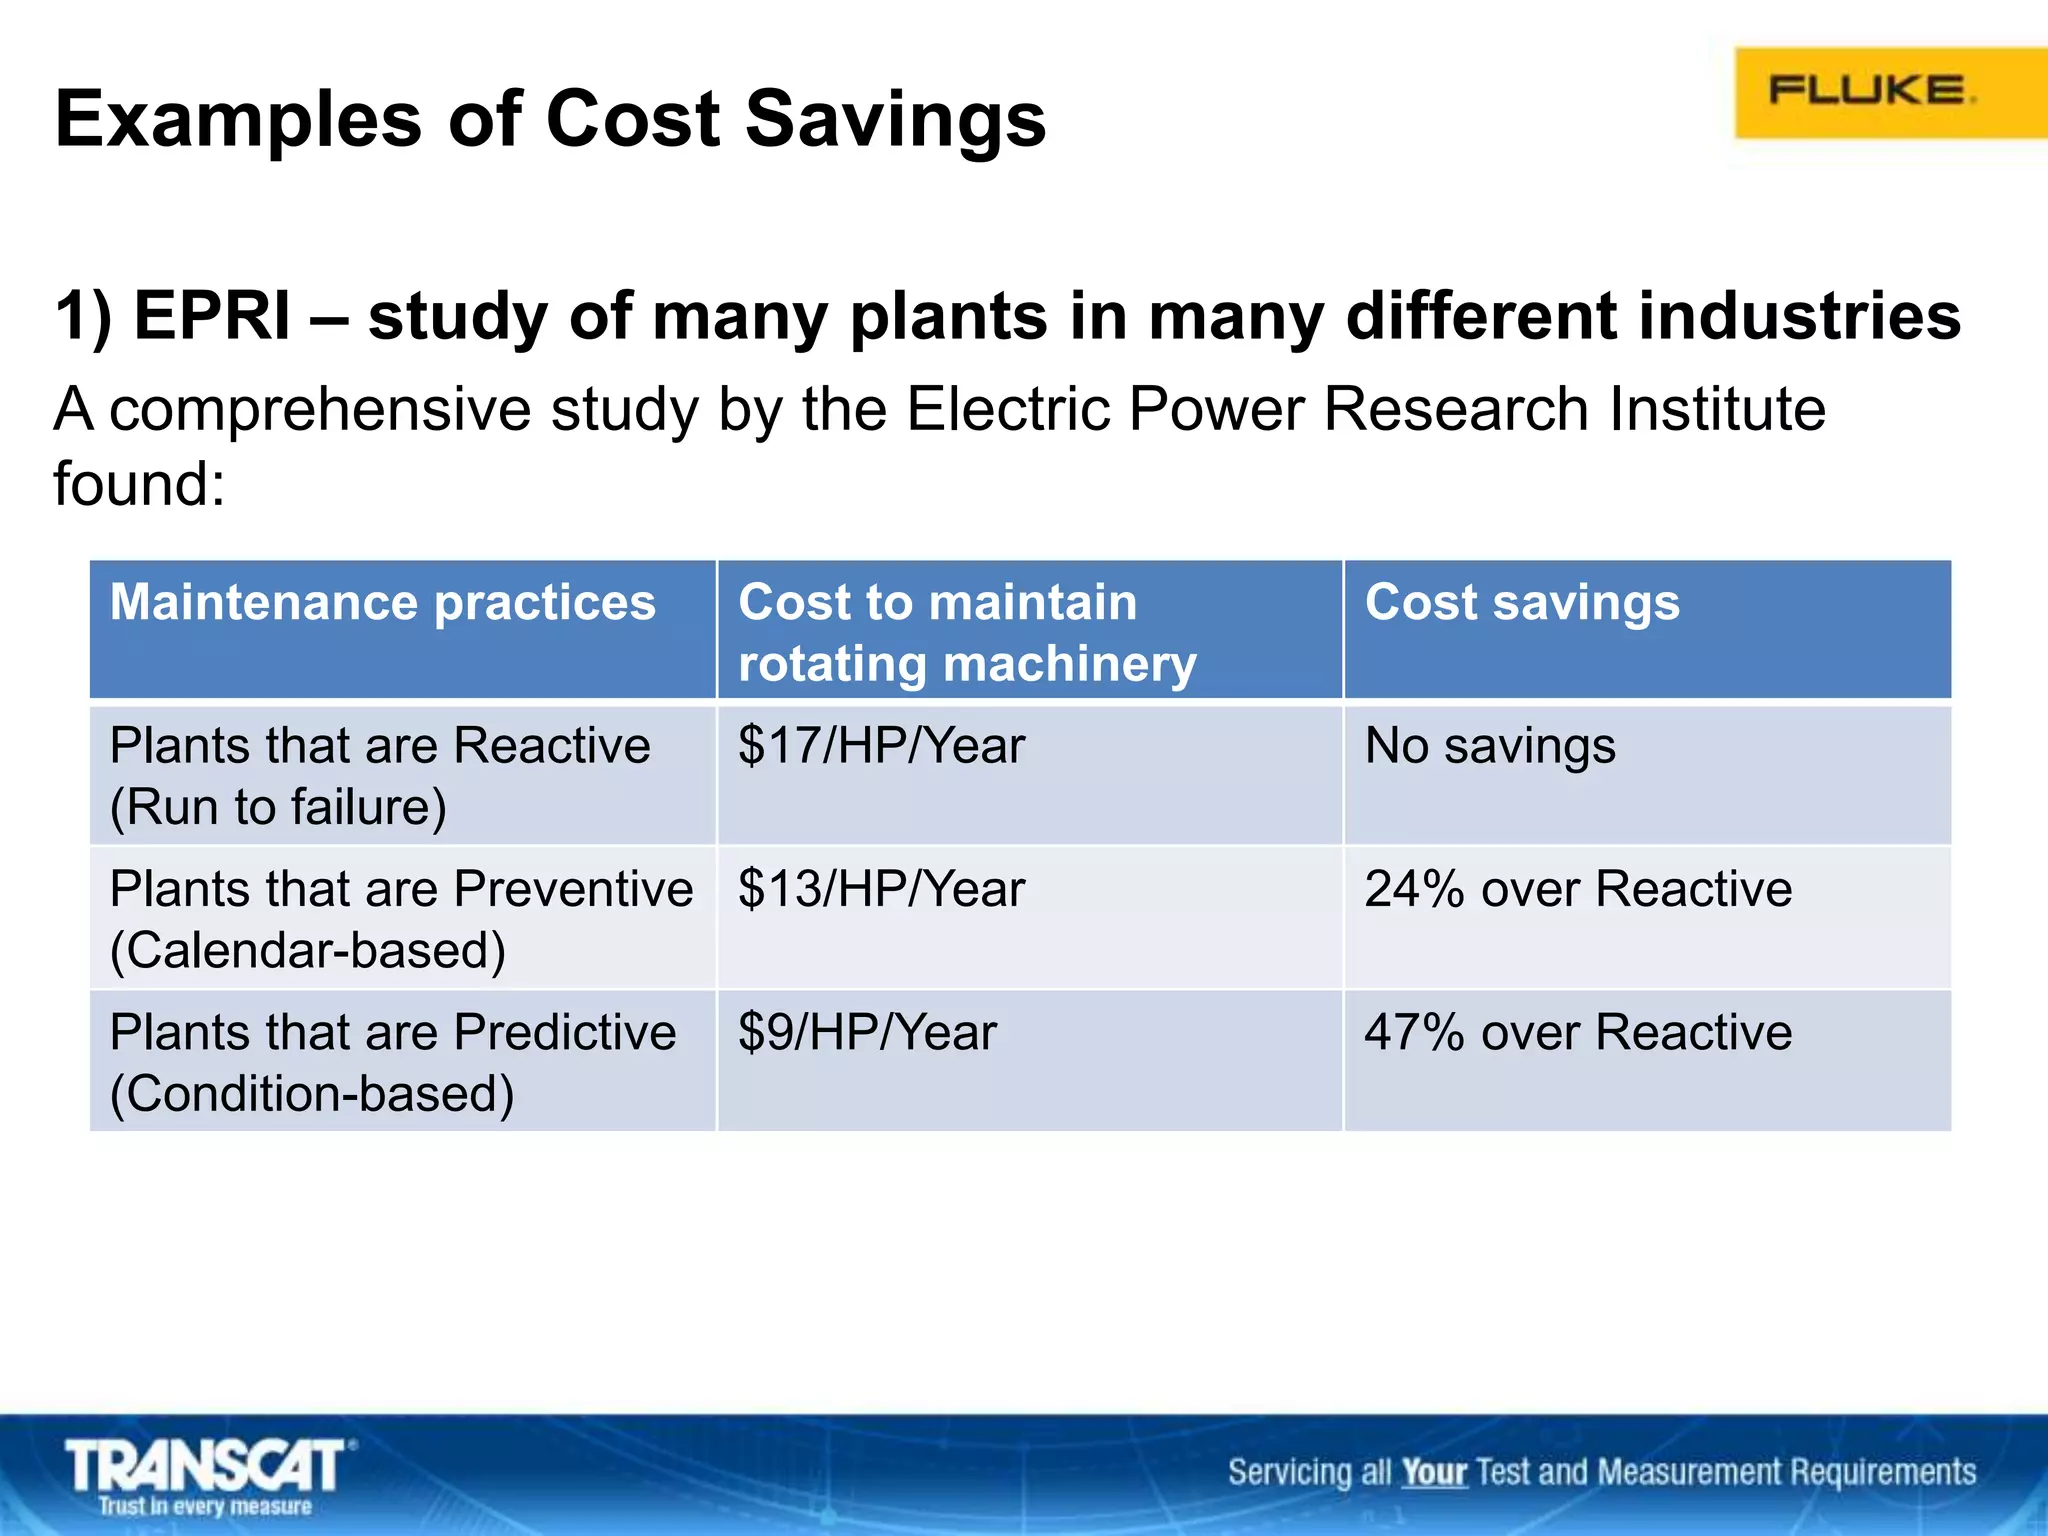
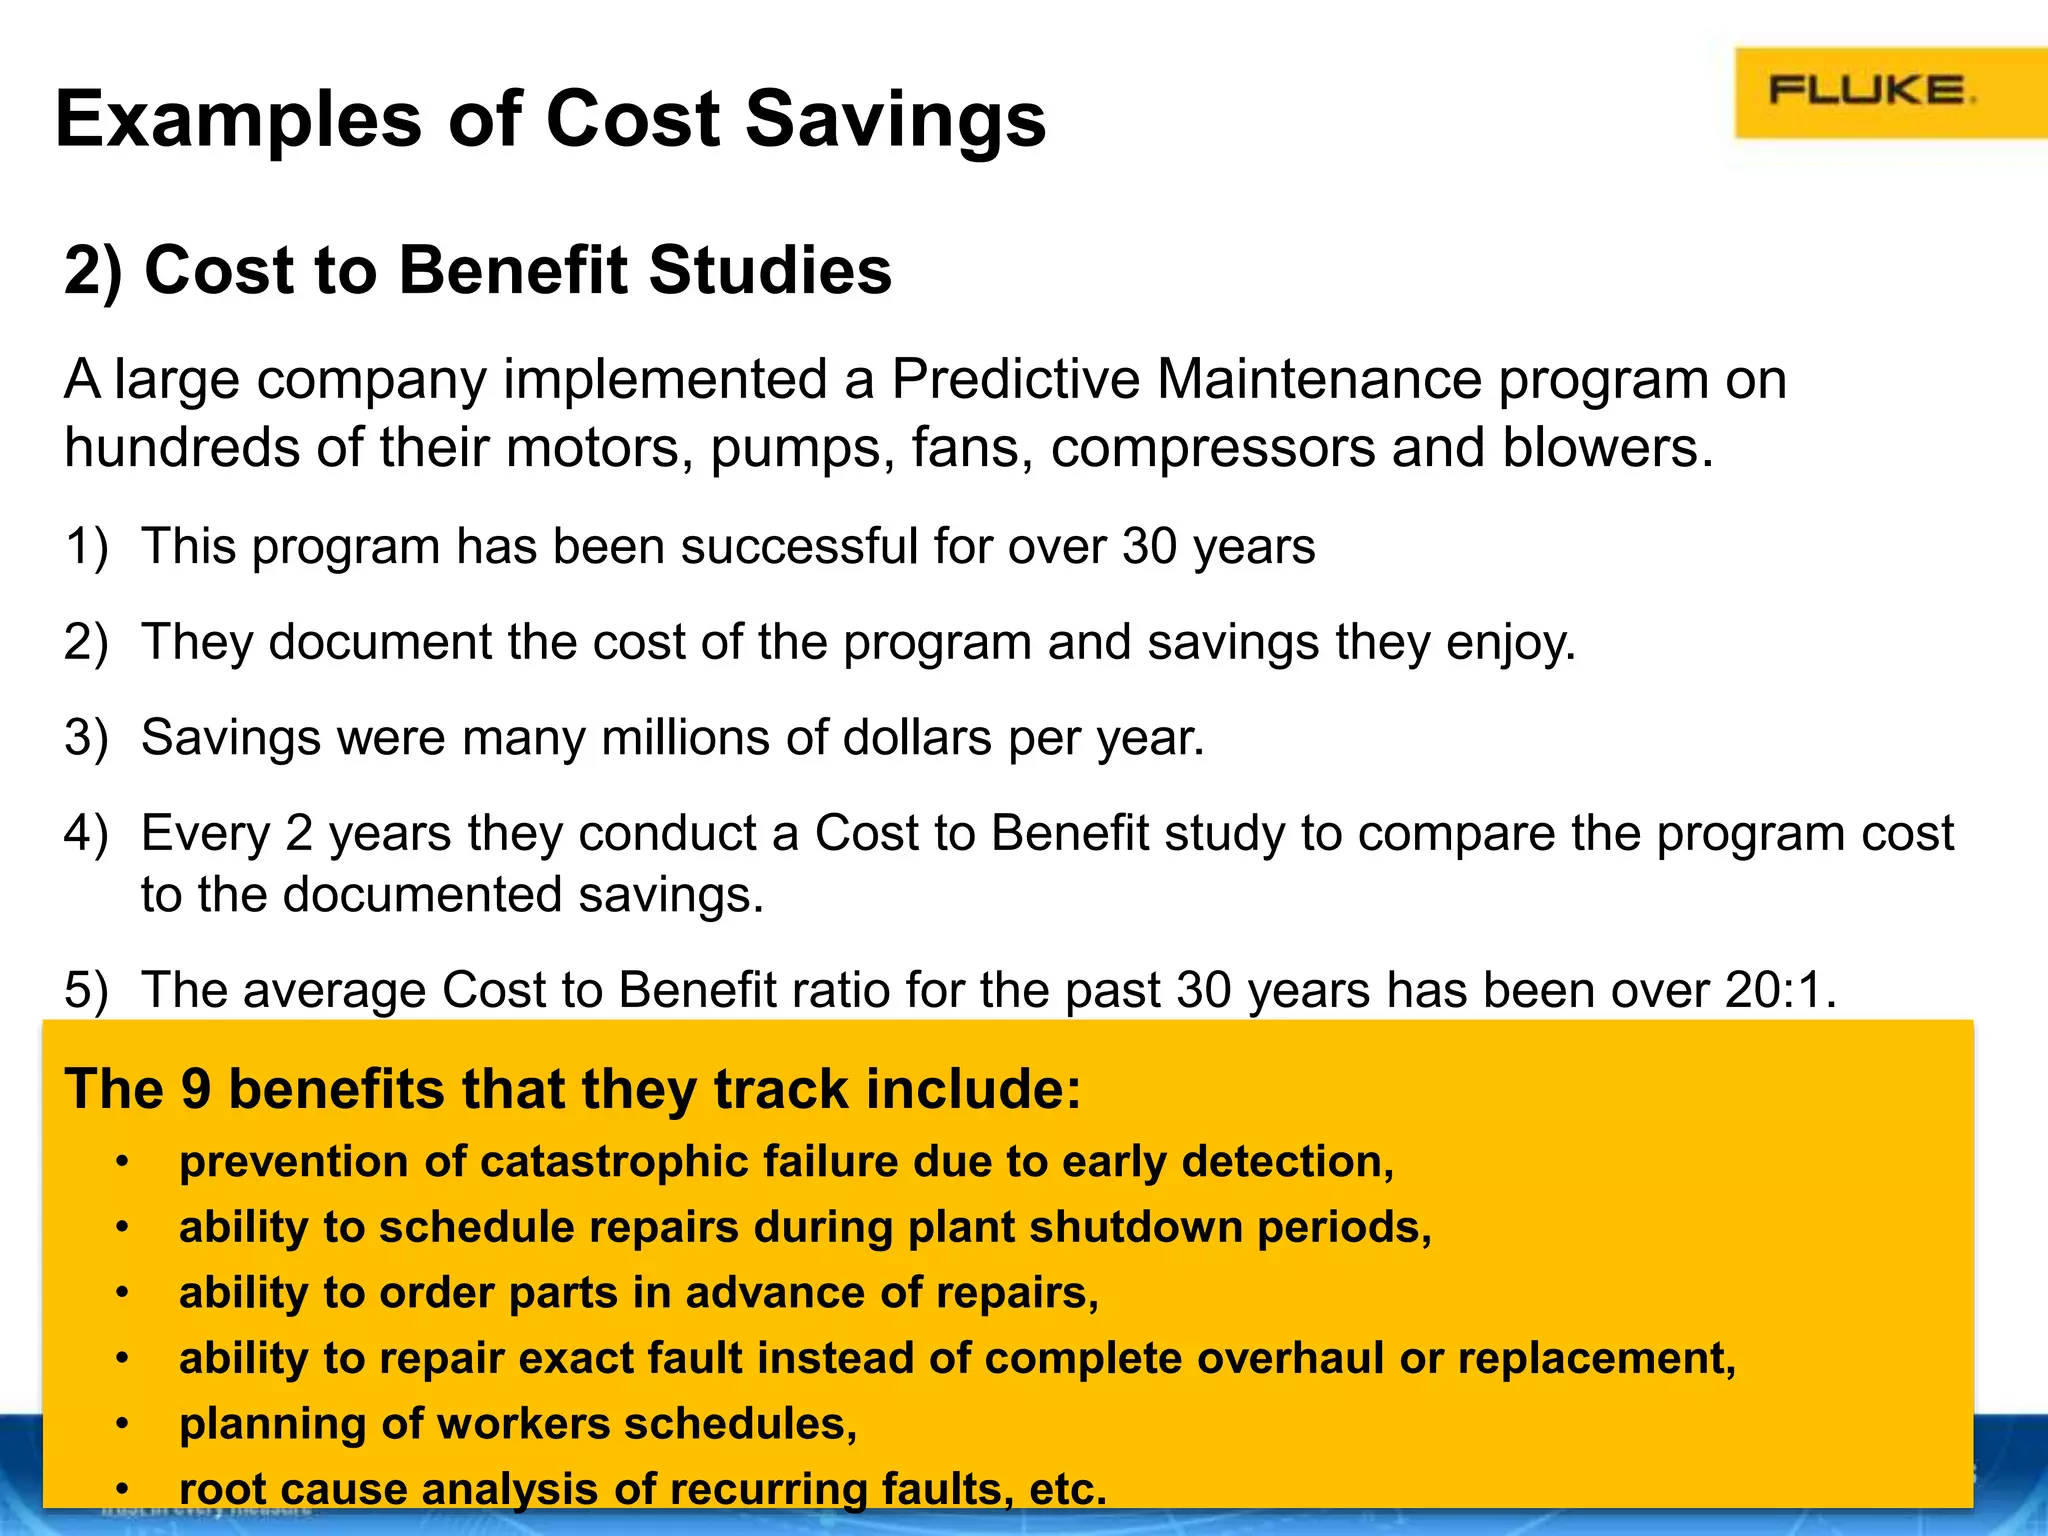
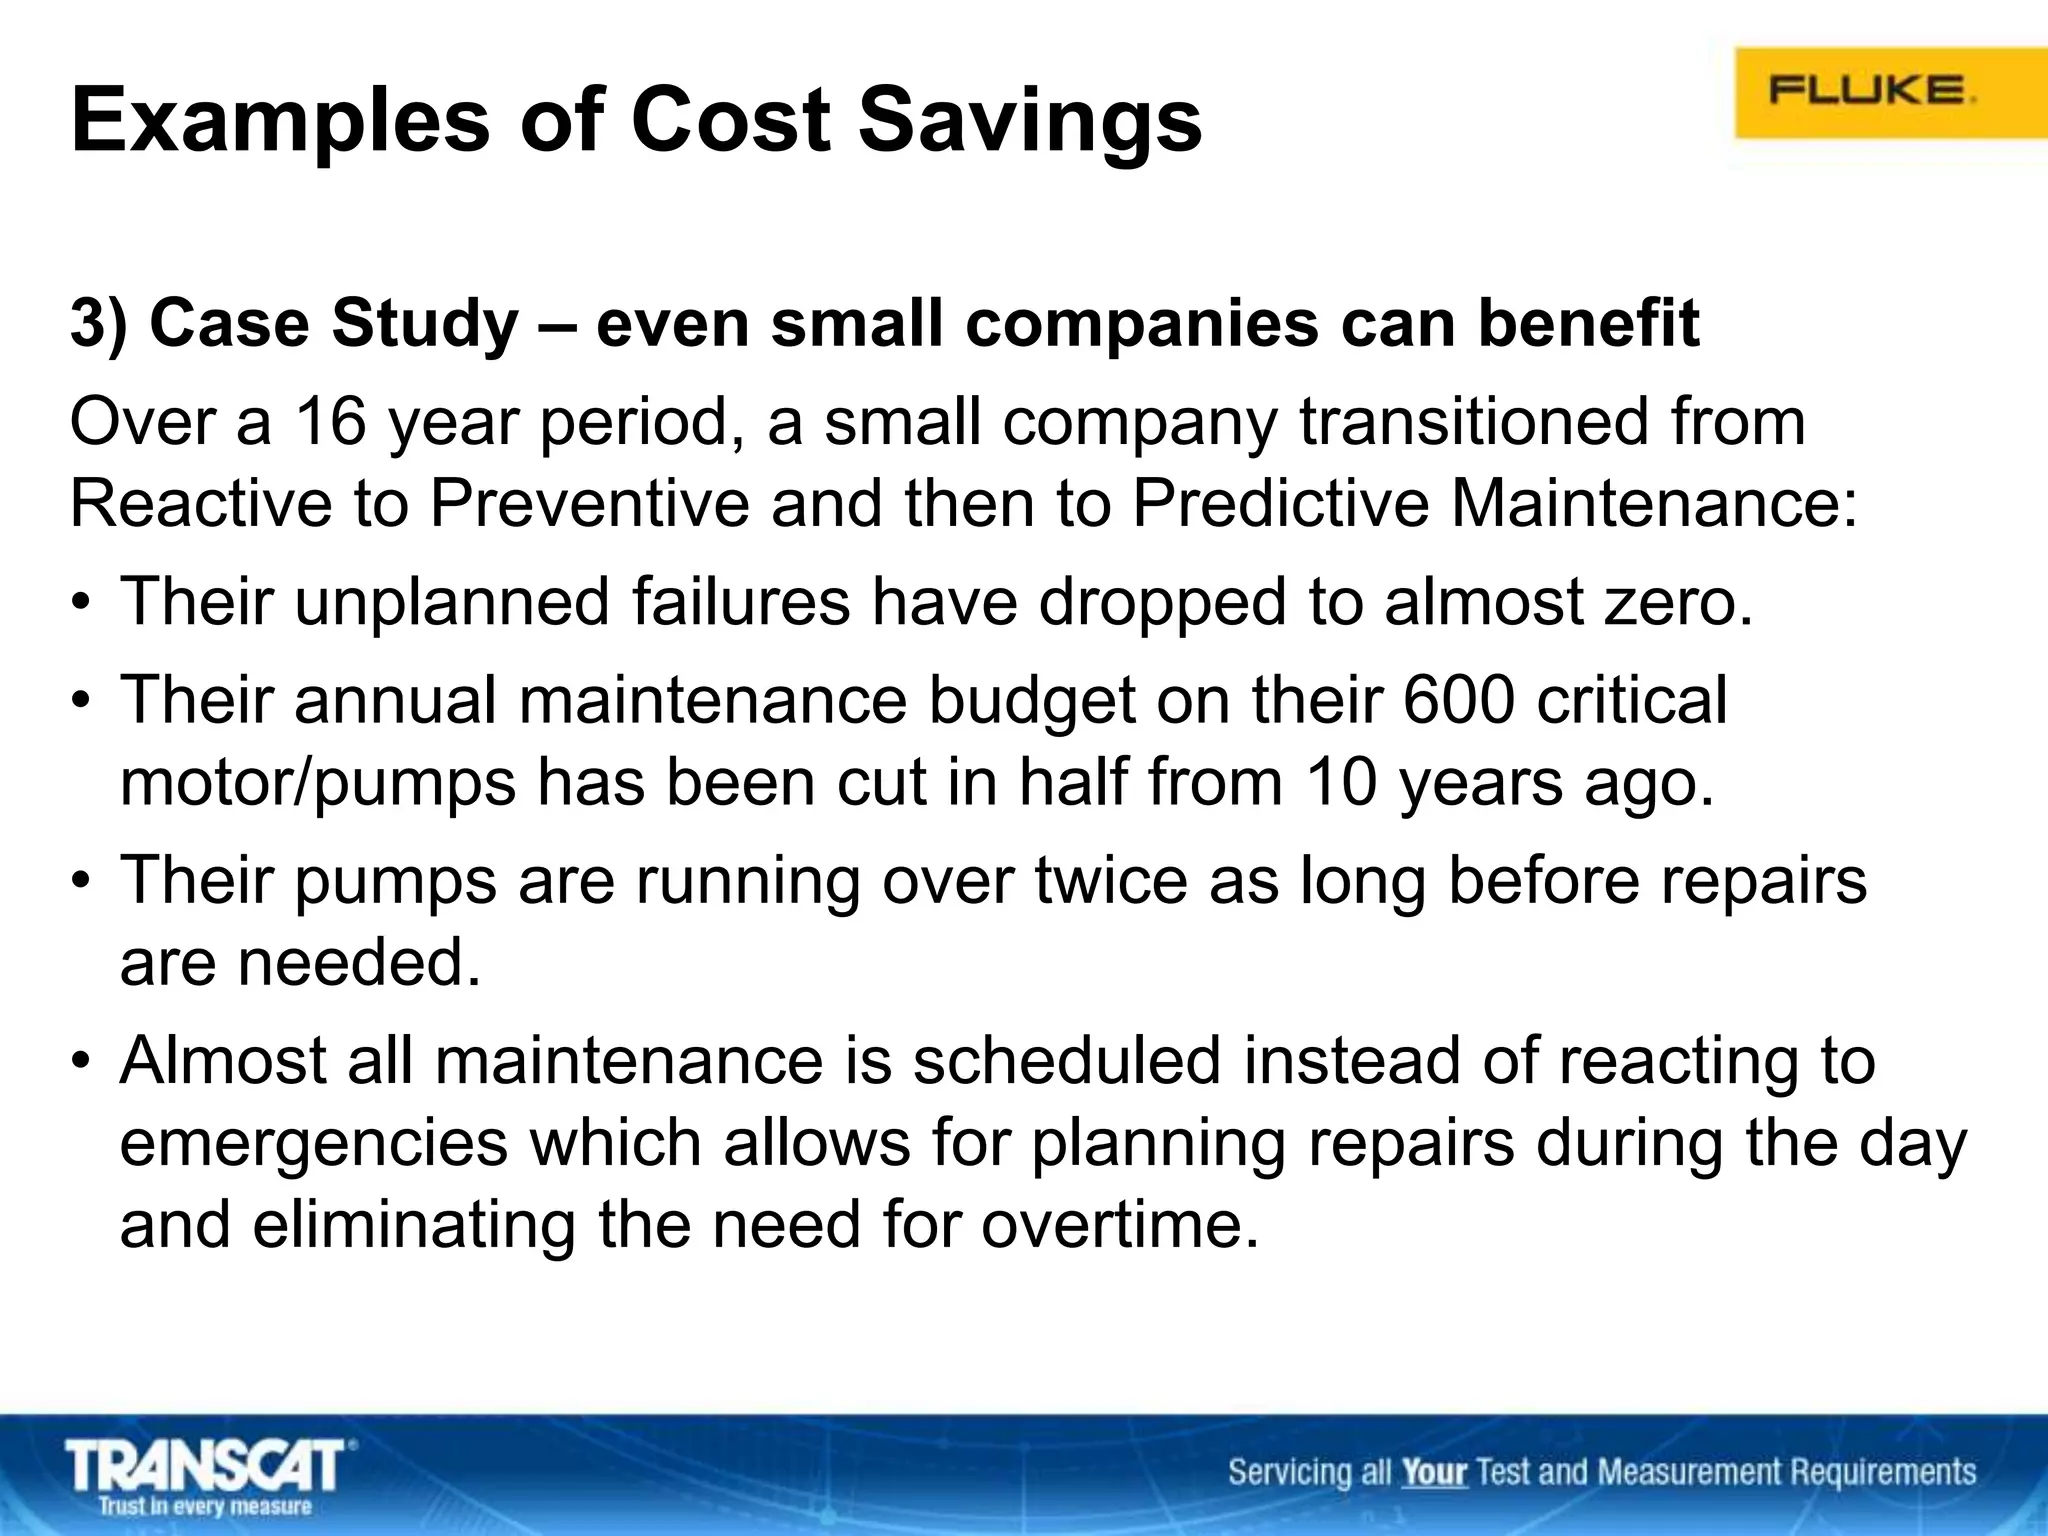
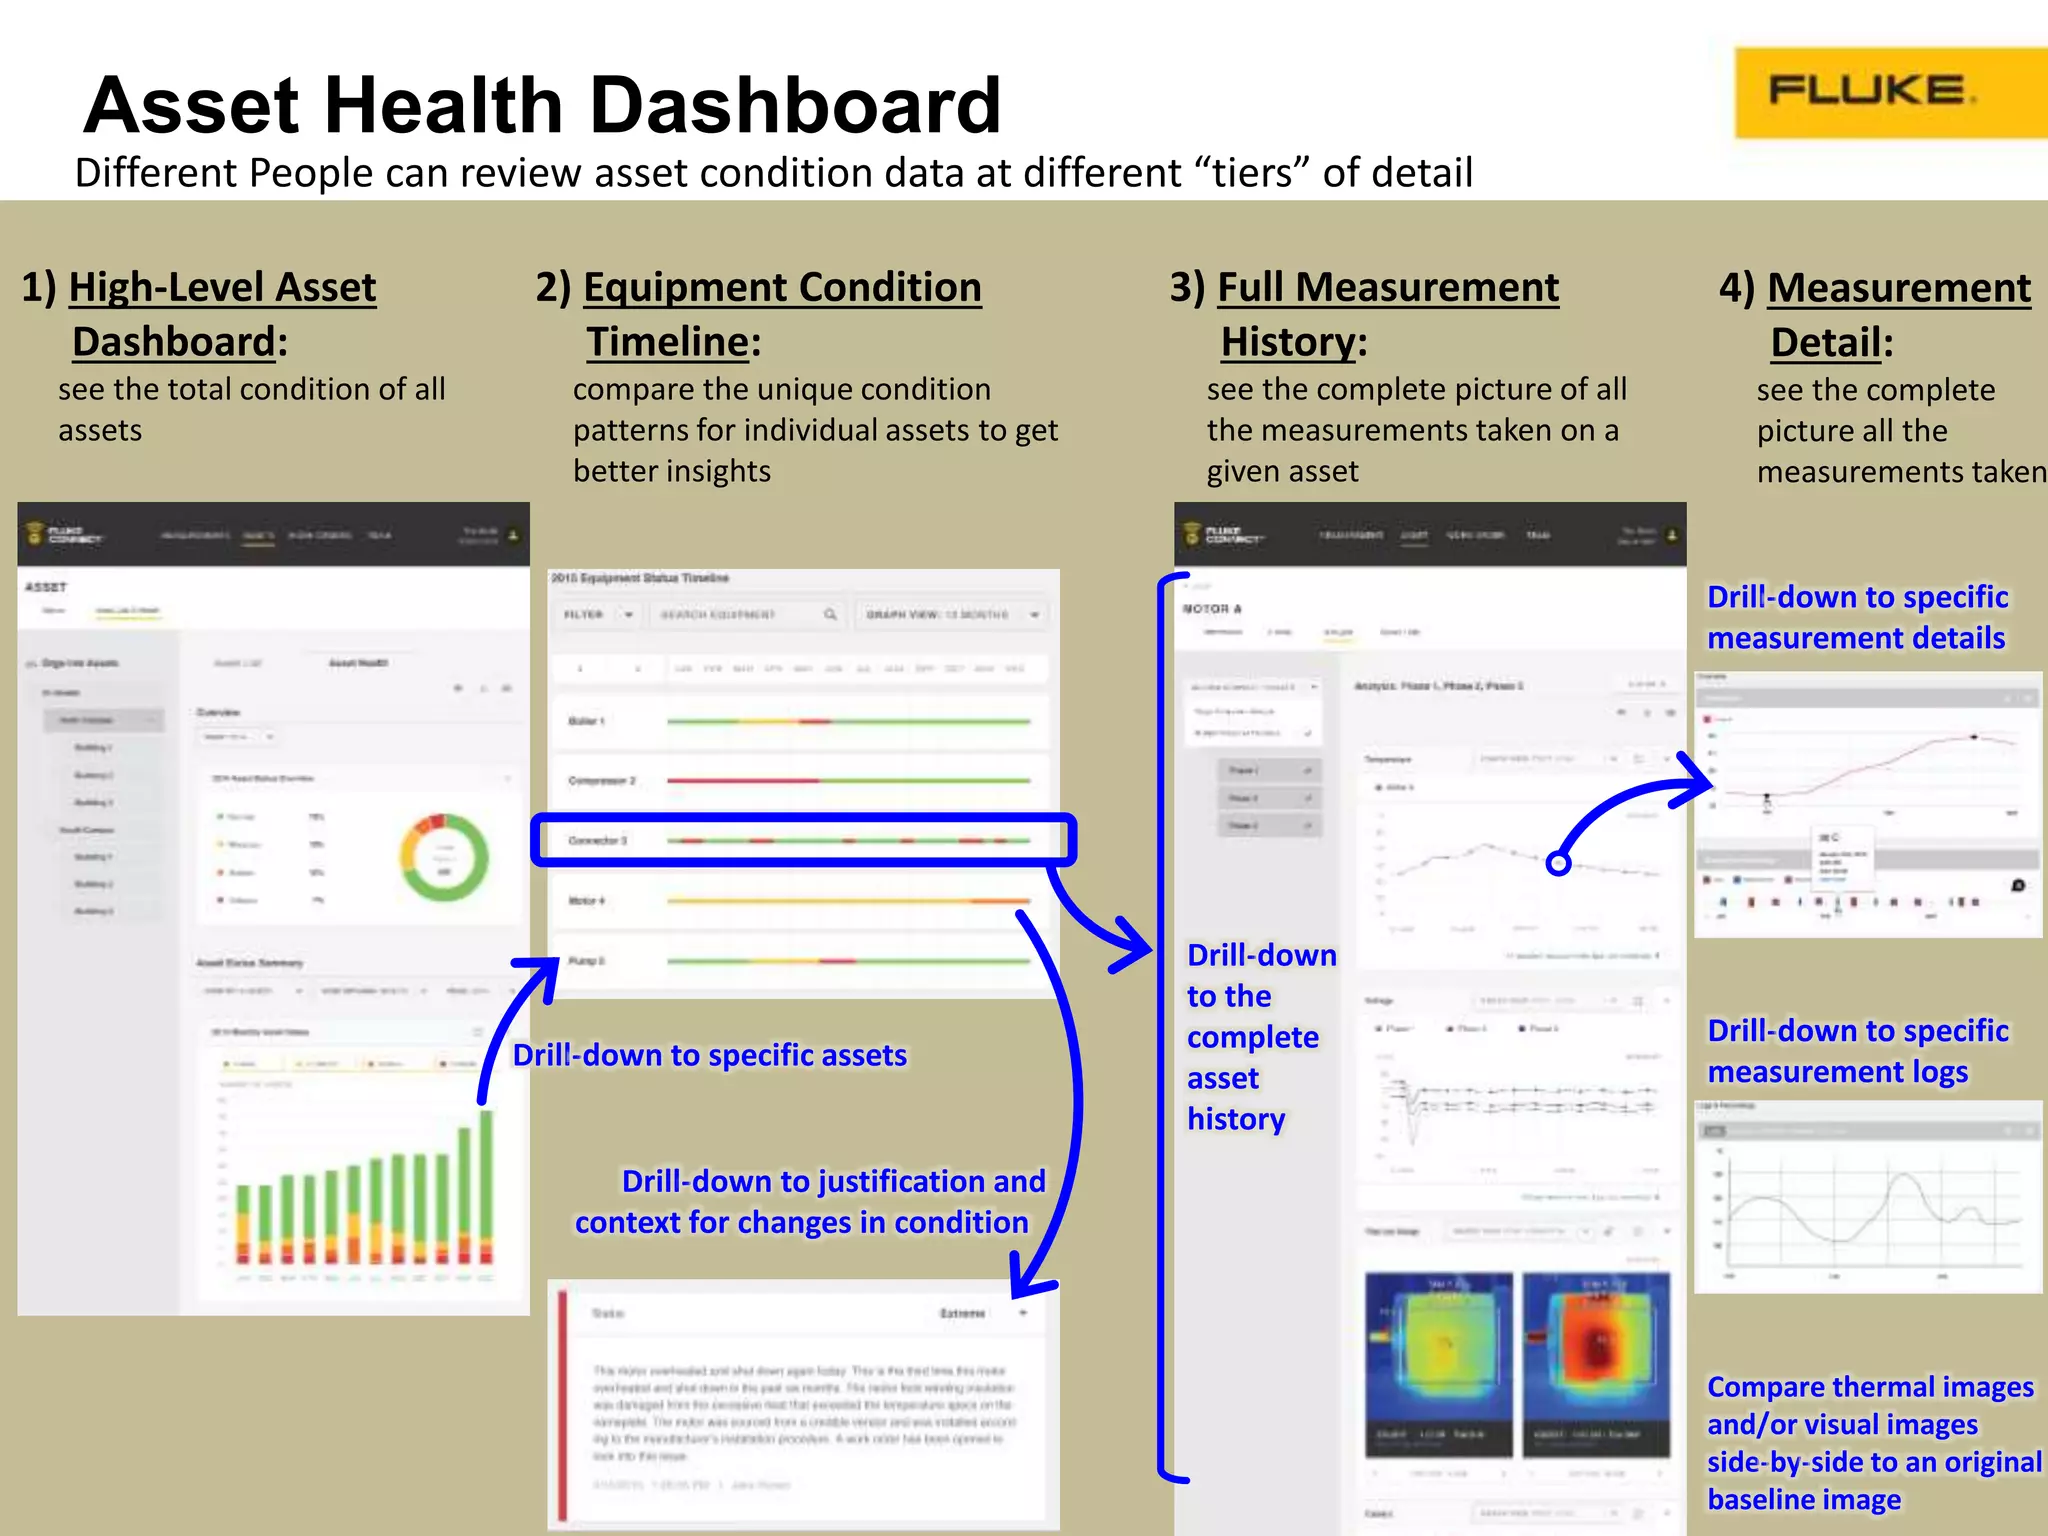
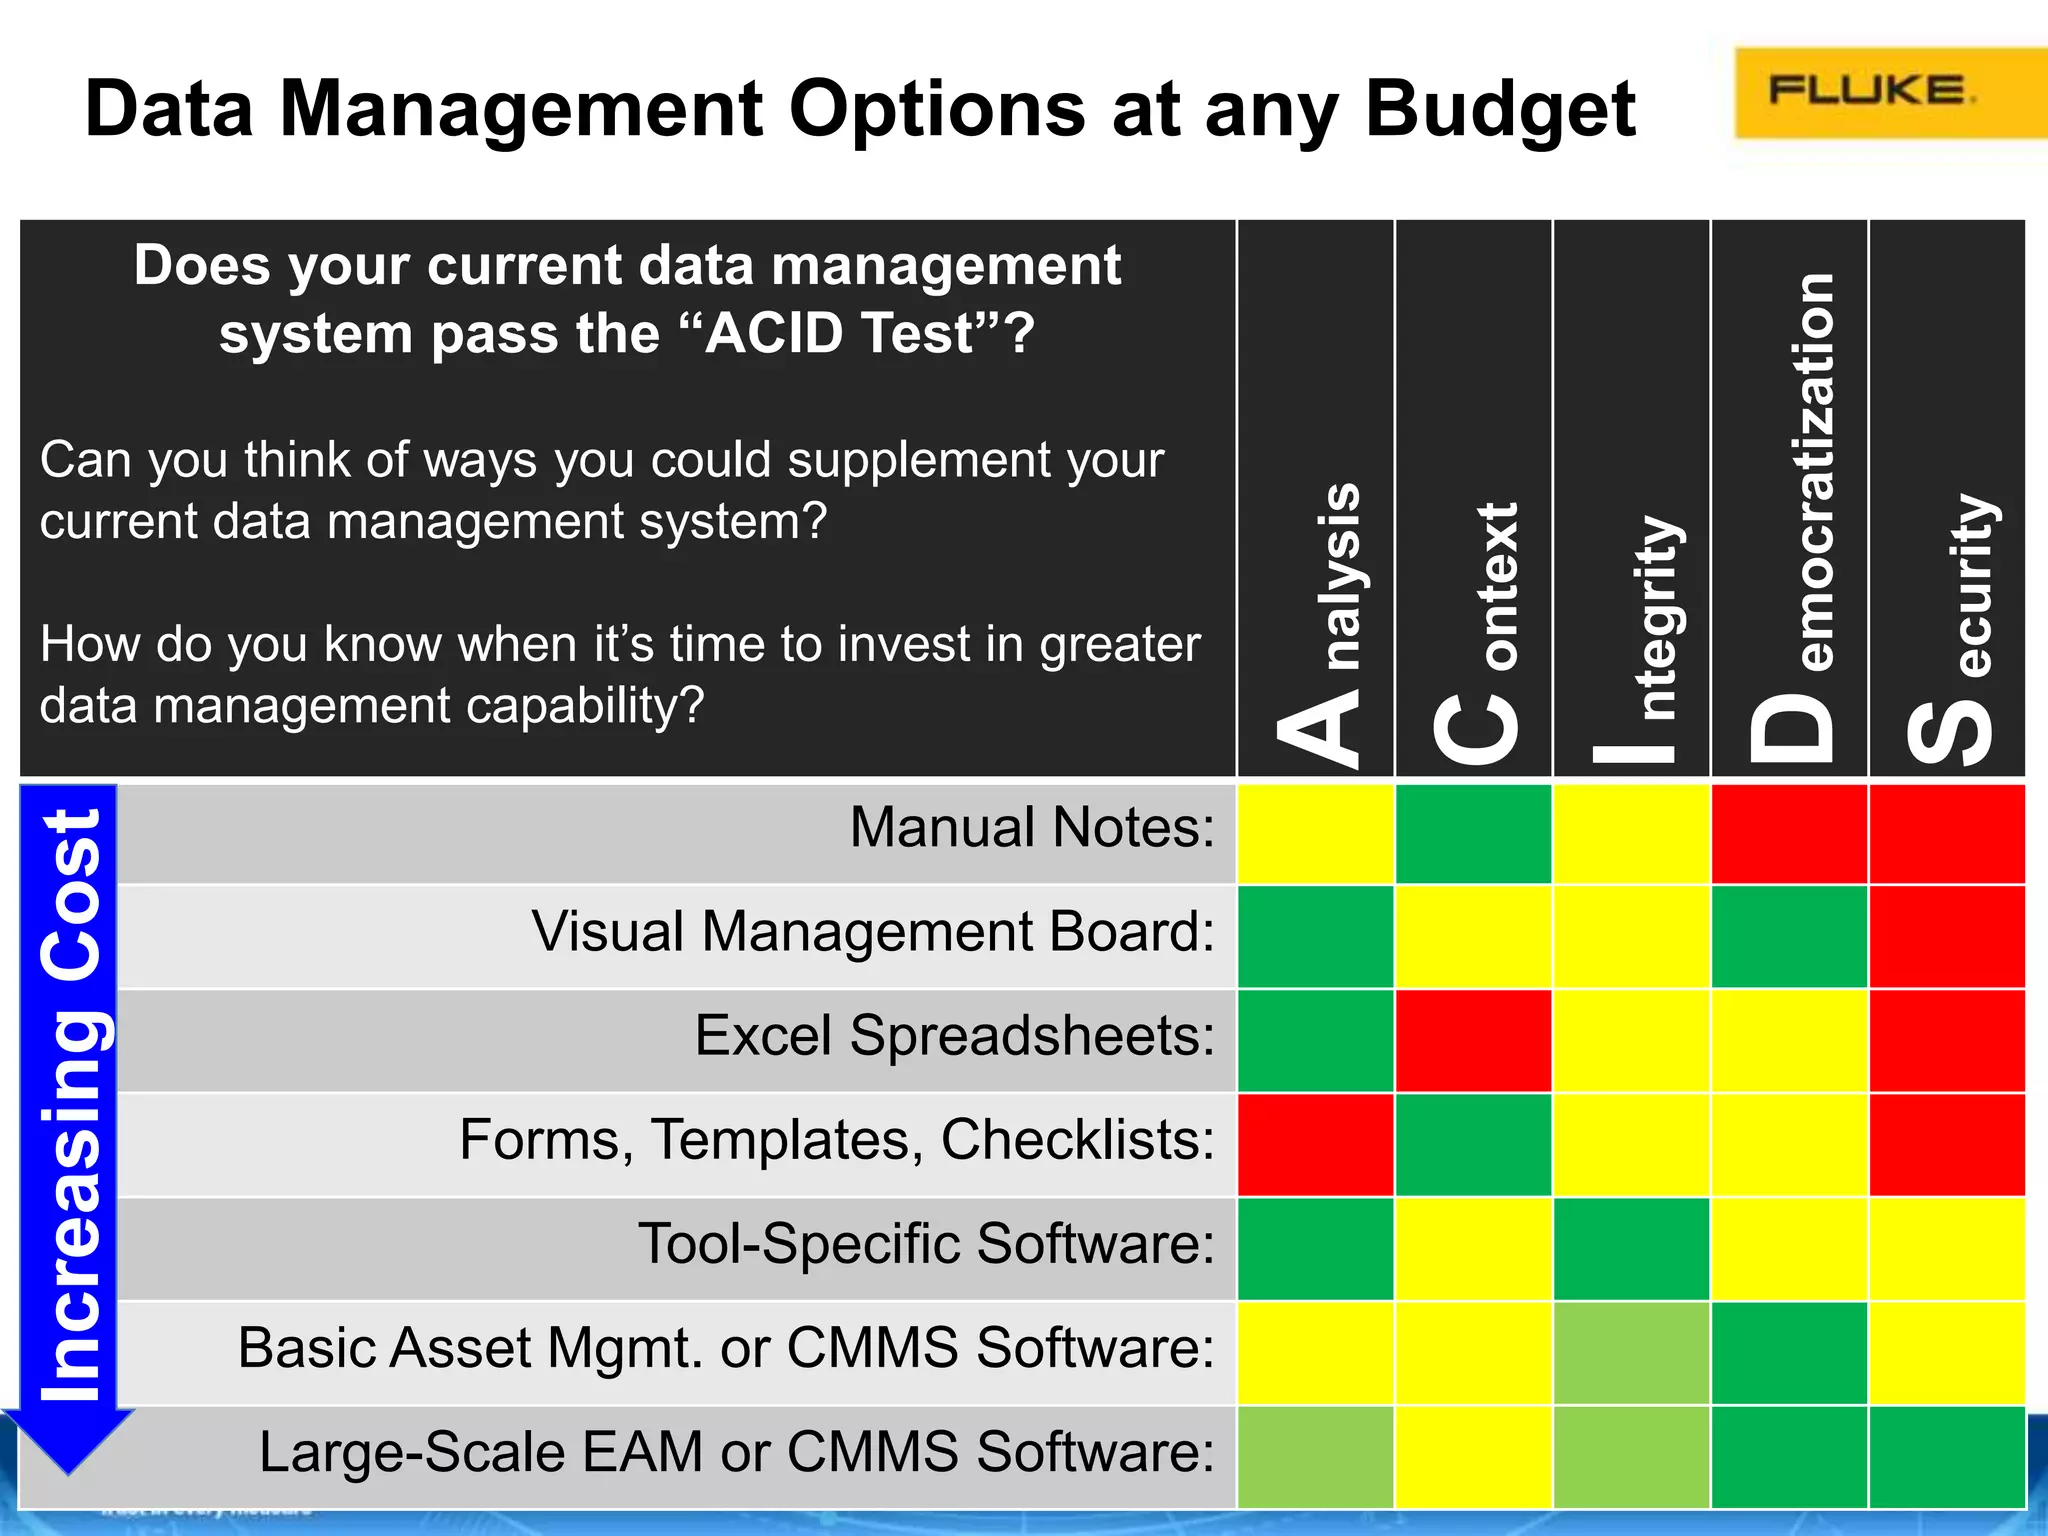
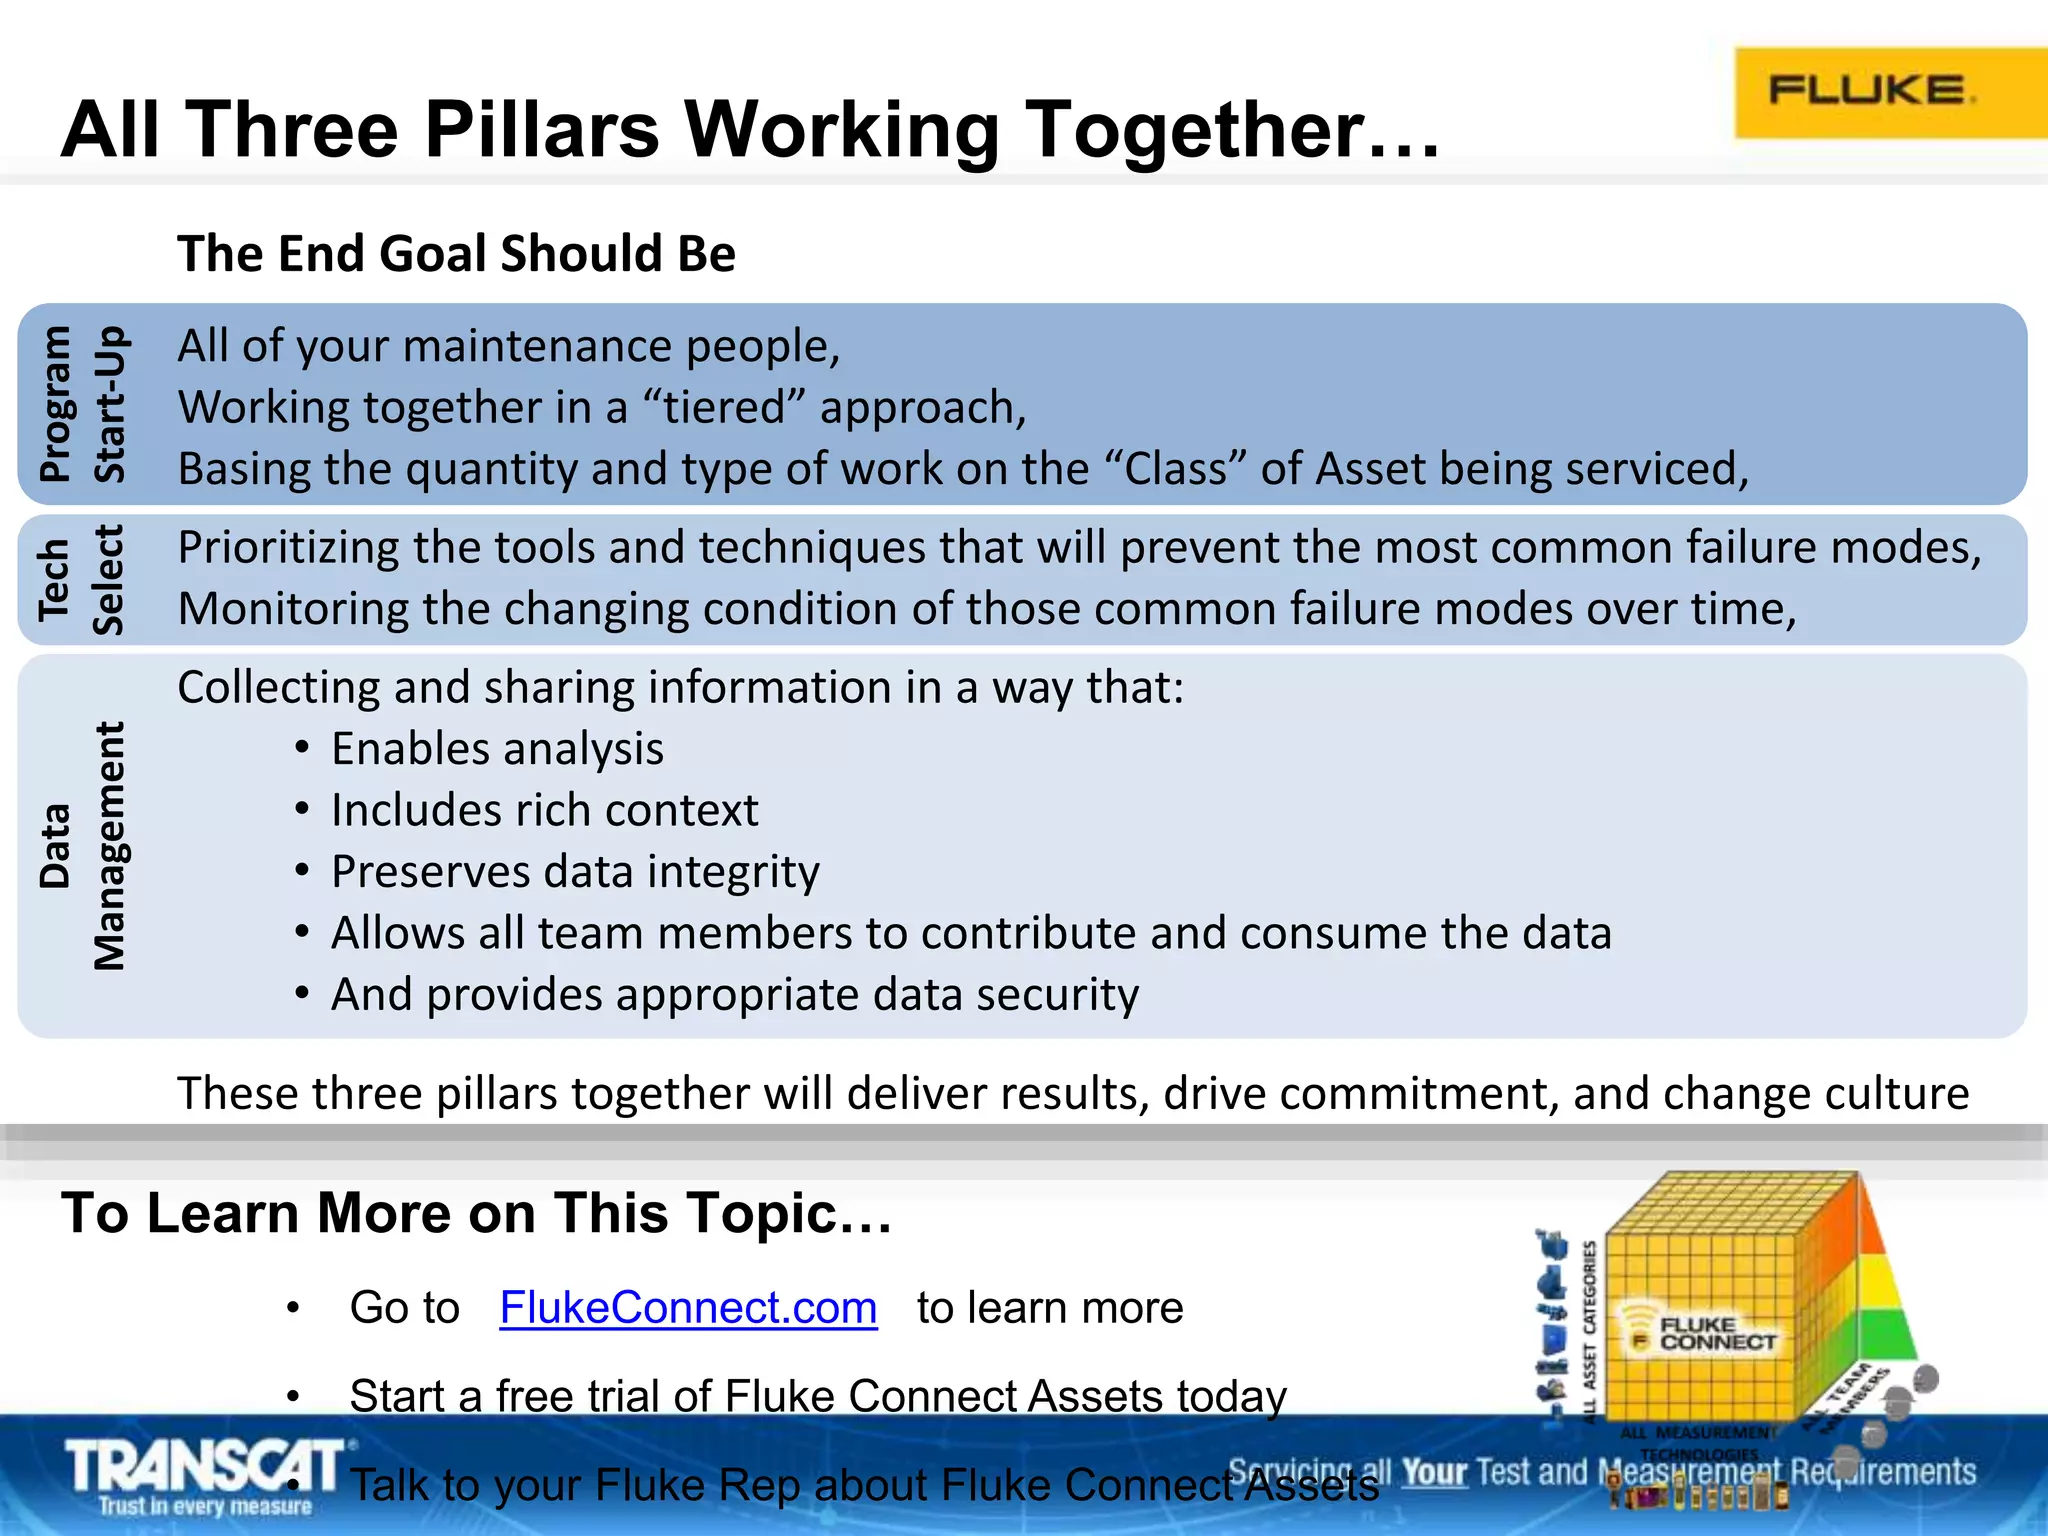
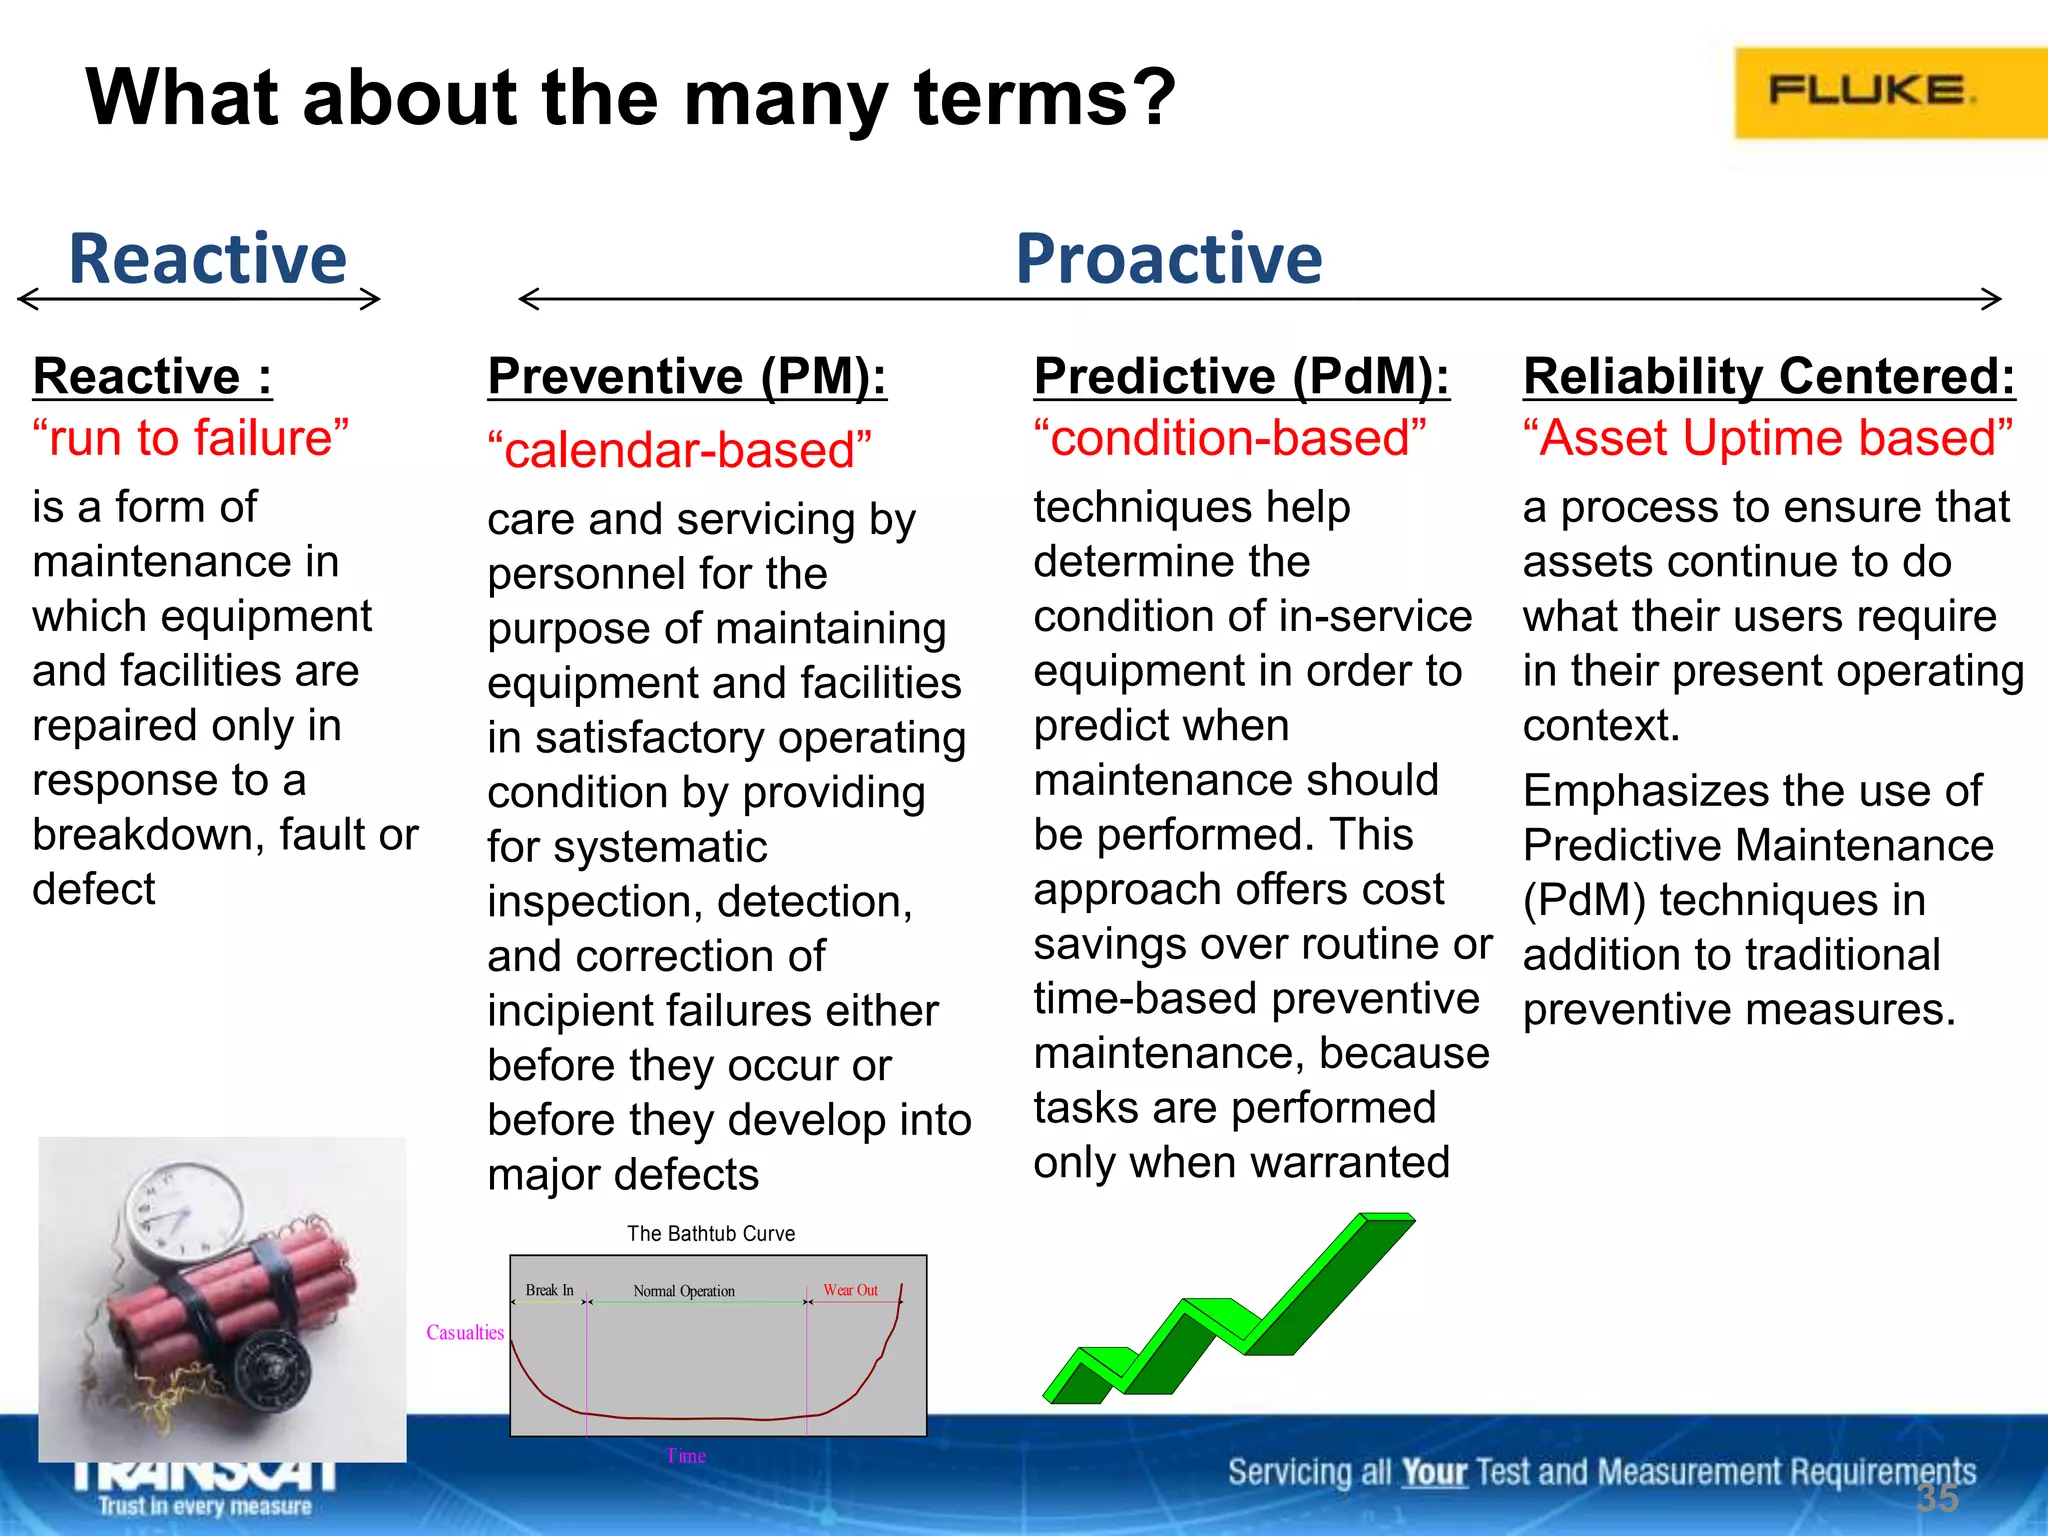
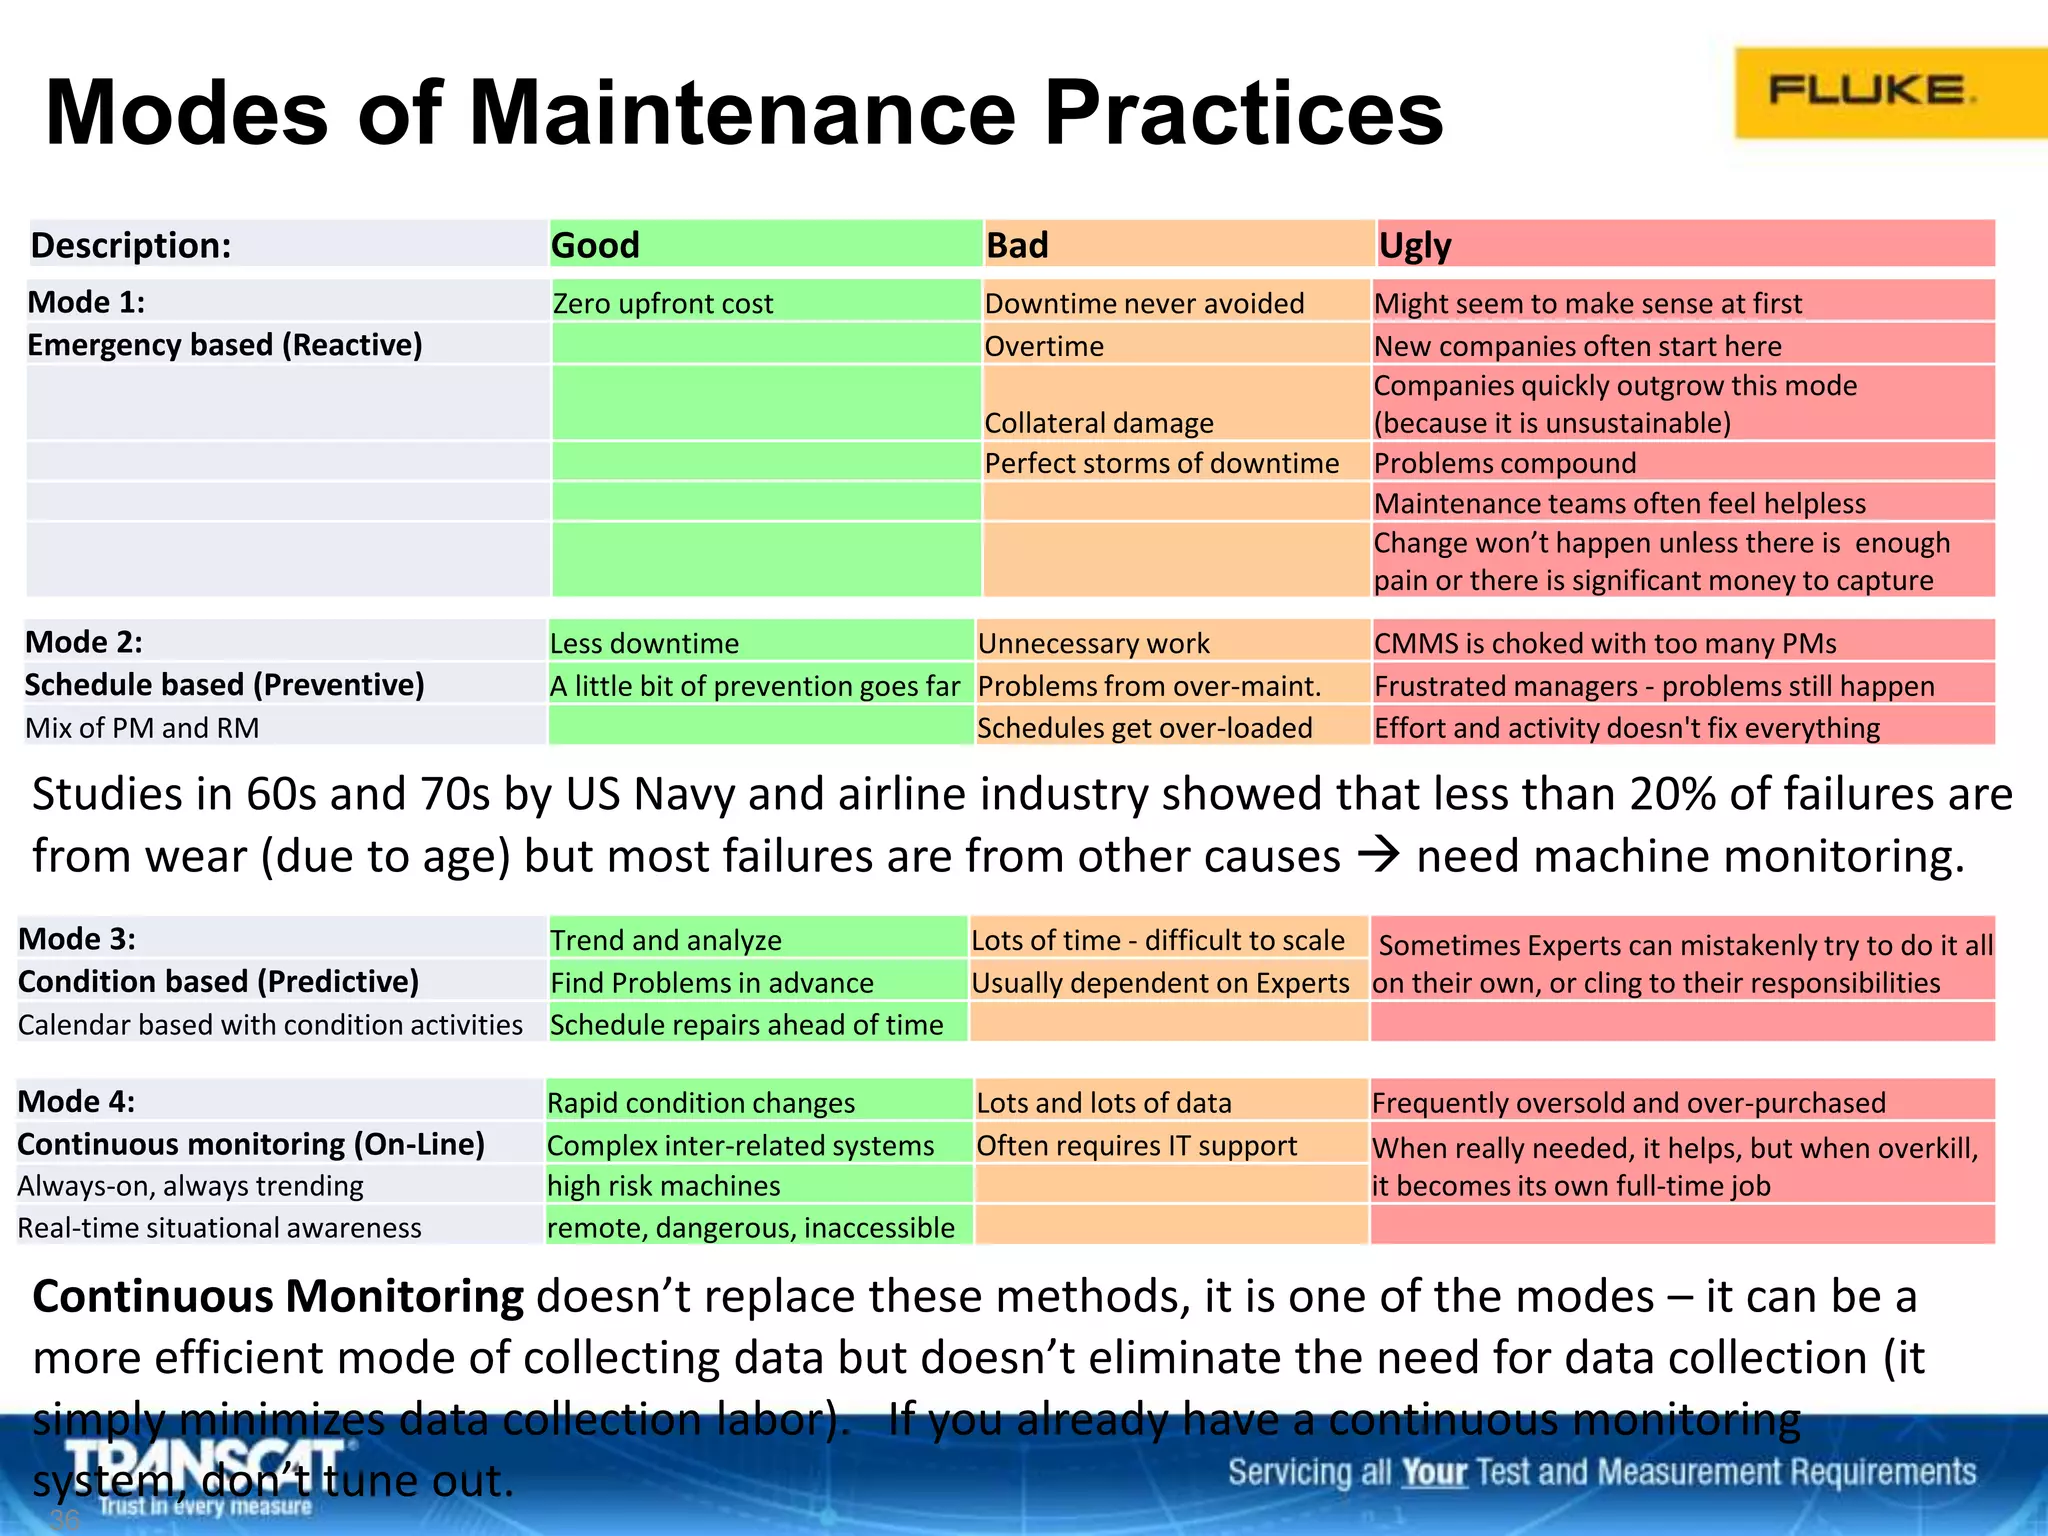
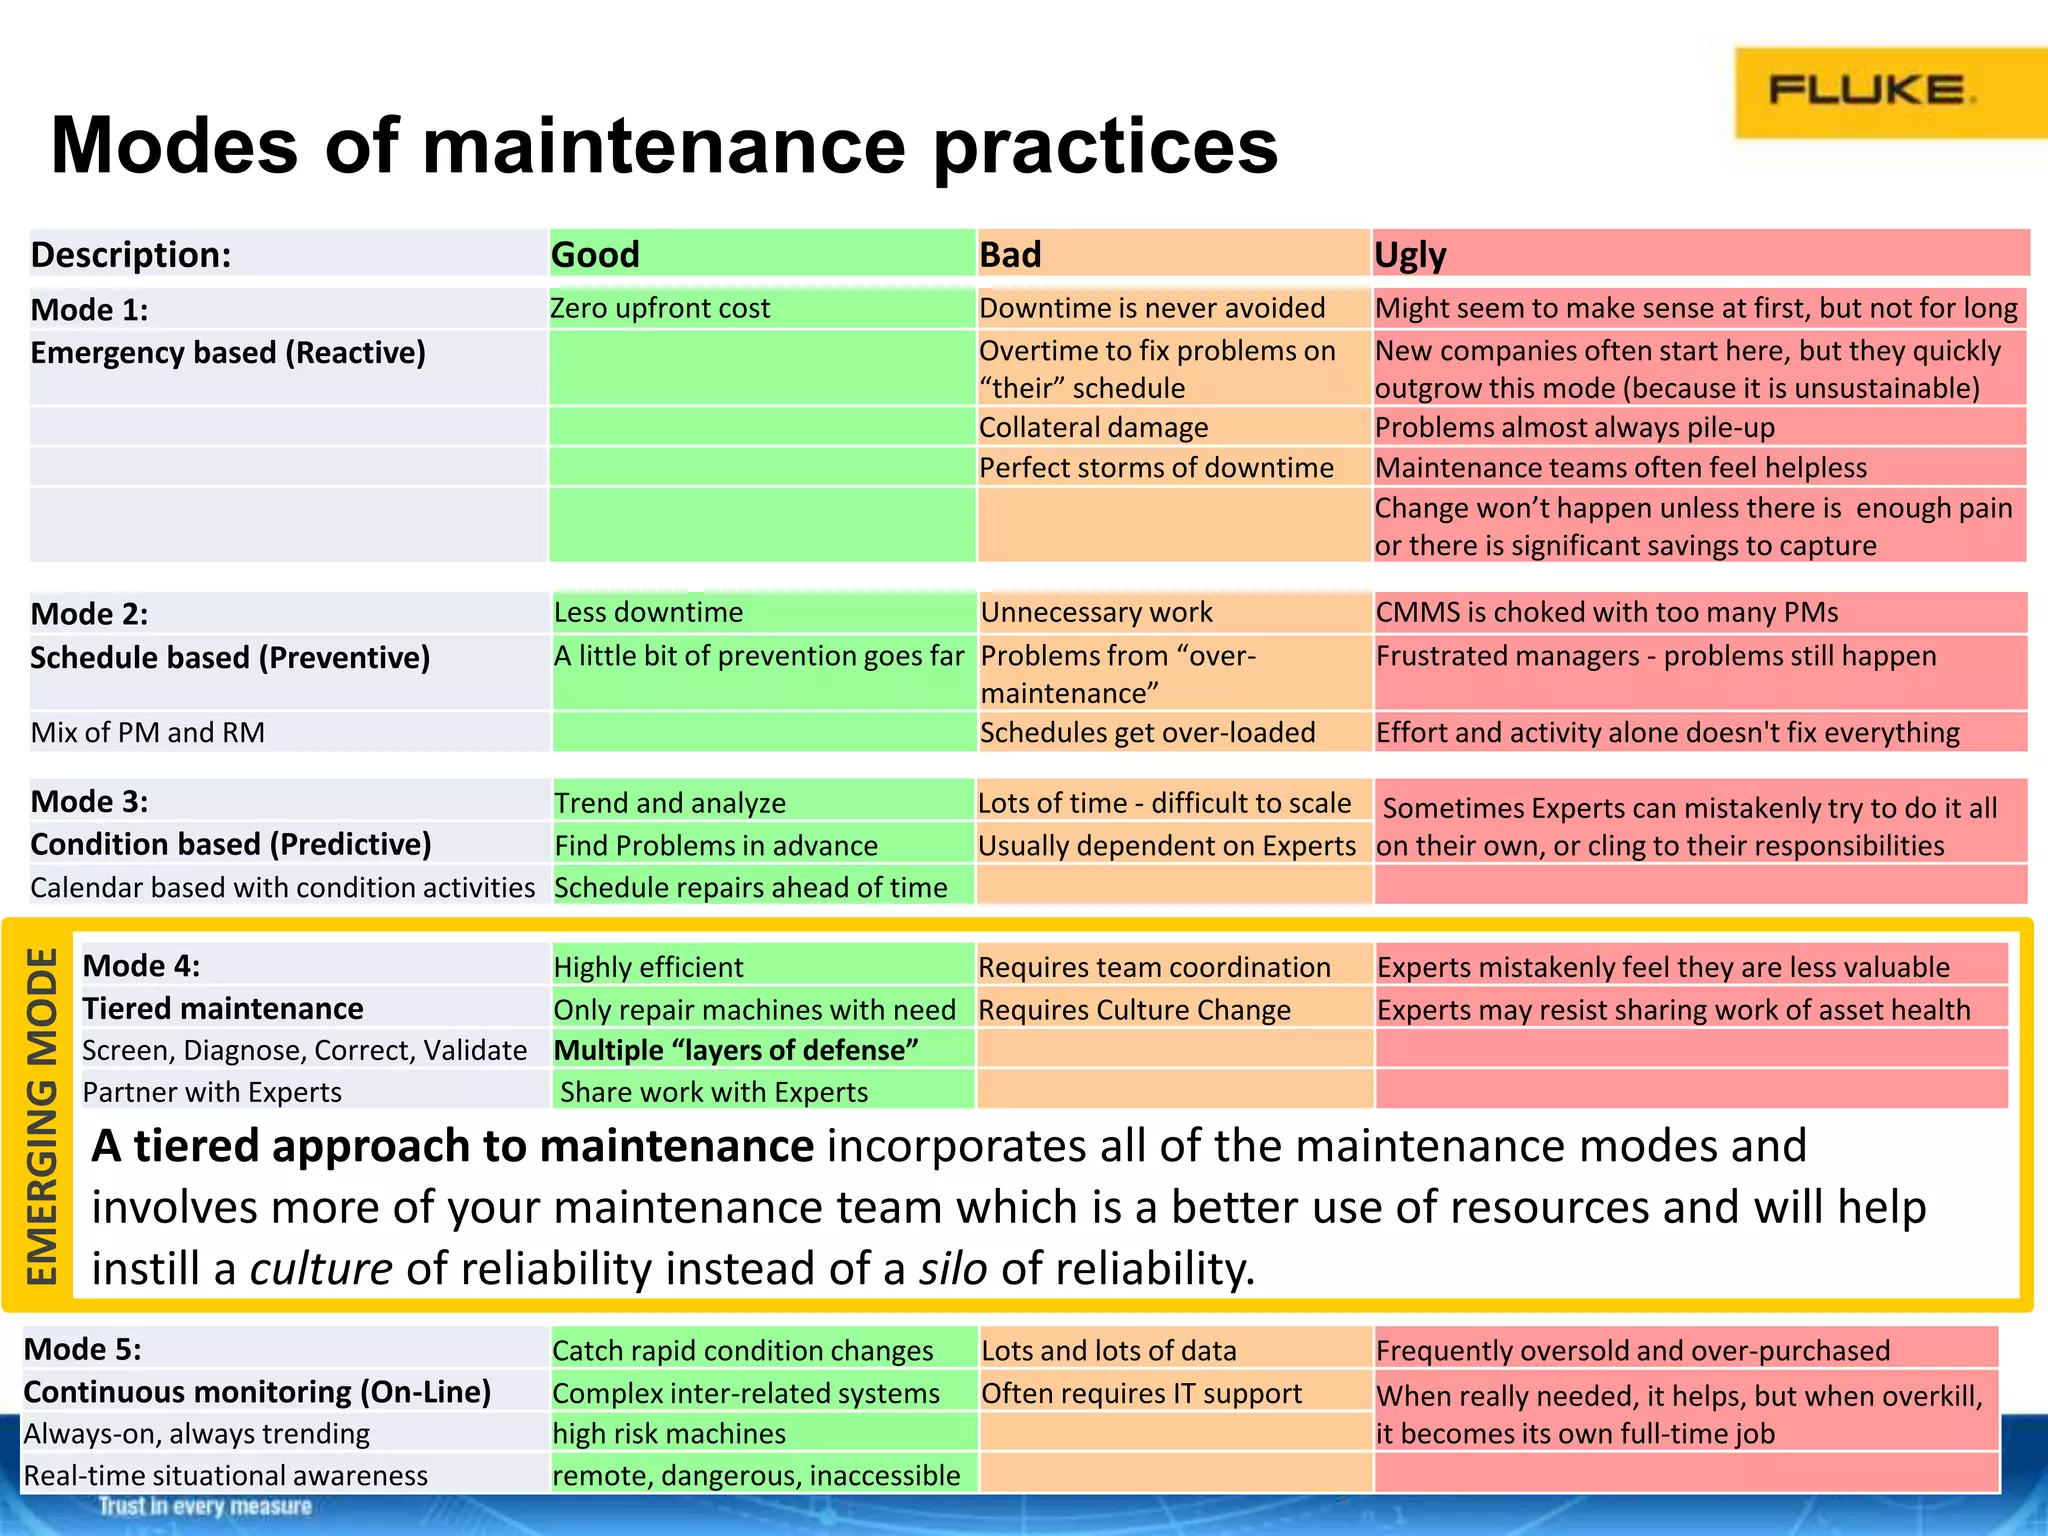
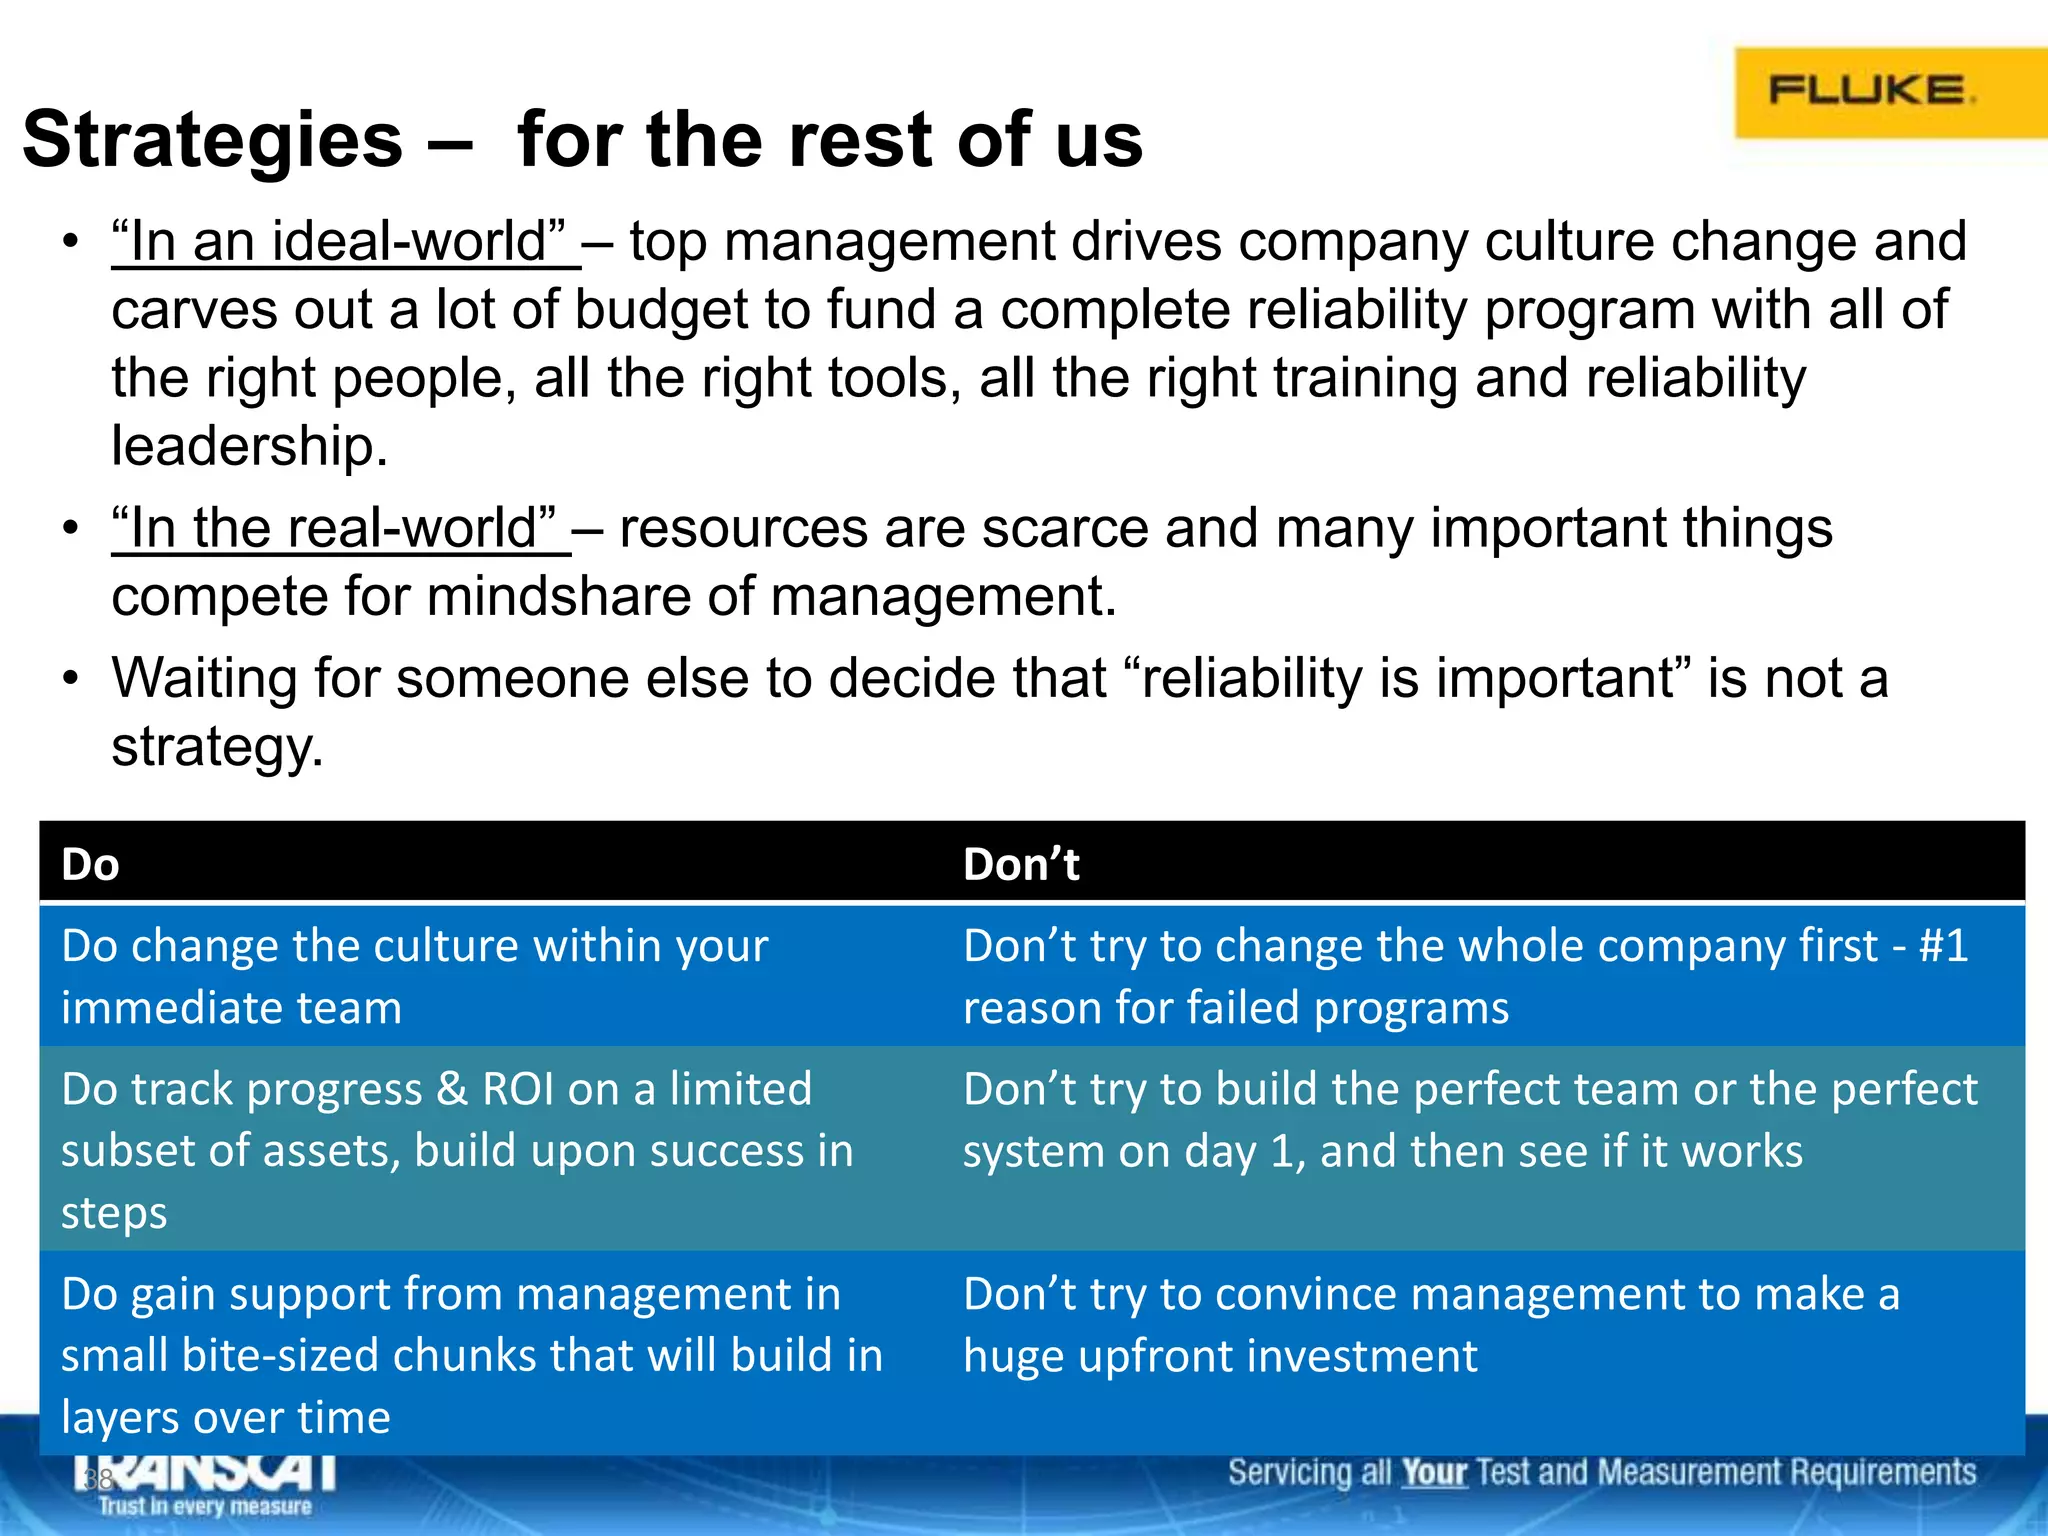
Simple Steps to Improve your
Maintenance program
Proactive Maintenance for the Rest of Us
Presented by John Bernet,
Fluke Corporation
Introduction – Benefits / Challenges
3 Pillars to Success
Solutions
Introduction
Summary
Agenda
Types of Maintenance Practices
Reactive Maintenance (RM):
“run to failure”
No actions taken until machinery
fails.
Unplanned downtime, high labor
costs, reduced production, high
maintenance costs, no schedules
Preventive Maintenance (PM):
“calendar-based”
Actions scheduled regardless of
actual condition of equipment.
Fault free machines repaired
unnecessarily, higher program
costs
Predictive Maintenance (PdM):
“condition-based”
Actions taken only after fault
found, monitored over time.
Equipment repaired when needed,
increased production, reduced
failures and maintenance costs
THEN
NOW
Past 30 years, there have been many different terms for the different
practices: preventive, predictive, reliability-centered, asset uptime ...
A more general approach to proactively improving the maintenance
program without giving it a label or making the structure too rigid to follow
• Predictability: give maintenance staff time to schedule
required repairs and acquire needed parts.
• Safety: take faulty equipment offline before a hazardous
condition occurs.
• Revenue: fewer unexpected and serious failures, helping to
prevent production stoppages that cut into the bottom line.
• Increased maintenance intervals: life of equipment can be
extended and maintenance can be scheduled by need.
• Reliability: fewer unexpected or catastrophic failures - problem
areas can be anticipated before failure
• Peace of mind: builds confidence in maintenance schedules,
budgeting, and productivity estimates.
Benefits of Proactive Maintenance
Different industries / companies will have different matrixes and targets.
Which of these benefits is most valuable to you?
Benefits & Challenges
• Benefits of Asset Uptime
– Predictability
– Safety
– Revenue
– Increased maintenance intervals
– Reliability
– Peace of mind
• Challenges to Implement
– Initial investment
– Culture shift from Preventive to
Predictive
– Full time resources to learn and
perform analysis
– Time to train team
– Mostly highly critical industries
like Petrochemical, Pulp &
Paper, Power Generation apply
condition monitoring
– Solutions for smaller facilities
without a maintenance program:
• Changing parts regularly before they
wear out
• Outsourcing
• Run to failure
There are three pillars to a maintenance program that will help
overcome these challenges – we will talk about them next
Economics
Awareness
Technology
Trends in Industrial Maintenance
DOWNTIME IS GETTING MORE EXPENSIVE
• Scale of facilities is increasing and commodity costs are increasing
• Facilities are becoming more specialized
MAINTENANCE MUST DO MORE WITH LESS
• Workforce becoming leaner – experts are retiring but not being replaced
• Production demands are up while budgets are continually decreasing
• Just In Time processes reduces room for error
AWARENESS IS GROWING QUICKLY
• The value of maintenance best practices is gaining significant attention from
industry influencers and professional associations
NEW MAINTENANCE TECHNOLOGIES ARE EXPERIENCING MASS ADOPTION
• Tool prices continue to fall while performance goes up
• Complex tools are becoming smarter and easier to use
• Maintenance practices are shifting from outsourced to in-sourced.
Companies are using maintenance best practices to reinforce
and extend their competitive advantages
#1 - New Program Start-up:
• Goals, start-up plan, staff buy-in
• Asset criticality, tiered maintenance, grow program
with continuous improvement
• Consulting, support, results metrics, documentation
#2 - Technology Selection:
• Different assets require a different mix of technologies
o Mechanical / Electrical / Process
• Different tools for each tier
o Screen / Diagnose / Correct
#3 - Data management:
• What to do with all of the data you’ve measured
and how to interpret it
• Which data is important to keep and which is not
• Data management strategies for any budget
7
3 Pillars to a successful maintenance program
Introduction – Benefits / Challenges
3 Pillars to Success
Solutions
Uptime
Summary
One of the fundamental tools of reliability program setup is a criticality analysis
1) Make a list of the assets in your plant
2) Score each asset against basic criteria – safety, production limiting, important, back-up, or
non-vital
3) Generate a rank / priority for every asset
4) Decisions are made based on criticality of assets and the relative impact of maintenance
activities on overall production
5) Can be a simple spreadsheet or management board or comprehensive program
9
Program Pillar #1 – Program Start-up
Criticality Analysis
Example Criticality List (Excel)
Example Asset Test Schedule (Excel)
The Criticality Dilemma
• If you do a criticality analysis, you get a long list, and so many things are critical. Do
you maintain what you can? Or hope for more resources?
• Traditionally, people think of their criticality list in one of 4 ways:
1) Binary: Create one cutoff line where everything above the line is critical and everything below the line is
non-critical. – “If it isn’t a critical asset, don’t bother me about it.”
2) Dynamic: Force-rank every asset into a list where each asset is more critical than the one below it. Start
at the top of the list and get as far down as you can in a given period. – “If I have time for 20 assets, I
do the first 20, If I have time for 100 assets, I do the first 100”
3) Every Asset on Its Own Schedule: Try to cover all assets by simply adjusting the frequency of
inspections and maintenance tasks. Important assets get frequent maintenance, less important assets
get less frequent maintenance, least important assets get the least frequent maintenance.
– “I can maintain every asset on earth, as long as I can schedule it out far enough”
4) Full Coverage: Scale up your resources, so you have full coverage on all of your critical assets – double
your maintenance staff, send everyone to full cross-training and certification, and buy all new tools.
– “Unless I have full staff and full budget, it’s not even worth trying to keep up”
• All of these approaches are inflexible, unsustainable, and miss the deeper root-
cause.
Better Asset Classification
• Star athletes: % of production or compliance is directly correlated with performance –
needs constant assessment and optimization regardless of condition, must be running at
peak performance at all times.
• Critical: Performance level is not as important as simply “running or not running”. – assets
can be small or large, expensive or inexpensive, and still be critical.
• Semi-critical: downtime/failure = strain on production or compliance – process may be able
to continue sub-optimally even if the asset fails. Some strain on production can eventually
lead to loss of production. If the asset can easily be repaired or replaced within that time
frame, it is classified as semi-critical, but if the asset can’t usually be repaired or replaced
within that time frame, it is critical.
• Non-critical: production or compliance are not affected by this asset – there may be other
reasons to fix this asset, but not because of direct production loss.
THEN NOW Criticality = Influence on Production $
Critical
Star Athlete % change in performance = % change in revenue
Critical Uptime = revenue, Downtime = no revenue
Non-Critical
Semi-Critical Downtime = “strain” on production or compliance
Non-Critical Downtime = no immediate affect on production
The Criticality Dilemma
• In the outside world, healthcare workers have a similar criticality dilemma:
• Everyone is EQUALLY important AND resources are limited. What to do?
1) Either create a cut-line and only serve the critical people - UNACCEPTABLE
2) Or, build-up the vast resources needed to give everyone 100% care - UNSUSTAINABLE.
What to do? Medical professionals have developed a ‘Tiered’ approach
1) Tiered levels of workers
2) Tiered levels of training and
certification
3) Tiered volume of visits
4) Tiered amount of time spent
on each person
Condition-based screening
helps relieve workload at
each level of care
Tiered maintenance
Benefits of Tiered
Maintenance
• Don’t spend time analyzing healthy
machines
• Reduce the number of work orders
• Don’t deploy your experts on
simple faults
Strategies, tips, tricks, rules-of-thumb –
For the Rest of US
“Real-world” strategies:
– Start small and grow  show success  get more budget to grow
– Use simple check lists and management boards before moving to
elaborate software programs
– Document success and celebrate ‘saves’ to gain cultural buy-in
– Start with simple machines, not the most complex in your plant (add
tough machines as your training curve improves)
– Don’t ‘fire’ your service provider, ‘focus’ your service provider – you
need them for the complex machines
1414
Program Pillar #2: Technology selection –
Where to start?
Oil Analysis
Ultrasonic
Vibration
Electrical
Thermography
Audible Noise
Hot to Touch
Energy Waste
Cost to Repair
• Each of these technologies can offer basic information or advanced information depending
upon the skill and experience of the user
• Different assets require a different mix of technologies: Electrical, Thermal, Mechanical
New Tool Advances Enable a Tiered
Maintenance Approach (example vibration)
How to incorporate a tester into your
maintenance program (example vibration)
Here’s what happens if we take the machines in a typical plant and put them into a pyramid:
17
A complete maintenance repair workflow
18
First, screen machines
to find out which ones
are good or bad
Second, diagnose machine
faults and determine repair
recommendation
Third, correct
the problem
Last step is to check
machine to ensure repair is
good and return to service
Program Pillar #3 – Data Management
Now that you have data coming in on all your assets, from your
entire team, across all technology types:
• How much data should be collected?
• Which data is important to keep and which is not?
• What to do with all of the data you’ve measured and how to interpret it?
Data management strategies for any budget
More data doesn’t always make finding
problems easier.
We need more of the right kind of data
Finding the answers and root causes
amongst your data can feel like finding a
needle in a haystack…
Data Management: Needles and Haystacks
Will adding more data to this pile help him find the problem faster? …It all depends
The “Acid Test” for Any
Data Management Program
Simple Sophisticated
- Are we managing our data in a way that enables analysis, or hinders analysis?
Are we analyzing any of the data we collect?
- Are we managing our data in a way that captures critical secondary data and
potential relationships between data?
- Are we managing our data in a way that ensures completeness, credibility, and
accuracy?
- Are we managing our data in a way that allows all team members and all
managers and all stakeholders to contribute and consume insights?
- Are we managing our data in a way that ensures it will be protected against loss
or corruption?
Overview – Benefits / Challenges
3 Pillars to Success
Solutions
The right tool for the job
Summary
Smart Tools - input power to work output
Input Power
Quality with
Fluke-435
Drive & Drive
output with
Fluke-190
Series-II
ScopeMeter
Motor Load
and winding
resistances
with Fluke-
289 DMM
Motor Insulation
with Fluke-1507
Process Tools
to calibrate &
troubleshoot
Electrical
Thermal
Mechanical
Fluke
Thermal
Imagers –
electrical,
mechanical,
and process
Motor core
temperatures with
Fluke Thermal
Imagers
Mechanical Vibration with
Fluke 810 then correct
alignment with Fluke 830
Think about your assets
holistically: electricity in
and work out
Every link in the chain is
a potential failure and
some links lie outside the
physical “machine”
Input Power
Quality
Drive & Drive Output
Signals
Motor Load
/ Windings
Motor
Insulation
Mechanical Vibration
& Alignment
Process Controls
& Variables
Fluke Connect  Collaboration Across All Tiers
ALL MEASUREMENT
TECHNOLOGIES
ALLASSETCATEGORIES
Teams that operate in a “tiered”
structure, across multiple
measurement technologies need:
• Real-Time Data Entry
• Real-Time Issue
Escalation
• Collaboration
• Comparison
• Additional Context
• Consistency /
Repeatability
Could a better tool ecosystem
influence:
• better work practices?
• and better collaboration?
• and a better maintenance culture?
Technologies & Solutions – Multiple Tools
Infrared Imagers Vibration and
Alignment
ScopeMeter and
Power Quality
Motor and
Insulation
Tester
Process Tools
Best technology for
finding electrical hot
spots in switchgear &
motor controllers,
screening process
and mechanical
Best technology for
diagnosing
mechanical faults in
rotating machines.
Correct shaft
misalignment.
Troubleshoot
problems in drive and
drive output, power
distribution - uncover
energy losses &
efficiency
Assures safe
operation,
prolongs life of
electrical
systems &
motors
Troubleshoot,
commission and
calibrate
transmitters,
valves, switches,
gauges
1. Faulty connections
2. Overheated
bearings
3. Tank levels
4. Process
1. Imbalance
2. Looseness
3. Misalignment
4. Bearings
1. Electrical harmonics
2. Distortion
3. Load Studies
1. Motor speed,
torque, power
and efficiency
2. Insulation
degradation
1. Pressure
2. Temperature
3. mA source
Thermography Mechanical Electrical Process
Introduction – Benefits / Challenges
3 Pillars to Success
Solutions
Next Steps
Summary
#1 - New Program Start-up:
• Goals, start-up plan, staff buy-in
• Asset criticality, tiered maintenance, grow program
with continuous improvement
• Consulting, support, results metrics, documentation
#2 - Technology Selection:
• Different assets require a different mix of technologies
o Mechanical / Electrical / Process
• Different tools for each tier
o Screen / Diagnose / Correct
#3 - Data management:
• What to do with all of the data you’ve measured
and how to interpret it
• Which data is important to keep and which is not
• Data management strategies for any budget
27
3 Pillars to a successful maintenance program
Thank You
• Any questions?
28
Examples of Cost Savings
1) EPRI – study of many plants in many different industries
A comprehensive study by the Electric Power Research Institute
found:
Maintenance practices Cost to maintain
rotating machinery
Cost savings
Plants that are Reactive
(Run to failure)
$17/HP/Year No savings
Plants that are Preventive
(Calendar-based)
$13/HP/Year 24% over Reactive
Plants that are Predictive
(Condition-based)
$9/HP/Year 47% over Reactive
Examples of Cost Savings
2) Cost to Benefit Studies
A large company implemented a Predictive Maintenance program on
hundreds of their motors, pumps, fans, compressors and blowers.
1) This program has been successful for over 30 years
2) They document the cost of the program and savings they enjoy.
3) Savings were many millions of dollars per year.
4) Every 2 years they conduct a Cost to Benefit study to compare the program cost
to the documented savings.
5) The average Cost to Benefit ratio for the past 30 years has been over 20:1.
The 9 benefits that they track include:
• prevention of catastrophic failure due to early detection,
• ability to schedule repairs during plant shutdown periods,
• ability to order parts in advance of repairs,
• ability to repair exact fault instead of complete overhaul or replacement,
• planning of workers schedules,
• root cause analysis of recurring faults, etc.
Examples of Cost Savings
3) Case Study – even small companies can benefit
Over a 16 year period, a small company transitioned from
Reactive to Preventive and then to Predictive Maintenance:
• Their unplanned failures have dropped to almost zero.
• Their annual maintenance budget on their 600 critical
motor/pumps has been cut in half from 10 years ago.
• Their pumps are running over twice as long before repairs
are needed.
• Almost all maintenance is scheduled instead of reacting to
emergencies which allows for planning repairs during the day
and eliminating the need for overtime.
Asset Health Dashboard
Different People can review asset condition data at different “tiers” of detail
1) High-Level Asset
Dashboard:
see the total condition of all
assets
2) Equipment Condition
Timeline:
compare the unique condition
patterns for individual assets to get
better insights
3) Full Measurement
History:
see the complete picture of all
the measurements taken on a
given asset
4) Measurement
Detail:
see the complete
picture all the
measurements taken
Drill-down to justification and
context for changes in condition
Drill-down to specific assets
Drill-down
to the
complete
asset
history
Drill-down to specific
measurement details
Drill-down to specific
measurement logs
Compare thermal images
and/or visual images
side-by-side to an original
baseline image
Data Management Options at any Budget
Does your current data management
system pass the “ACID Test”?
Can you think of ways you could supplement your
current data management system?
How do you know when it’s time to invest in greater
data management capability?
Analysis
Context
Integrity
Democratization
Security
Manual Notes:
Visual Management Board:
Excel Spreadsheets:
Forms, Templates, Checklists:
Tool-Specific Software:
Basic Asset Mgmt. or CMMS Software:
Large-Scale EAM or CMMS Software:
IncreasingCost
All Three Pillars Working Together…
• Go to FlukeConnect.com to learn more
• Start a free trial of Fluke Connect Assets today
• Talk to your Fluke Rep about Fluke Connect Assets
To Learn More on This Topic…
Program
Start-Up
Tech
Select
Data
Management
The End Goal Should Be
All of your maintenance people,
Working together in a “tiered” approach,
Basing the quantity and type of work on the “Class” of Asset being serviced,
Prioritizing the tools and techniques that will prevent the most common failure modes,
Monitoring the changing condition of those common failure modes over time,
Collecting and sharing information in a way that:
• Enables analysis
• Includes rich context
• Preserves data integrity
• Allows all team members to contribute and consume the data
• And provides appropriate data security
These three pillars together will deliver results, drive commitment, and change culture
35
Reactive :
“run to failure”
is a form of
maintenance in
which equipment
and facilities are
repaired only in
response to a
breakdown, fault or
defect
Preventive (PM):
“calendar-based”
care and servicing by
personnel for the
purpose of maintaining
equipment and facilities
in satisfactory operating
condition by providing
for systematic
inspection, detection,
and correction of
incipient failures either
before they occur or
before they develop into
major defects
Predictive (PdM):
“condition-based”
techniques help
determine the
condition of in-service
equipment in order to
predict when
maintenance should
be performed. This
approach offers cost
savings over routine or
time-based preventive
maintenance, because
tasks are performed
only when warranted
Time
Normal Operation Wear OutBreak In
The Bathtub Curve
Casualties
Reactive Proactive
Reliability Centered:
“Asset Uptime based”
a process to ensure that
assets continue to do
what their users require
in their present operating
context.
Emphasizes the use of
Predictive Maintenance
(PdM) techniques in
addition to traditional
preventive measures.
What about the many terms?
Modes of Maintenance Practices
Mode 1: Zero upfront cost Downtime never avoided Might seem to make sense at first
Emergency based (Reactive) Overtime New companies often start here
Collateral damage
Companies quickly outgrow this mode
(because it is unsustainable)
Perfect storms of downtime Problems compound
Maintenance teams often feel helpless
Change won’t happen unless there is enough
pain or there is significant money to capture
Mode 2: Less downtime Unnecessary work CMMS is choked with too many PMs
Schedule based (Preventive) A little bit of prevention goes far Problems from over-maint. Frustrated managers - problems still happen
Mix of PM and RM Schedules get over-loaded Effort and activity doesn't fix everything
Mode 3: Trend and analyze Lots of time - difficult to scale Sometimes Experts can mistakenly try to do it all
on their own, or cling to their responsibilitiesCondition based (Predictive) Find Problems in advance Usually dependent on Experts
Calendar based with condition activities Schedule repairs ahead of time
Mode 4: Rapid condition changes Lots and lots of data Frequently oversold and over-purchased
Continuous monitoring (On-Line) Complex inter-related systems Often requires IT support When really needed, it helps, but when overkill,
it becomes its own full-time jobAlways-on, always trending high risk machines
Real-time situational awareness remote, dangerous, inaccessible
Description: Good Bad Ugly
Continuous Monitoring doesn’t replace these methods, it is one of the modes – it can be a
more efficient mode of collecting data but doesn’t eliminate the need for data collection (it
simply minimizes data collection labor). If you already have a continuous monitoring
system, don’t tune out.
Studies in 60s and 70s by US Navy and airline industry showed that less than 20% of failures are
from wear (due to age) but most failures are from other causes  need machine monitoring.
36
Modes of maintenance practices
Mode 1: Zero upfront cost Downtime is never avoided Might seem to make sense at first, but not for long
Emergency based (Reactive) Overtime to fix problems on
“their” schedule
New companies often start here, but they quickly
outgrow this mode (because it is unsustainable)
Collateral damage Problems almost always pile-up
Perfect storms of downtime Maintenance teams often feel helpless
Change won’t happen unless there is enough pain
or there is significant savings to capture
Mode 2: Less downtime Unnecessary work CMMS is choked with too many PMs
Schedule based (Preventive) A little bit of prevention goes far Problems from “over-
maintenance”
Frustrated managers - problems still happen
Mix of PM and RM Schedules get over-loaded Effort and activity alone doesn't fix everything
Mode 3: Trend and analyze Lots of time - difficult to scale Sometimes Experts can mistakenly try to do it all
on their own, or cling to their responsibilitiesCondition based (Predictive) Find Problems in advance Usually dependent on Experts
Calendar based with condition activities Schedule repairs ahead of time
Mode 5: Catch rapid condition changes Lots and lots of data Frequently oversold and over-purchased
Continuous monitoring (On-Line) Complex inter-related systems Often requires IT support When really needed, it helps, but when overkill,
it becomes its own full-time jobAlways-on, always trending high risk machines
Real-time situational awareness remote, dangerous, inaccessible
Description: Good Bad Ugly
A tiered approach to maintenance incorporates all of the maintenance modes and
involves more of your maintenance team which is a better use of resources and will help
instill a culture of reliability instead of a silo of reliability.
Mode 4: Highly efficient Requires team coordination Experts mistakenly feel they are less valuable
Tiered maintenance Only repair machines with need Requires Culture Change Experts may resist sharing work of asset health
Screen, Diagnose, Correct, Validate Multiple “layers of defense”
Partner with Experts Share work with Experts
EMERGINGMODE
Strategies – for the rest of us
• “In an ideal-world” – top management drives company culture change and
carves out a lot of budget to fund a complete reliability program with all of
the right people, all the right tools, all the right training and reliability
leadership.
• “In the real-world” – resources are scarce and many important things
compete for mindshare of management.
• Waiting for someone else to decide that “reliability is important” is not a
strategy.
“Real-world” strategies:
38
Do Don’t
Do change the culture within your
immediate team
Don’t try to change the whole company first - #1
reason for failed programs
Do track progress & ROI on a limited
subset of assets, build upon success in
steps
Don’t try to build the perfect team or the perfect
system on day 1, and then see if it works
Do gain support from management in
small bite-sized chunks that will build in
layers over time
Don’t try to convince management to make a
huge upfront investment
Goals for a proactive maintenance program
• A little bit of planning up front will help you chart a course to
success and will accelerate your speed-to-success
• Discuss program start-up from a “real-world” perspective instead
of the usual “ideal-world” perspective – which can often feel
impossible or overwhelming in the beginning.
• We will discuss strategies, tips, tricks, rules-of-thumb to help keep
your program simple and grounded in reality, and balanced to
your available resources.
• This is only a one hour webinar, so we are going to focus on
practical advice to help you start-up a proactive maintenance
program, but it would be impossible to provide an all-inclusive
playbook for every company and situation.
• Starting with a “real-world” perspective that is sustainable and
scalable will lead to “world-class” over time.
3939
Next Steps
• Improve Your Maintenance Program
– Program Set-Up
– Determine Technology
• Call your Fluke Rep and Select the Best Tools
– Manage your data
• Make training and briefings part of your daily work
• Download helpful preventive maintenance
application notes and attend webinars at
fluke.com/uptime
• If you haven’t already, schedule a demo to see the
Fluke smart tools
4040
Thank You
Questions?
41
Special limited-time offer!
• Gift with purchase – up to $1350 value
• Free pressure module with Fluke 754 documenting
multifunction calibrator
– Now through December 19th
• Go to www.transcat.com/deals for more details
Questions or Comments?
Email Nicole VanWert-Quinzi
nvanwert@Transcat.com
Transcat: 800-800-5001
www.Transcat.com
For related product information, go to:
www.Transcat.com/Fluke

Simple Steps to Improve Your Maintenance Program

  • 1.
    Simple Steps toImprove your Maintenance program Proactive Maintenance for the Rest of Us Presented by John Bernet, Fluke Corporation
  • 2.
    Introduction – Benefits/ Challenges 3 Pillars to Success Solutions Introduction Summary Agenda
  • 3.
    Types of MaintenancePractices Reactive Maintenance (RM): “run to failure” No actions taken until machinery fails. Unplanned downtime, high labor costs, reduced production, high maintenance costs, no schedules Preventive Maintenance (PM): “calendar-based” Actions scheduled regardless of actual condition of equipment. Fault free machines repaired unnecessarily, higher program costs Predictive Maintenance (PdM): “condition-based” Actions taken only after fault found, monitored over time. Equipment repaired when needed, increased production, reduced failures and maintenance costs THEN NOW Past 30 years, there have been many different terms for the different practices: preventive, predictive, reliability-centered, asset uptime ... A more general approach to proactively improving the maintenance program without giving it a label or making the structure too rigid to follow
  • 4.
    • Predictability: givemaintenance staff time to schedule required repairs and acquire needed parts. • Safety: take faulty equipment offline before a hazardous condition occurs. • Revenue: fewer unexpected and serious failures, helping to prevent production stoppages that cut into the bottom line. • Increased maintenance intervals: life of equipment can be extended and maintenance can be scheduled by need. • Reliability: fewer unexpected or catastrophic failures - problem areas can be anticipated before failure • Peace of mind: builds confidence in maintenance schedules, budgeting, and productivity estimates. Benefits of Proactive Maintenance Different industries / companies will have different matrixes and targets. Which of these benefits is most valuable to you?
  • 5.
    Benefits & Challenges •Benefits of Asset Uptime – Predictability – Safety – Revenue – Increased maintenance intervals – Reliability – Peace of mind • Challenges to Implement – Initial investment – Culture shift from Preventive to Predictive – Full time resources to learn and perform analysis – Time to train team – Mostly highly critical industries like Petrochemical, Pulp & Paper, Power Generation apply condition monitoring – Solutions for smaller facilities without a maintenance program: • Changing parts regularly before they wear out • Outsourcing • Run to failure There are three pillars to a maintenance program that will help overcome these challenges – we will talk about them next
  • 6.
    Economics Awareness Technology Trends in IndustrialMaintenance DOWNTIME IS GETTING MORE EXPENSIVE • Scale of facilities is increasing and commodity costs are increasing • Facilities are becoming more specialized MAINTENANCE MUST DO MORE WITH LESS • Workforce becoming leaner – experts are retiring but not being replaced • Production demands are up while budgets are continually decreasing • Just In Time processes reduces room for error AWARENESS IS GROWING QUICKLY • The value of maintenance best practices is gaining significant attention from industry influencers and professional associations NEW MAINTENANCE TECHNOLOGIES ARE EXPERIENCING MASS ADOPTION • Tool prices continue to fall while performance goes up • Complex tools are becoming smarter and easier to use • Maintenance practices are shifting from outsourced to in-sourced. Companies are using maintenance best practices to reinforce and extend their competitive advantages
  • 7.
    #1 - NewProgram Start-up: • Goals, start-up plan, staff buy-in • Asset criticality, tiered maintenance, grow program with continuous improvement • Consulting, support, results metrics, documentation #2 - Technology Selection: • Different assets require a different mix of technologies o Mechanical / Electrical / Process • Different tools for each tier o Screen / Diagnose / Correct #3 - Data management: • What to do with all of the data you’ve measured and how to interpret it • Which data is important to keep and which is not • Data management strategies for any budget 7 3 Pillars to a successful maintenance program
  • 8.
    Introduction – Benefits/ Challenges 3 Pillars to Success Solutions Uptime Summary
  • 9.
    One of thefundamental tools of reliability program setup is a criticality analysis 1) Make a list of the assets in your plant 2) Score each asset against basic criteria – safety, production limiting, important, back-up, or non-vital 3) Generate a rank / priority for every asset 4) Decisions are made based on criticality of assets and the relative impact of maintenance activities on overall production 5) Can be a simple spreadsheet or management board or comprehensive program 9 Program Pillar #1 – Program Start-up Criticality Analysis Example Criticality List (Excel) Example Asset Test Schedule (Excel)
  • 10.
    The Criticality Dilemma •If you do a criticality analysis, you get a long list, and so many things are critical. Do you maintain what you can? Or hope for more resources? • Traditionally, people think of their criticality list in one of 4 ways: 1) Binary: Create one cutoff line where everything above the line is critical and everything below the line is non-critical. – “If it isn’t a critical asset, don’t bother me about it.” 2) Dynamic: Force-rank every asset into a list where each asset is more critical than the one below it. Start at the top of the list and get as far down as you can in a given period. – “If I have time for 20 assets, I do the first 20, If I have time for 100 assets, I do the first 100” 3) Every Asset on Its Own Schedule: Try to cover all assets by simply adjusting the frequency of inspections and maintenance tasks. Important assets get frequent maintenance, less important assets get less frequent maintenance, least important assets get the least frequent maintenance. – “I can maintain every asset on earth, as long as I can schedule it out far enough” 4) Full Coverage: Scale up your resources, so you have full coverage on all of your critical assets – double your maintenance staff, send everyone to full cross-training and certification, and buy all new tools. – “Unless I have full staff and full budget, it’s not even worth trying to keep up” • All of these approaches are inflexible, unsustainable, and miss the deeper root- cause.
  • 11.
    Better Asset Classification •Star athletes: % of production or compliance is directly correlated with performance – needs constant assessment and optimization regardless of condition, must be running at peak performance at all times. • Critical: Performance level is not as important as simply “running or not running”. – assets can be small or large, expensive or inexpensive, and still be critical. • Semi-critical: downtime/failure = strain on production or compliance – process may be able to continue sub-optimally even if the asset fails. Some strain on production can eventually lead to loss of production. If the asset can easily be repaired or replaced within that time frame, it is classified as semi-critical, but if the asset can’t usually be repaired or replaced within that time frame, it is critical. • Non-critical: production or compliance are not affected by this asset – there may be other reasons to fix this asset, but not because of direct production loss. THEN NOW Criticality = Influence on Production $ Critical Star Athlete % change in performance = % change in revenue Critical Uptime = revenue, Downtime = no revenue Non-Critical Semi-Critical Downtime = “strain” on production or compliance Non-Critical Downtime = no immediate affect on production
  • 12.
    The Criticality Dilemma •In the outside world, healthcare workers have a similar criticality dilemma: • Everyone is EQUALLY important AND resources are limited. What to do? 1) Either create a cut-line and only serve the critical people - UNACCEPTABLE 2) Or, build-up the vast resources needed to give everyone 100% care - UNSUSTAINABLE. What to do? Medical professionals have developed a ‘Tiered’ approach 1) Tiered levels of workers 2) Tiered levels of training and certification 3) Tiered volume of visits 4) Tiered amount of time spent on each person Condition-based screening helps relieve workload at each level of care
  • 13.
    Tiered maintenance Benefits ofTiered Maintenance • Don’t spend time analyzing healthy machines • Reduce the number of work orders • Don’t deploy your experts on simple faults
  • 14.
    Strategies, tips, tricks,rules-of-thumb – For the Rest of US “Real-world” strategies: – Start small and grow  show success  get more budget to grow – Use simple check lists and management boards before moving to elaborate software programs – Document success and celebrate ‘saves’ to gain cultural buy-in – Start with simple machines, not the most complex in your plant (add tough machines as your training curve improves) – Don’t ‘fire’ your service provider, ‘focus’ your service provider – you need them for the complex machines 1414
  • 15.
    Program Pillar #2:Technology selection – Where to start? Oil Analysis Ultrasonic Vibration Electrical Thermography Audible Noise Hot to Touch Energy Waste Cost to Repair • Each of these technologies can offer basic information or advanced information depending upon the skill and experience of the user • Different assets require a different mix of technologies: Electrical, Thermal, Mechanical
  • 16.
    New Tool AdvancesEnable a Tiered Maintenance Approach (example vibration)
  • 17.
    How to incorporatea tester into your maintenance program (example vibration) Here’s what happens if we take the machines in a typical plant and put them into a pyramid: 17
  • 18.
    A complete maintenancerepair workflow 18 First, screen machines to find out which ones are good or bad Second, diagnose machine faults and determine repair recommendation Third, correct the problem Last step is to check machine to ensure repair is good and return to service
  • 19.
    Program Pillar #3– Data Management Now that you have data coming in on all your assets, from your entire team, across all technology types: • How much data should be collected? • Which data is important to keep and which is not? • What to do with all of the data you’ve measured and how to interpret it? Data management strategies for any budget
  • 20.
    More data doesn’talways make finding problems easier. We need more of the right kind of data Finding the answers and root causes amongst your data can feel like finding a needle in a haystack… Data Management: Needles and Haystacks Will adding more data to this pile help him find the problem faster? …It all depends
  • 21.
    The “Acid Test”for Any Data Management Program Simple Sophisticated - Are we managing our data in a way that enables analysis, or hinders analysis? Are we analyzing any of the data we collect? - Are we managing our data in a way that captures critical secondary data and potential relationships between data? - Are we managing our data in a way that ensures completeness, credibility, and accuracy? - Are we managing our data in a way that allows all team members and all managers and all stakeholders to contribute and consume insights? - Are we managing our data in a way that ensures it will be protected against loss or corruption?
  • 22.
    Overview – Benefits/ Challenges 3 Pillars to Success Solutions The right tool for the job Summary
  • 23.
    Smart Tools -input power to work output Input Power Quality with Fluke-435 Drive & Drive output with Fluke-190 Series-II ScopeMeter Motor Load and winding resistances with Fluke- 289 DMM Motor Insulation with Fluke-1507 Process Tools to calibrate & troubleshoot Electrical Thermal Mechanical Fluke Thermal Imagers – electrical, mechanical, and process Motor core temperatures with Fluke Thermal Imagers Mechanical Vibration with Fluke 810 then correct alignment with Fluke 830 Think about your assets holistically: electricity in and work out Every link in the chain is a potential failure and some links lie outside the physical “machine” Input Power Quality Drive & Drive Output Signals Motor Load / Windings Motor Insulation Mechanical Vibration & Alignment Process Controls & Variables
  • 24.
    Fluke Connect Collaboration Across All Tiers ALL MEASUREMENT TECHNOLOGIES ALLASSETCATEGORIES Teams that operate in a “tiered” structure, across multiple measurement technologies need: • Real-Time Data Entry • Real-Time Issue Escalation • Collaboration • Comparison • Additional Context • Consistency / Repeatability Could a better tool ecosystem influence: • better work practices? • and better collaboration? • and a better maintenance culture?
  • 25.
    Technologies & Solutions– Multiple Tools Infrared Imagers Vibration and Alignment ScopeMeter and Power Quality Motor and Insulation Tester Process Tools Best technology for finding electrical hot spots in switchgear & motor controllers, screening process and mechanical Best technology for diagnosing mechanical faults in rotating machines. Correct shaft misalignment. Troubleshoot problems in drive and drive output, power distribution - uncover energy losses & efficiency Assures safe operation, prolongs life of electrical systems & motors Troubleshoot, commission and calibrate transmitters, valves, switches, gauges 1. Faulty connections 2. Overheated bearings 3. Tank levels 4. Process 1. Imbalance 2. Looseness 3. Misalignment 4. Bearings 1. Electrical harmonics 2. Distortion 3. Load Studies 1. Motor speed, torque, power and efficiency 2. Insulation degradation 1. Pressure 2. Temperature 3. mA source Thermography Mechanical Electrical Process
  • 26.
    Introduction – Benefits/ Challenges 3 Pillars to Success Solutions Next Steps Summary
  • 27.
    #1 - NewProgram Start-up: • Goals, start-up plan, staff buy-in • Asset criticality, tiered maintenance, grow program with continuous improvement • Consulting, support, results metrics, documentation #2 - Technology Selection: • Different assets require a different mix of technologies o Mechanical / Electrical / Process • Different tools for each tier o Screen / Diagnose / Correct #3 - Data management: • What to do with all of the data you’ve measured and how to interpret it • Which data is important to keep and which is not • Data management strategies for any budget 27 3 Pillars to a successful maintenance program
  • 28.
    Thank You • Anyquestions? 28
  • 29.
    Examples of CostSavings 1) EPRI – study of many plants in many different industries A comprehensive study by the Electric Power Research Institute found: Maintenance practices Cost to maintain rotating machinery Cost savings Plants that are Reactive (Run to failure) $17/HP/Year No savings Plants that are Preventive (Calendar-based) $13/HP/Year 24% over Reactive Plants that are Predictive (Condition-based) $9/HP/Year 47% over Reactive
  • 30.
    Examples of CostSavings 2) Cost to Benefit Studies A large company implemented a Predictive Maintenance program on hundreds of their motors, pumps, fans, compressors and blowers. 1) This program has been successful for over 30 years 2) They document the cost of the program and savings they enjoy. 3) Savings were many millions of dollars per year. 4) Every 2 years they conduct a Cost to Benefit study to compare the program cost to the documented savings. 5) The average Cost to Benefit ratio for the past 30 years has been over 20:1. The 9 benefits that they track include: • prevention of catastrophic failure due to early detection, • ability to schedule repairs during plant shutdown periods, • ability to order parts in advance of repairs, • ability to repair exact fault instead of complete overhaul or replacement, • planning of workers schedules, • root cause analysis of recurring faults, etc.
  • 31.
    Examples of CostSavings 3) Case Study – even small companies can benefit Over a 16 year period, a small company transitioned from Reactive to Preventive and then to Predictive Maintenance: • Their unplanned failures have dropped to almost zero. • Their annual maintenance budget on their 600 critical motor/pumps has been cut in half from 10 years ago. • Their pumps are running over twice as long before repairs are needed. • Almost all maintenance is scheduled instead of reacting to emergencies which allows for planning repairs during the day and eliminating the need for overtime.
  • 32.
    Asset Health Dashboard DifferentPeople can review asset condition data at different “tiers” of detail 1) High-Level Asset Dashboard: see the total condition of all assets 2) Equipment Condition Timeline: compare the unique condition patterns for individual assets to get better insights 3) Full Measurement History: see the complete picture of all the measurements taken on a given asset 4) Measurement Detail: see the complete picture all the measurements taken Drill-down to justification and context for changes in condition Drill-down to specific assets Drill-down to the complete asset history Drill-down to specific measurement details Drill-down to specific measurement logs Compare thermal images and/or visual images side-by-side to an original baseline image
  • 33.
    Data Management Optionsat any Budget Does your current data management system pass the “ACID Test”? Can you think of ways you could supplement your current data management system? How do you know when it’s time to invest in greater data management capability? Analysis Context Integrity Democratization Security Manual Notes: Visual Management Board: Excel Spreadsheets: Forms, Templates, Checklists: Tool-Specific Software: Basic Asset Mgmt. or CMMS Software: Large-Scale EAM or CMMS Software: IncreasingCost
  • 34.
    All Three PillarsWorking Together… • Go to FlukeConnect.com to learn more • Start a free trial of Fluke Connect Assets today • Talk to your Fluke Rep about Fluke Connect Assets To Learn More on This Topic… Program Start-Up Tech Select Data Management The End Goal Should Be All of your maintenance people, Working together in a “tiered” approach, Basing the quantity and type of work on the “Class” of Asset being serviced, Prioritizing the tools and techniques that will prevent the most common failure modes, Monitoring the changing condition of those common failure modes over time, Collecting and sharing information in a way that: • Enables analysis • Includes rich context • Preserves data integrity • Allows all team members to contribute and consume the data • And provides appropriate data security These three pillars together will deliver results, drive commitment, and change culture
  • 35.
    35 Reactive : “run tofailure” is a form of maintenance in which equipment and facilities are repaired only in response to a breakdown, fault or defect Preventive (PM): “calendar-based” care and servicing by personnel for the purpose of maintaining equipment and facilities in satisfactory operating condition by providing for systematic inspection, detection, and correction of incipient failures either before they occur or before they develop into major defects Predictive (PdM): “condition-based” techniques help determine the condition of in-service equipment in order to predict when maintenance should be performed. This approach offers cost savings over routine or time-based preventive maintenance, because tasks are performed only when warranted Time Normal Operation Wear OutBreak In The Bathtub Curve Casualties Reactive Proactive Reliability Centered: “Asset Uptime based” a process to ensure that assets continue to do what their users require in their present operating context. Emphasizes the use of Predictive Maintenance (PdM) techniques in addition to traditional preventive measures. What about the many terms?
  • 36.
    Modes of MaintenancePractices Mode 1: Zero upfront cost Downtime never avoided Might seem to make sense at first Emergency based (Reactive) Overtime New companies often start here Collateral damage Companies quickly outgrow this mode (because it is unsustainable) Perfect storms of downtime Problems compound Maintenance teams often feel helpless Change won’t happen unless there is enough pain or there is significant money to capture Mode 2: Less downtime Unnecessary work CMMS is choked with too many PMs Schedule based (Preventive) A little bit of prevention goes far Problems from over-maint. Frustrated managers - problems still happen Mix of PM and RM Schedules get over-loaded Effort and activity doesn't fix everything Mode 3: Trend and analyze Lots of time - difficult to scale Sometimes Experts can mistakenly try to do it all on their own, or cling to their responsibilitiesCondition based (Predictive) Find Problems in advance Usually dependent on Experts Calendar based with condition activities Schedule repairs ahead of time Mode 4: Rapid condition changes Lots and lots of data Frequently oversold and over-purchased Continuous monitoring (On-Line) Complex inter-related systems Often requires IT support When really needed, it helps, but when overkill, it becomes its own full-time jobAlways-on, always trending high risk machines Real-time situational awareness remote, dangerous, inaccessible Description: Good Bad Ugly Continuous Monitoring doesn’t replace these methods, it is one of the modes – it can be a more efficient mode of collecting data but doesn’t eliminate the need for data collection (it simply minimizes data collection labor). If you already have a continuous monitoring system, don’t tune out. Studies in 60s and 70s by US Navy and airline industry showed that less than 20% of failures are from wear (due to age) but most failures are from other causes  need machine monitoring. 36
  • 37.
    Modes of maintenancepractices Mode 1: Zero upfront cost Downtime is never avoided Might seem to make sense at first, but not for long Emergency based (Reactive) Overtime to fix problems on “their” schedule New companies often start here, but they quickly outgrow this mode (because it is unsustainable) Collateral damage Problems almost always pile-up Perfect storms of downtime Maintenance teams often feel helpless Change won’t happen unless there is enough pain or there is significant savings to capture Mode 2: Less downtime Unnecessary work CMMS is choked with too many PMs Schedule based (Preventive) A little bit of prevention goes far Problems from “over- maintenance” Frustrated managers - problems still happen Mix of PM and RM Schedules get over-loaded Effort and activity alone doesn't fix everything Mode 3: Trend and analyze Lots of time - difficult to scale Sometimes Experts can mistakenly try to do it all on their own, or cling to their responsibilitiesCondition based (Predictive) Find Problems in advance Usually dependent on Experts Calendar based with condition activities Schedule repairs ahead of time Mode 5: Catch rapid condition changes Lots and lots of data Frequently oversold and over-purchased Continuous monitoring (On-Line) Complex inter-related systems Often requires IT support When really needed, it helps, but when overkill, it becomes its own full-time jobAlways-on, always trending high risk machines Real-time situational awareness remote, dangerous, inaccessible Description: Good Bad Ugly A tiered approach to maintenance incorporates all of the maintenance modes and involves more of your maintenance team which is a better use of resources and will help instill a culture of reliability instead of a silo of reliability. Mode 4: Highly efficient Requires team coordination Experts mistakenly feel they are less valuable Tiered maintenance Only repair machines with need Requires Culture Change Experts may resist sharing work of asset health Screen, Diagnose, Correct, Validate Multiple “layers of defense” Partner with Experts Share work with Experts EMERGINGMODE
  • 38.
    Strategies – forthe rest of us • “In an ideal-world” – top management drives company culture change and carves out a lot of budget to fund a complete reliability program with all of the right people, all the right tools, all the right training and reliability leadership. • “In the real-world” – resources are scarce and many important things compete for mindshare of management. • Waiting for someone else to decide that “reliability is important” is not a strategy. “Real-world” strategies: 38 Do Don’t Do change the culture within your immediate team Don’t try to change the whole company first - #1 reason for failed programs Do track progress & ROI on a limited subset of assets, build upon success in steps Don’t try to build the perfect team or the perfect system on day 1, and then see if it works Do gain support from management in small bite-sized chunks that will build in layers over time Don’t try to convince management to make a huge upfront investment
  • 39.
    Goals for aproactive maintenance program • A little bit of planning up front will help you chart a course to success and will accelerate your speed-to-success • Discuss program start-up from a “real-world” perspective instead of the usual “ideal-world” perspective – which can often feel impossible or overwhelming in the beginning. • We will discuss strategies, tips, tricks, rules-of-thumb to help keep your program simple and grounded in reality, and balanced to your available resources. • This is only a one hour webinar, so we are going to focus on practical advice to help you start-up a proactive maintenance program, but it would be impossible to provide an all-inclusive playbook for every company and situation. • Starting with a “real-world” perspective that is sustainable and scalable will lead to “world-class” over time. 3939
  • 40.
    Next Steps • ImproveYour Maintenance Program – Program Set-Up – Determine Technology • Call your Fluke Rep and Select the Best Tools – Manage your data • Make training and briefings part of your daily work • Download helpful preventive maintenance application notes and attend webinars at fluke.com/uptime • If you haven’t already, schedule a demo to see the Fluke smart tools 4040
  • 41.
  • 42.
    Special limited-time offer! •Gift with purchase – up to $1350 value • Free pressure module with Fluke 754 documenting multifunction calibrator – Now through December 19th • Go to www.transcat.com/deals for more details
  • 43.
    Questions or Comments? EmailNicole VanWert-Quinzi nvanwert@Transcat.com Transcat: 800-800-5001 www.Transcat.com For related product information, go to: www.Transcat.com/Fluke